


developer_mh
-
Posts
1,860 -
Joined
-
Last visited
-
Days Won
173
Everything posted by developer_mh
-
Hi Diego, please contact our hotline at hotline@valentin-software.com, they also have access to the licence management. Kind regards, Martin
-
Hi Stuart, could you try to load the example project 'Photo plan' and check if Photo Plan works there? Kind regards, Martin
-
Hi all, if you want to use Excel to convert the decimal coordinates e.g. from Google Maps into the pseudo degree.minute representation that is necessary for the dat file format, you can use this formula: =(A1-FLOOR.MATH(A1))*60/100+FLOOR.MATH(A1) Hope this helps, kind regards, Martin
-
 Hello Maha, to achieve this, you can use the 'Configure Module Areas together' feature. See this post here on a similar question: When you search the forum, you will find some more information on that. Hope this helps! Kind regards, Martin
 -
How to construct a round roof within the software (Base profile)
developer_mh replied to Tim's topic in PV*SOL
Hi Tim, if you refer to .dwfx and .dwf file format from Autodesk, I am almost sure that you can export your models into .obj or similar in their programs. I don't have AutoCAD here, so I can't test it, but it should work. Kind regards, Martin -
Hi James, I tried to reproduce the change of the irradiation values, but here I also get around 875 kWh/m² in a fresh install of PV*SOL premium 2018 R5. So I suppose that the climate file might perhaps date back to PV*SOL premium 2018 R4, which was before we updated MeteoNorm to version 7.2. MeteoNorm is the climate data provider we use in MeteoSyn. When I create a new climate file with a fresh install of PV*SOL premium 2018 R4, I also get around 950 kWh/m². In MeteoNorm 7.2 there are a couple of changes that also affect global irradiation sums. If we have a look at the map with the differences of the global irradiation in the region where Scunthorpe is located, we can see that there is an area of negative deviation of around -50 to -100 kWh/m²: http://www.meteonorm.com/images/uploads/demo_uploads/diff_ghi_v72_vs_v715_europe.png On their website you'll also find the changelog that lists the changes of the data and the models they use: http://www.meteonorm.com/en/support/changelog I hope that helps and re-establishes the confidence in our product If you have further questions, please don't hesitate to ask. Kind regards, Martin
-
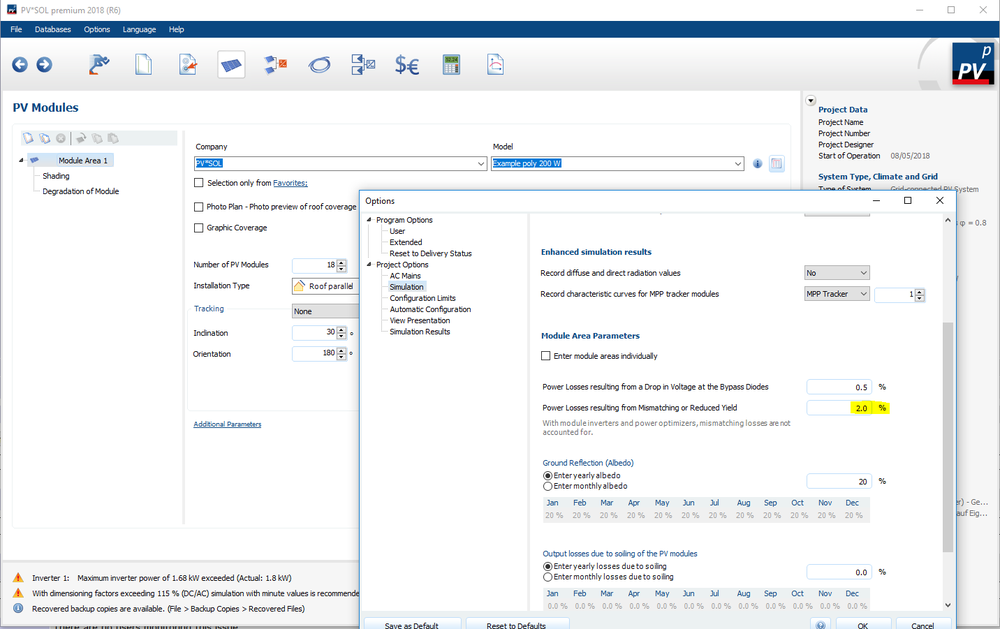
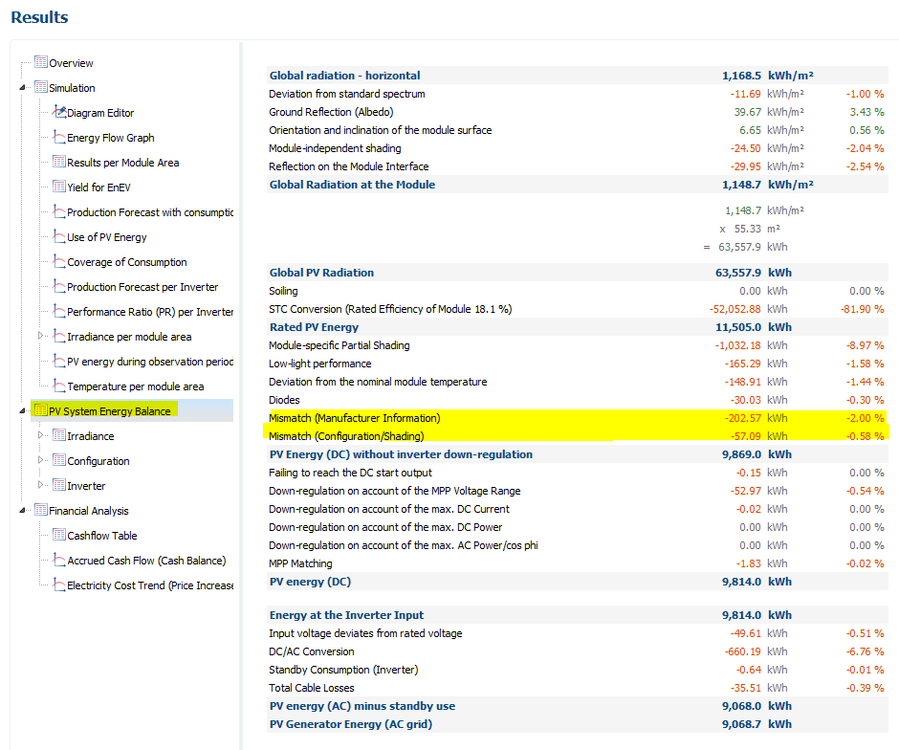
Hi Hayder Ali, there are several mismatch effects that we consider: In all projects we assume a standard factor for the mismatch losses in PV modules due to the small deviations of the nominal power of the PV modules. That means, that if you buy a set of PV modules labelled with 250 Wp, you will get some that have exactly 250 Wp, but others that have slightly more, perhaps sometimes even a bit less. Due to these differences, the PV modules will not react equally to irradiance or temperature changes, small inhomogenities occur in the field, and so you will have small mismatch losses. You can change the default value of 2% (which is very conservative) in the simulation options: Another type of mismatch, and the more important one, is a consequence of inhomogeneous shading on the modules, or different orientations of the module areas. So the shading effect can only be simulated when using the 3D environment. Modules in PV systems with near shading objects will always receive different levels of solar irradiance, and in consequence the feature varying i-v characteristics. For all PV modules in a string, the i-v characteristics are superposed, and when there are parallel strings, these i-v curves are superposed as well. The MPP tracker only sees the superposed i-v curve of the PV field and searches for the point of maximum power on this curve. This point will be the maximum for the PV field, but it will be less than the sum of all individual points of maximum power per PV module most of the time. This difference is the mismatch loss due to configuration or shading. You can read more on the superposition of the i-v curves here: https://help.valentin-software.com/pvsol/2018/calculation/pv-field/ You find both mismatch losses in the energy balance at the end: I hope this helps. If you have further question, please don't hesitate to ask. Kind regards, Martin
-
Hi camilo, The 3D map feature was introduced in PV*SOL premium 2016 Release 1 (November 23rd, 2015), PV*SOL premium 7.5 R4 version is older than that, which means, that the feature is not in the version you use. To have access to the newest features, please update to the newest version, right now it is PV*SOL premium 2018 R5. You can also test it 30 days for free, nearly without restrictions: https://www.valentin-software.com/en/products/photovoltaics/57/pvsol-premium Good luck! Martin
-
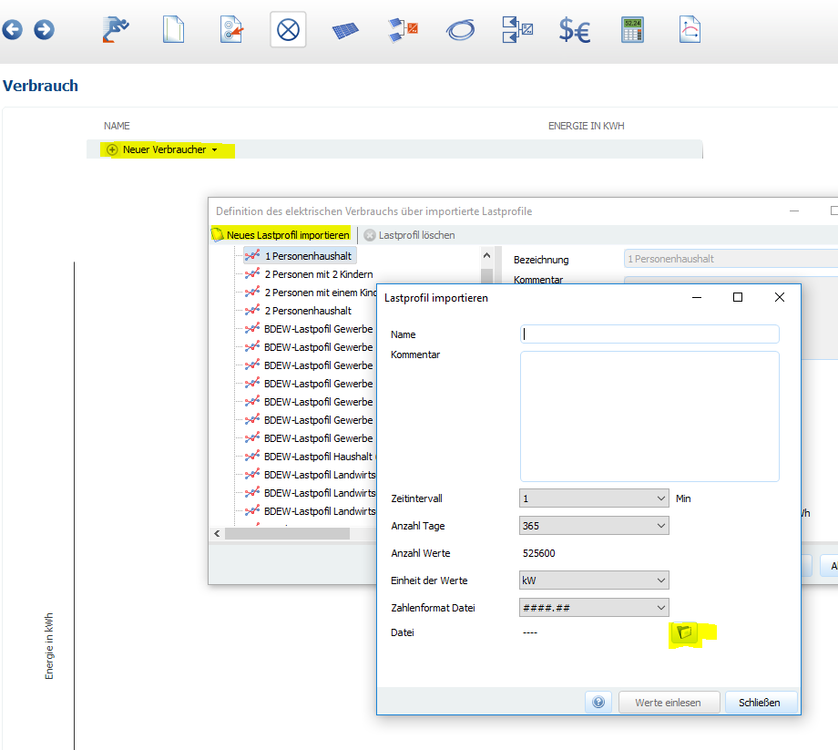
Hallo Maria (und andere), das hier hat sich auf eine sehr alte Version von PV*SOL bezogen. In den aktuellen Versionen kann man ganz normal auch csv-Dateien als Lastprofil einlesen. Siehe hier: https://forum.valentin-software.com/topic/671-lastprofile/?tab=comments#comment-1675 Beste Grüße, Martin
-
Hallo Maria, du kannst bei den Verbrauchern auch csv-Dateien einlesen. Einfach auf Neuer Verbraucher, dann auf den ersten Eintrag "Lastprofile laden und importieren", dann oben auf "Neues Lastprofil importieren" et voilà. In dem Dialog kannst du die entsprechenden Werte einstellen und deine Datei einlesen. Viel Erfolg! Martin
-
Hi hazywayrunner, in PV*SOL you will always have to define some kind of inverter in order to have MPP and voltage conversion functionalities etc. If you are interested in a DC application, you could change the grid voltage to your DC voltage (say 12 or 48 V or the like) and define an inverter that is really behaving like a DC/DC converter then, but with MPP tracking functionality included. But you can't disable the inverters or the AC grid. You just use inverters as DC converters and the AC grid would be your DC grid Kind regards, Martin
-
Hi Nils, no, the installation type "flush mount - good rear ventilation" / "roof parallel" always uses the 29 K as temperature difference at 1000 W/m². Kind regards, Martin
-
Hi Farzad, you are right, the option to calculate the optimum tilt angle is missing in 3D. We have it on our list, but in the mean while you would have to start a new 2D project, select the location you want to use later in 3D and calculate your optimum tilt angle and write it down somewhere. Then you know it for your 3D planning later. Sorry for the inconvenience, kind regards, Martin
-
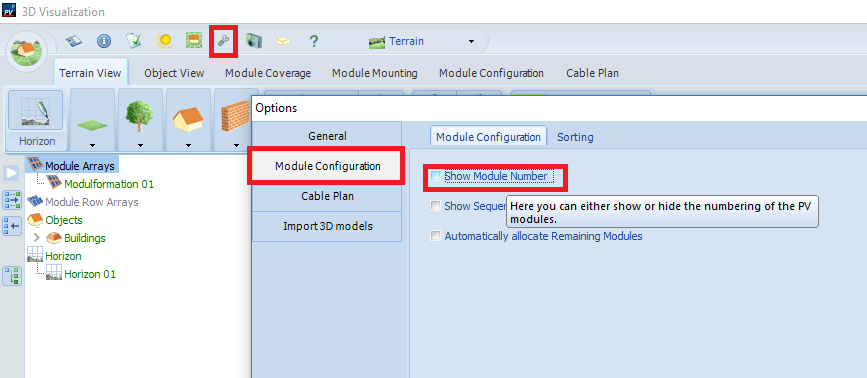
Hi Yvar, if you zoom out far enough, the module labels will disappear at some point. But there is no option to disable them completely in the module configuration section. You can, however, disable the display of the module numer (the last digit), perhaps this decreases the complexity enough? Kind regards, Martin
-
How to construct a round roof within the software (Base profile)
developer_mh replied to Tim's topic in PV*SOL
Hi Tim, see this post here for reference: https://forum.valentin-software.com/topic/468-curved-building-in-pvsol You could also import your own 3D model that you have created with another 3D software like Sketchup or similar, but you should be aware of the fact that you can only place PV modules on flat surfaces. This is why you will have to approximate your round roof with several sections of plane surfaces. Hope that helps, Martin -
Hello Muhammad, Meteonorm 7.2 is integrated in PV*SOL premium 2018 R5, so you don't have to buy it separately. You can buy it as a stand-alone version though, if you don't need PV*SOL. But if you want to use Meteonorm 7.2 with PV*SOL, then you need to have PV*SOL premium 2018 R5. In that case you don't need Meteonorm 7.2 as stand-alone version. You can see what data is included in Meteonorm 7.2 (and in PV*SOL as well) here: http://www.meteonorm.com/ Kind regards, Martin
-
the backtracking function ensures that there is no shadow from adjacent trackers on the module. To accomplish that, the trackers must stop following the sun at some point, so that the modules don't have the optimal angle towards the sun anymore. So the solar irradiation on the modules will always be a bit smaller with backtracking enabled compared to shading-free tracker rows with larger distance. If the row distance increases, the backtracking can start later and the losses due to suboptimally oriented modules decrease. Kind regards, Martin
-
Hi Ahmad, see this diagram here: Your surface usage factor is (width or height of PV) / (distance of trackers). If row distance is 4 meters and your trackers are 2 meters high, the surfacce usage factor is 0.5. It is important that the dimension or axis in which you measure your module (width or height) is the same as the distance of your trackers. Kind regards, Martin

-
ah, yes, of course, sorry. I will correct it my post above..
-
yes, you are right about the surface usage factor, given that your land is levelled. The rotation axis incline is the angle around which your rotation axis is rotated It is hard to explain in words I guess... If you set this value to 90°, the rotation axis is vertical, so your modules will rotate like a revolving door, around a vertical axis. If you set this value to 0°, then the rotation axis is horizontal, from South to North, and the modules will rotate like a lid from trash can perhaps. Or like a seesaw, where one kid is sitting in the West and the other in the East. Any value in between would be comparable to the rotation of a revolving door when the whole floor is tilted. Does that help? Kind regards, Martin
-
ok, so are your modules mounted vertically on the tracking system? If not, you would have to enter the tilt angle at "Rotation Axis Incline". Your Rotational Angle of Opening would be 104° (2 x 52°). The surface usage factor really depends on how close you want to install the trackers, how high they are, the tilt angle of your land and so on. If you just want to simulate one tracking system, set it 0. Kind regards, Martin
-
Hi Ahmad, there are three different kinds of single axis tracking: Rotation around one axis in the North-South plane (Single North-South Axis in PV*SOL) Rotation around the East-West axis (Single East-West Axis in PV*SOL) Rotation around the vertical axis (Single Vertical Rotation Axis in PV*SOL) First you will have to decide what kind of tracking system you want to simulate. There are small images in PV*SOL that will help you to understand the differences. And here are some more explanations: https://help.valentin-software.com/pvsol/2018/pages/pv-modules/#tracking The Surface Usage Factor (space utilization factor) is explained as follows: If the land itself is inclined, you will have to adapt the surface usage factor according to the trigonometry. If you need help with that, let us know. Kind regards, Martin
-
Hi Victor, thanks for the hint. I will forward it to my colleague who takes care of the database. But usually we do not update the data ourselves, it is the manufacturer who is responsible for the data. So we will inform Trina that there are some modules to be updated. Thanks and kind regards, Martin
-
Hallo Jarn, wir sind ja alle selbst keine Installateure, insofern können wir nicht wirklich beurteilen, wer heute noch alles Blockdioden einbaut. Allerdings verfolgen wir die Branche schon sehr lange (30 Jahre jetzt) und haben schon lange nichts mehr von Blockdioden gehört. Elektrisch wird es ja auch erst dann kritisch, wenn zwei Strings mit unterschiedlicher Modulanzahl parallel geschaltet werden, weil sich erst dann die Strangspannungen wesentlich unterscheiden. Bei dem von dir angesprochenen Ost-West-Dach - gleiche Modulanzahl vorausgesetzt - unterscheiden sich eher die Ströme. Heutige Module sind in ihrem Spannungsverhalten auch wesentlich konstanter als sie das früher waren, also in Abhängigkeit der Einstrahlung. Damit ist die Gefahr, dass ein String Leistung in den anderen drückt, eher von theoretischer Natur. Aber vielleicht können ein paar Leute aus der Praxis hier noch ihre Meinung ergänzen? Beste Grüße, Martin
-
Hi Victor, thanks for the input and also the mail. My colleague who is handling the database requests is in holiday right now, so he will take care of it when he returns next week. Kind regards, Martin


