


developer_mh
-
Posts
1,855 -
Joined
-
Last visited
-
Days Won
173
Everything posted by developer_mh
-

Small increase of PR in simulations with power optimizers
developer_mh replied to UserPV's topic in PV*SOL
Hi João, what you found it is absolutely right. The use cases where power optimizers really can help to generate significantly more energy are rare. The results you report here are realistic, in general you will have only one or two percent more energy yield. For a conference earlier this year we had a poster contribution that came to the same conclusion: https://www.valentin-software.com/sites/default/files/poster_leistungsoptimierer.pdf It is in German, but from the images and figures you will get the point. We compare different shading situations and connection schemes and present the energy surplus that you can excpet from different power optimizing techniques. Hope that helps, kind regards, Martin -
Hi João, there are shortcuts to move the camera, like W (move forward), A (move left), S (move backwards), D (move right), R (move up) and F (move down), but unfortunately not for rotating objects. But I will forward your input to our 3D team. Kind regards, Martin
-
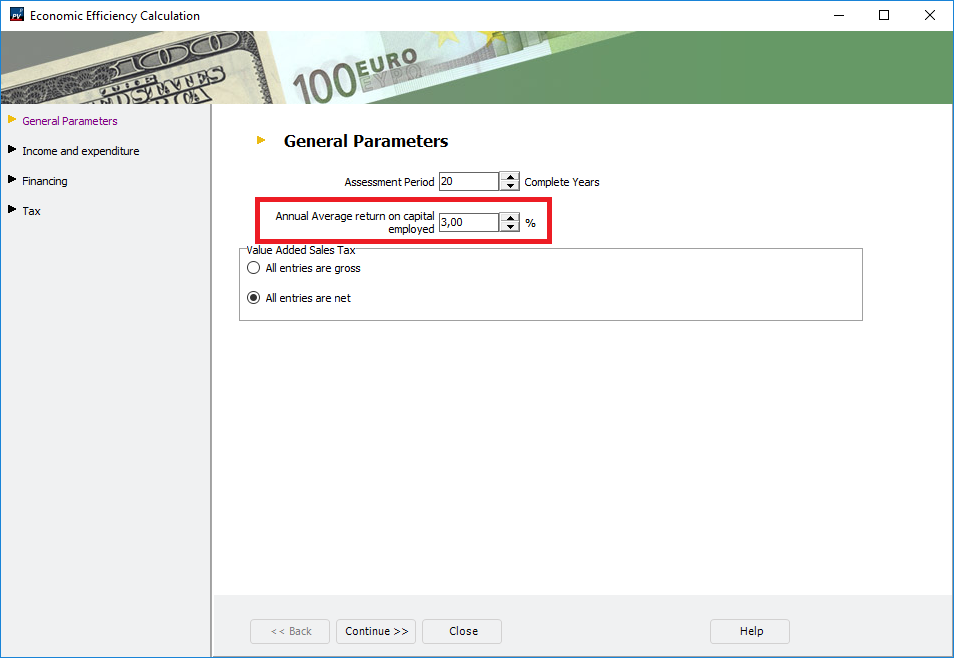
Hi mads, sorry for the late reply, we had a lot of colleagues on holiday and parental leave at the same time in the last weeks. Could you provide a project file so that we can better understand the problem? But in general, the electricity cost trend and all other economic parameters are overlayed by the Annual average rate of return on capital, which you can edit on the page 'Economics', then first button on the page 'Edit', and first tab: Hope that helps, kind regards, Martin
-
Hi João, you are absolutely right, we only designed a part of the Neuhardenberg project for the PV*SOL example project. And I guess you are also right about the estimation of the annual energy yield . 19,690,000 kWh per year would be a bit poor, I reckon they forgot a 0 there. Kind regards, Martin
-
Hi Jon, sorry for the late reply, we had a lot of colleagues on holiday and parental leave at the same time in the last weeks. The timestamp is local time, yes. But we do not account for the daylight time saving switch in March and October. So for Madrid it will be UTC+1. Kind regards, Martin
-
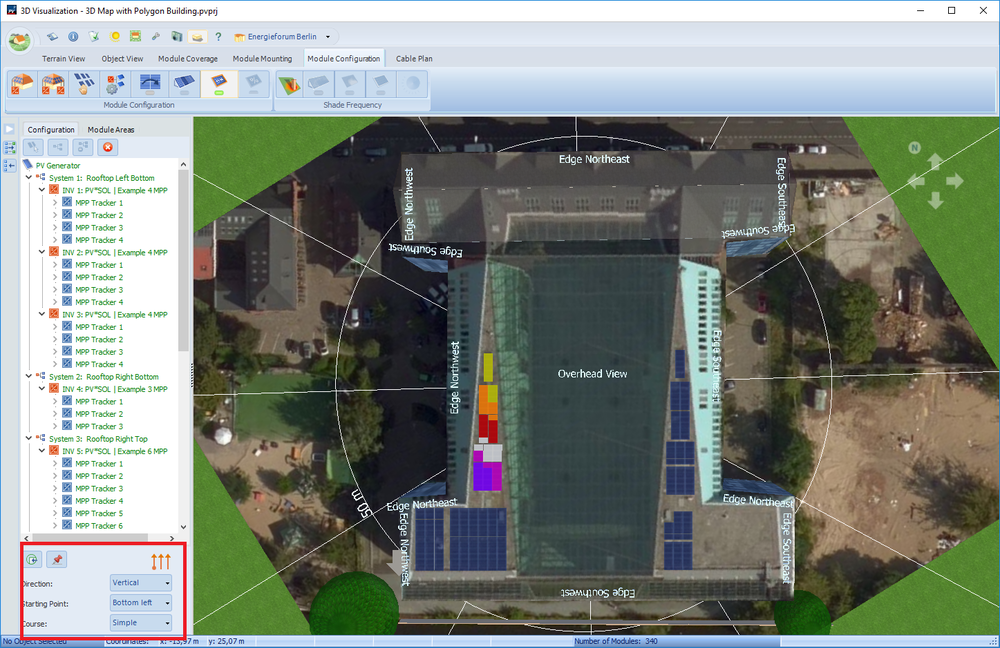
Hi james, sorry for the late reply, we had a lot of colleagues on holiday and parental leave at the same time in the last weeks. You can select the direction and the starting points for the automatic connection with the buttons in the bottom left corner of the 'Module Configuration' page: With these options you can achieve almost every desired connection scheme. And in addition you can also edit the connection manually if you want. Just drag and drop the modules around. Hope this helps, kind regards, Martin
-
Hallo Tim, wir hinterlegen keine Preise für Module oder Batteriespeicher oder andere Komponenten in der Datenbank. Grund dafür ist, dass jeder Projektierer oder Anlagenplaner mit Sicherheit unterschiedliche Preise bekommt, je nachdem, welche Volumen er bei welchem Großhändler abfragt, wo auf der Welt er sich befindet und wie der Markt dort gerade läuft. Die Stückkosten oder Gesamtkosten für die Anlage sind also individuell vom Planer in PV*SOL einzutragen, entweder als Einzelposten oder pauschal in €/kWp. Beste Grüße, Martin
-
Hi again, could you tell me what version of PV*SOL premium 2018 you are using (R1 to R9)? Also, could you send me the log file (C:\ProgramData\Valentin EnergieSoftware\log\PVSOLpremium.log), via private message? And if you don't mind, some information about the machine you are using would be helpful. Kind regards, Martin
-
Dear RVinea, we are sorry to hear that you keep getting error messages in 3D. Could you give us some details about the steps that lead you to the errors? Thanks and kind regards, Martin
-
Hi everyone, please see our new tracking videos here: Kind regards, Martin
-
Hi everyone, please see our new tracking videos here: Kind regards, Martin
-
see our new tracking videos here:
-
See our new tracking videos here:
-
Hi Maha, our 3D team just finished the tracking videos, and I really like what came out, please have a look. This is 1-axis East-West, with red being the Rotation Axis Incline axis (20°) and blue being the Rotational Angle of Opening. This is plus/minus 50° here, so in PV*SOL you enter 100°. This is 1-axis North-South, with red being the Rotation Axis Incline of the (30°) and blue being the Rotational Angle of Opening. This is plus/minus 60° here, so in PV*SOL you enter 120°. This is 1-axis vertical, with red being the inclination of the modules (40°) and blue being the Azimuth Angle of Opening. This is plus/minus 60° here, so in PV*SOL you enter 120°. And then there is 2-axis tracking, I think this is clear to everybody. There is the inclination of the module (red) and the azimuth angle (blue), which you can limit by the Maximum Inclination and Azimuth Angle of Opening. I hope this clarifies the tracking options a bit further, kind regards, Martin

-
Hallo Christian, mittlerweile lässt sich PV*SOL einfach deregistrieren und dann auf dem neuen Rechner wieder registrieren: Um die Einstellungen auch wieder auf dem neuen Rechner zu haben, empfiehlt es sich, den Ordner C:\Users\USERNAME\Documents\Valentin EnergieSoftware\PVSOL premium 2018 zu sichern und nach der Installation auf dem neuen Rechner über den entsprechenden Ordner rüber zu kopieren. Wenn auch selbst angelegte Datenbank-Einträge übernommen werden sollen, einfach die Datenbank rüberkopieren: C:\ProgramData\Valentin EnergieSoftware\PVdatabase\Version5.0\PVSOL.sdf Beste Grüße, Martin

-
Hallo Kamal, auch bei den DC-gekoppelten Batterie-Speichern wird die Anzahl der Batterie-Systeme (2x) und die Anzahl der Batterien pro System (3x) angezeigt. Bei DC-gekoppelten Systemen ist zu beachten, dass sie immer am ersten Wechselrichter hängen. Bei generator-gekoppelten DC-Speichern am erstern MPP-Tracker des ersten Wechselrichters. Wenn zwei DC-Systeme gewählt werden, sind sie also beide am ersten WR angeschlossen. In Zukunft wird man die Zuordnung auch einstellen können, aber derzeit verhält es sich wie oben beschrieben. Beste Grüße, Martin
-
?
-
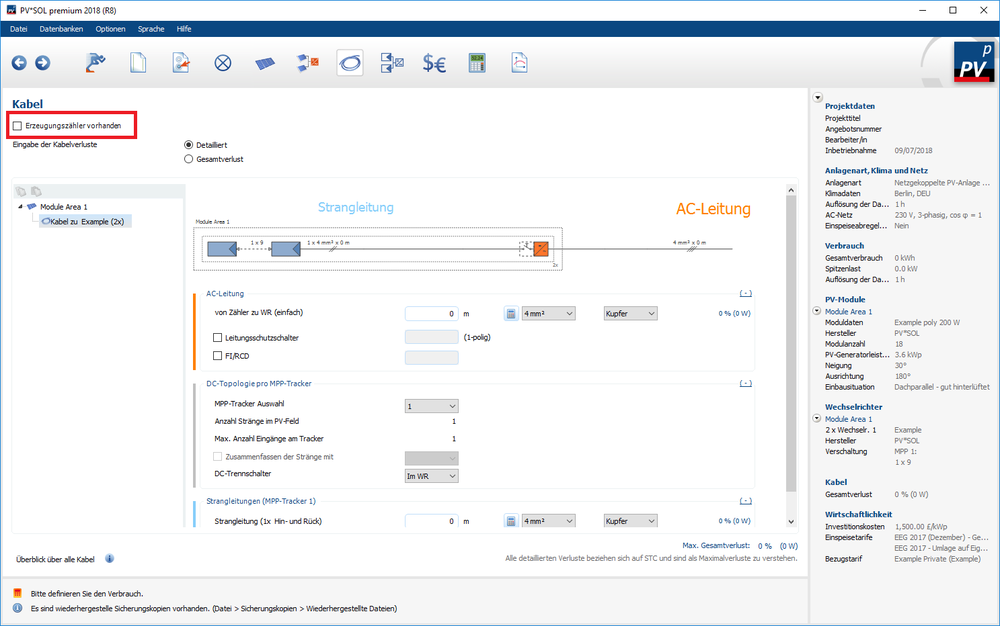
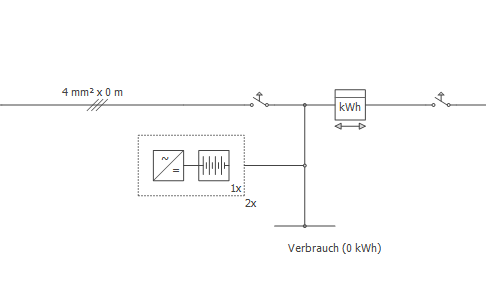
Hallo Kamal, den Erzeugungszähler kann man oben auf der Kabel-Seite an- oder abwählen: Was die Batterie-Systeme angeht: Wenn man zwei Batterie-Systeme auswählt, wird im Plan nur eins gezeichnet (mit der entsprechenden Anzahl Batterien eines Batterie-Systems) und ein "2x" darunter geschrieben: Ich bin mir aber nicht sicher, ob ich den Punkt der Frage richtig verstanden habe.. Beste Grüße, Martin
-
Hi Esteban, I will send you the link per private message. Kind regards, Martin
-
Good to hear that it all works fine for you now. Kind regards, Martin
-
Always want to learn off-grid system, please provide a tutorial
developer_mh replied to ylm973's topic in PV*SOL
Dear ylm973, perhaps you can start with our new help pages where we updated the information on off-grid systems as well: https://help.valentin-software.com/pvsol/2018/calculation/offgrid-systems/ https://help.valentin-software.com/pvsol/2018/pages/battery-inverter-and-battery/ https://help.valentin-software.com/pvsol/2018/pages/backup-generator/ If you have specific questions afterwards, feel free to ask! An off-grid tutorial would be a good idea, sure. We will put it on our list. Kind regards, Martin -
Hi Richie, the best (and fastest) option for you would be to contact Enphase directly and ask them to include their inverters in our database. They should know who to contact and also already have a login for our databse, but in case they don't, they can contact our database team at database@valentin-software.com. Kind regards, Martin
-
Dear Dajana, please contact our sales team at sales@valentin-software.com with your serial and customer number, they will be able to see if there is something wrong. Kind regards, Martin
-
Hi James, we are in the process of finalizing the release, so with testing and approval procedures we aim for beginning of next week. Thank you for your understanding, Martin
-
Hi James, you are absolutely right and we understand your worries completely. Let me try to give some more details on the updates. In R5 we introduced MeteoNorm 7.2 (MN72) which brought new climate data worldwide and changes in the algorithm to create new climate data. For PV*SOL we preprocess a lot of climate data locations that we deliver as a database as part of the software. These pre-processed locations were generated with the new MN72 algorithm, but with the old MN71 database, which we only realized when R6 was already published. So, for R7 we updated the preprocessed locations with the right database (from MN72). The problem now is that we overlooked a switch to choose between two climate data ranges (1981 - 1990 and 1991 - 2010). This will be fixed in R8 which we will release very soon. We feel really sorry for this and apologize for all inconveniences that we caused with this troublesome MeteoNorm update. This is the first climate data update we had for a long time and the first for the current team members, and apparently we did not have an adequate test coverage for this topic. Right now we setup a series of new manual and automatic tests that will cover these issues in the future. Again, we are really sorry for that, and thank you for your feedback. Kind regards, Martin


