


developer_mh
-
Posts
1,860 -
Joined
-
Last visited
-
Days Won
173
Everything posted by developer_mh
-
Hi Khaled, please have a look in this thread, where the calculation of ROA (return on assets) and IRR (internal rate of return) is explained. I think our calculation of the accrued cash flow that is also explained there fits the common understanding of the net present value: If have any further questions, please don't hesitate to ask. Kind regards, Martin
-
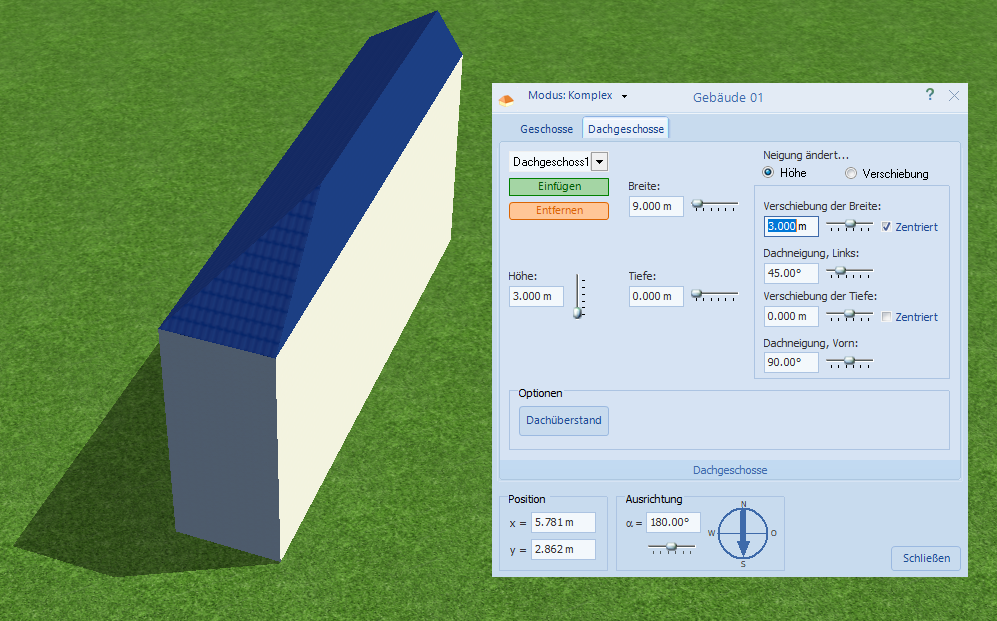
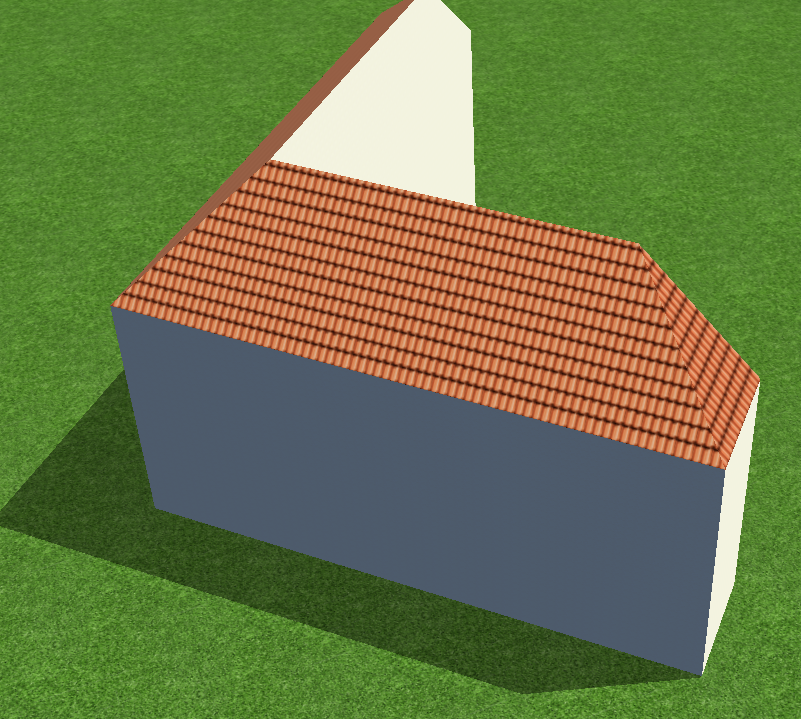
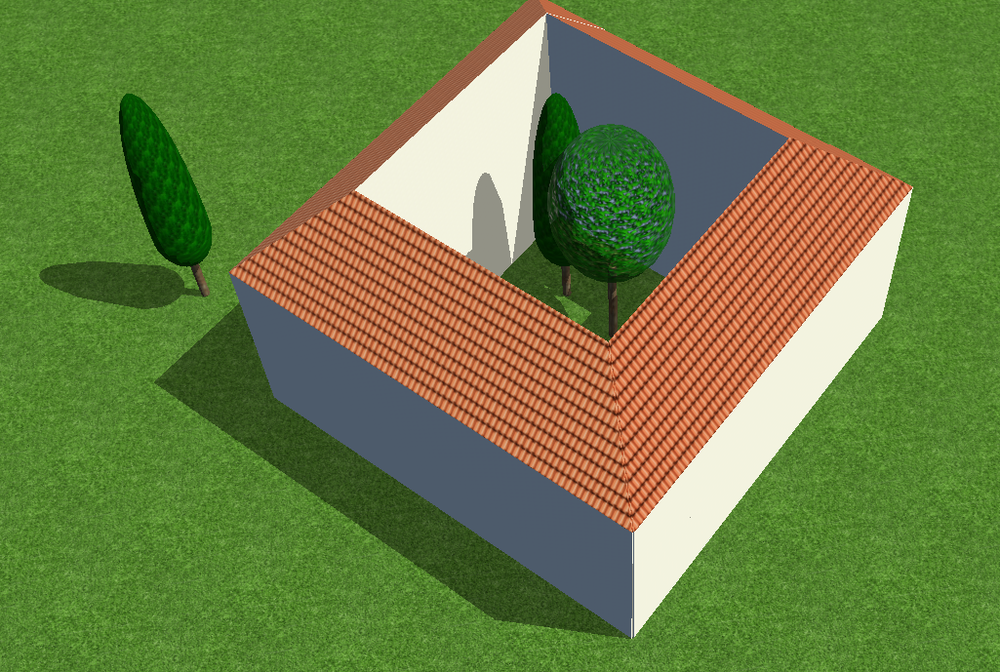
Hallo Alex, eine Idee wäre, das Gebäude aus vier Teil-Gebäuden zusammenzusetzen. Dazu erstellst du zunächst ein Gebäude mit Walmdach und passt die Dach-Parameter so an, dass eine Seite des Daches vertikal wird: Dann kannst du diesen Seitenflügel duplizieren, die Kollisionen deaktivieren und dann um 90° gedreht in einander schieben: das wiederholst du für jeden Seitenflügel, schiebst die Ecken genau aufeinander (genauer als ich in diesem Bild) und bekommst dann dein Haus mit Innenhof (sogar bepflanzbar ) Die andere Option wäre, das Haus in Sketchup oä zu bauen und dann in PV*SOL zu importieren. Hoffe, das hilft erstmal weiter, beste Grüße, Martin
-
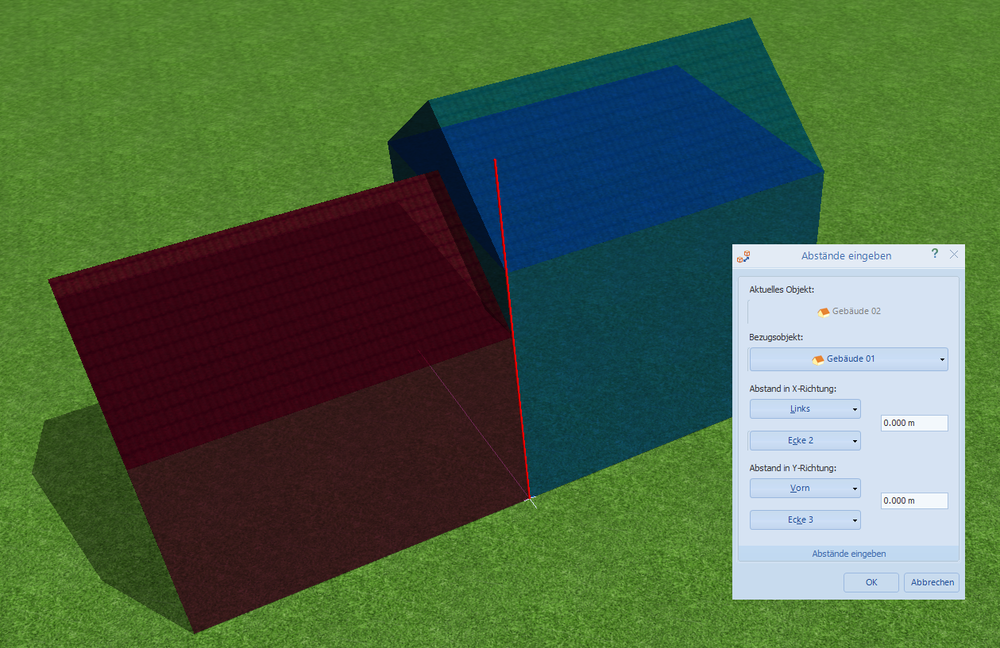
Hallo Alex, für die genaue Positionierung der Gebäude gibt es die Funktion "Abstände eingeben", erreichbar per Rechtsklick auf einem Gebäude. Dort lassen sich die Bezugsgebäude und -kanten wählen und dann die Abstände zueinander eingeben. Wenn man die Abstände auf 0 m setzt, liegen die Gebäude plan aneinander: Ich hoffe, das hilft! Beste Grüße, Martin
-

Open csv file with shading factors in PvSol 2017?
developer_mh replied to eayalach's topic in PV*SOL
Hi Esteban, happy new year! You don't need to import the shading factors. We calculate the overall diffuse shading factor for each module and the direct shading factors for each module and each simulation time step, so this will be a lot more precise than the averaged values from Skelion. We also detect where exactly the shading occurs on module level, so we can precisely calculate the electrical shading, diode and mismatch losses, also depending on the electrical layout of the PV array and the modules themselves (horizontal or vertical strings). Thanks to our detailed shading analysis you can also investigate the different shadig behaviour of crystalline silicon or thin film modules. You can export your Sketchup model, without the PV modules perhaps) as *.dae and import it in PV*SOL premium (2018 R1 or newer). Then, in PV*SOL, place your modules where you placed them in Sketchup and connect them to an inverter. Then you can simulate them, and also have a look at the current-voltage characteristics afterwards to see how the shading affects the energy output of your modules. Hope that helps, kind regards, Martin -
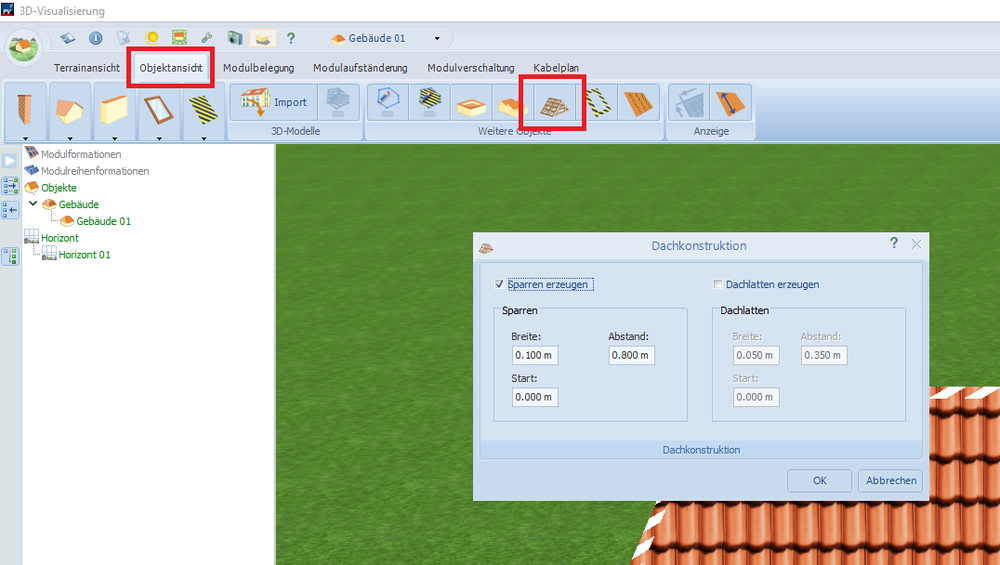
Hallo Wolf, viele Grüße zurück in die Schweiz und ein frohes neues Jahr! Die Dachsparren lassen sich definieren, indem man das Gebäude (in der Terrainansicht) aktiviert und dann oben in der Buttonleiste auf "Dackonstruktion anlegen" klickt (das Dachstuhl-Symbol). Viel Erfolg weiterhin, Martin
-
Hi Kamal, sorry for the late answer. In the screenshot manager in 3D you can right click on any screenshot you have taken and select it as the new overview image of your 3D design. Hope that helps, kind regards and have a merry holiday time, Martin
-
Hi again, yes, you would have to find out the specific co2 emission for Sweden, as up-to-date as possible. Perhaps the Swedish energy ministry publishes such data? On Wikipedia I found that in 2013 the electricity consumption was 133.2 TWh, while the CO2 emissions were 37.5 Mt. This would equal to 282 g/kWh, but perhaps you'll find more recent information. Here's the Wikipedia page: https://en.wikipedia.org/wiki/Energy_in_Sweden Kind regards, Martin
-
Hi Daniel, this value refers to the current energy mix in the country where you design your PV system. In Germany, for example, we have an energy mix that produced ~ 530 g CO2 per kWh in 2016. This value is used to calculate the CO2 emissions that were avoided thanks to your PV system. Kind regards, Martin
-
Hi Diogo, the Fluiteknik modules were most probably also user-created modules, since we don't have them in our database. So we think that the import of your user-created modules from the old version of the database into the new one did not work, which is why you don't see them now. But they are still there in the old version of the database. To find out what could be the problem, we'd like to ask you if you could send the old version of your database to us. It is called PVSOL.sdf and you can find it under: C:\ProgramData\Valentin EnergieSoftware\PVdatabase\Version4.0 It is important that you take the one from the folder Version4.0, not Version5.0. I'll send you the mail adresses where you can send the database to by private message. Thanks a lot, kind regards, Martin
-
Here is our new tutorial on how to connect multiple module areas on one MPP tracker (polystring) and how to use power optimizers in the new PV*SOL premium 2018. Also refer to this thread: We hope it helps! Kind regards, Martin
-
Hallo, mittlerweile haben wir PV*SOL premium 2018 veröffentlicht, in der es nun möglich ist, auch eigene Komponenten für die Offgrid-Planung anzulegen https://www.valentin-software.com/aktuelles/produktneuheiten/neu-pvsol-premium-2018-import-von-3d-modellen Viel Spaß damit und beste Grüße, Martin
-
Hallo nochmal, die Bugs mit der Parabolantenne sind in der neuen Version behoben (PV*SOL premium 2018). Beste Grüße, Martin
-
Hallo, mittlerweile haben wir PV*SOL premium 2018 veröffentlicht, in der es nun möglich ist, die Anzahl Batteriesysteme und Elektro-Fahrzeuge einzugeben. https://www.valentin-software.com/aktuelles/produktneuheiten/neu-pvsol-premium-2018-import-von-3d-modellen Viel Spaß damit und beste Grüße, Martin
-
Hallo, mittlerweile haben wir PV*SOL premium 2018 veröffentlicht, in der wir die Verschaltung von Power-Optimizern (Leistungsoptimierern) vollständig überarbeitet haben. Es können sowohl interne Power-Optimizer wie Maxim als auch externe wie SolarEdge und Tigo genutzt werden. https://www.valentin-software.com/aktuelles/produktneuheiten/neu-pvsol-premium-2018-import-von-3d-modellen Viel Spaß damit und beste Grüße, Martin
-
Hallo nochmal, nur fürs Protokoll: Die Simulation von PV-Systemen, Batterie-Speichern (DC oder AC-gekoppelt) und Elektro-Fahrzeugen ist in PV*SOL seit Version 2017 Release 6 möglich. Beste Grüße, Martin
-
Hallo, mittlerweile haben wir PV*SOL premium 2018 veröffentlicht, in der wir die Verschaltung von Power-Optimizern (Leistungsoptimierern) vollständig überarbeitet haben. Es können sowohl interne Power-Optimizer wie Maxim als auch externe wie SolarEdge und Tigo genutzt werden. https://www.valentin-software.com/aktuelles/produktneuheiten/neu-pvsol-premium-2018-import-von-3d-modellen Viel Spaß damit und beste Grüße, Martin
-
Hallo, mittlerweile haben wir PV*SOL premium 2018 veröffentlicht, in der wir die Verschaltung von Power-Optimizern (Leistungsoptimierern) vollständig überarbeitet haben. Es können sowohl interne Power-Optimizer wie Maxim als auch externe wie SolarEdge und Tigo genutzt werden. https://www.valentin-software.com/aktuelles/produktneuheiten/neu-pvsol-premium-2018-import-von-3d-modellen Außerdem können alle Arten von Polystring-Konfigurationen verschaltet werden: Unterschiedliche Modulflächen an einen MPP Tracker verschiedene Modultypen in einen String Parallelschaltung von Strings mit unterschiedlicher Modulanzahl usw usf Viel Spaß damit und beste Grüße, Martin
-
Hallo, in der neuen Version PV*SOL premium 2018 ist es möglich, eine ganze Reihe von 3D Modellen direkt zu importieren: https://www.valentin-software.com/aktuelles/produktneuheiten/neu-pvsol-premium-2018-import-von-3d-modellen Viel Spaß damit! Martin
-
Hallo! In der neuen Version von PV*SOL premium 2018 können alle Strom-Spannungs (I-V) und Leistung-Spannungs (P-V) Kennlinien angezeigt werden: Beste Grüße, Martin

-
Solaredge-Optimierer fehlen in Wechselrichter-DB
developer_mh replied to TechEditor's topic in PV*SOL
Hallo, mittlerweile haben wir PV*SOL premium 2018 veröffentlicht, in der wir die Verschaltung von Power-Optimizern (Leistungsoptimierern) vollständig überarbeitet haben. Es können sowohl interne Power-Optimizer wie Maxim als auch externe wie SolarEdge und Tigo genutzt werden. https://www.valentin-software.com/aktuelles/produktneuheiten/neu-pvsol-premium-2018-import-von-3d-modellen Viel Spaß damit und beste Grüße, Martin -
Hi, just a short update: In the meanwhile we fully overhauled the design and simulation of PV plants with power optimizers, both module integrated (like Maxim) and external (like SolarEdge or Tigo). It is available in PV*SOL premium 2018. https://www.valentin-software.com/en/news/product-news/new-pvsol-premium-2018-import-3d-models Martin
-
Hi, just a short update: In the meanwhile it is possible to import a number of 3D model formats directly in PV*SOL premium (from version 2018 on): https://www.valentin-software.com/en/news/product-news/new-pvsol-premium-2018-import-3d-models Martin
-
Hi, just a short update: In the meanwhile we fully overhauled the design and simulation of PV plants with power optimizers, both module integrated (like Maxim) and external (like SolarEdge or Tigo). It is available in PV*SOL premium 2018. https://www.valentin-software.com/en/news/product-news/new-pvsol-premium-2018-import-3d-models Martin
-
Hi, just a short update: In the meanwhile we fully overhauled the design and simulation of PV plants with varying module areas. You can now build any configuration you want with the new 'Polystring feature'. For example: Two module areas on one MPP tracker Different module types in one string Parallel connection of strings with different number of modules etc etc It is available in PV*SOL premium 2018. https://www.valentin-software.com/en/news/product-news/new-pvsol-premium-2018-import-3d-models Martin


