


developer_mh
-
Posts
1,855 -
Joined
-
Last visited
-
Days Won
173
Everything posted by developer_mh
-
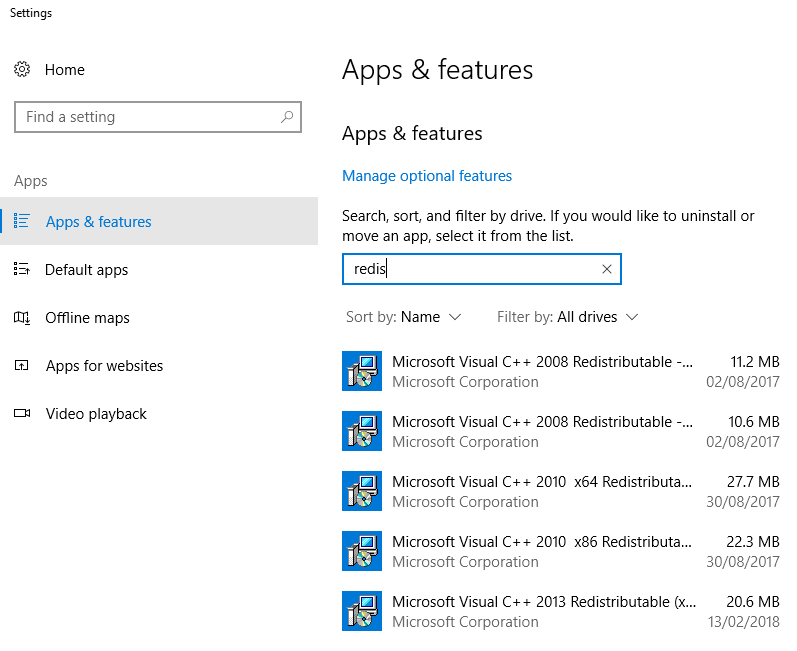
Seems like you are missing libraries from the Microsoft C++ Redistributables. Could you check which versions you have installed on your computer? Go to settings, Apps and features and search for "redistributable", you should see a list of packages there: I guess that you are missing some files from this package: http://download.microsoft.com/download/1/1/1/1116b75a-9ec3-481a-a3c8-1777b5381140/vcredist_x86.exe Try to install it and check again. If this does not work, I would really recommend to re-install PV*SOL to get all the files you need. Kind regards, Martin
-
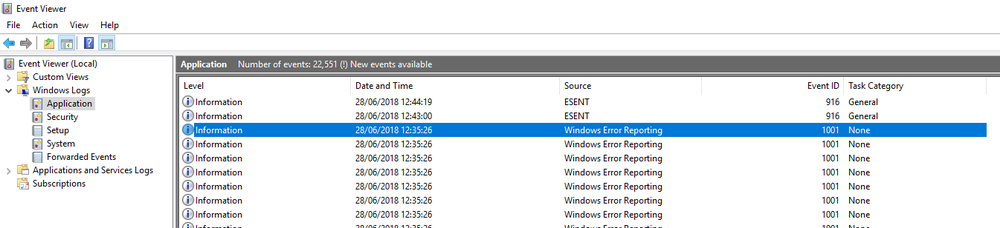
Do you see anything in the Windows Event Viewer? Any errors concerning Photoplan? If not, I would try to uninstall PV*SOL, make sure that Photoplan is uninstalled as well, and then install a fresh version of PV*SOL. Kind regards, Martin
-
Hi Stuart, could you check if you have PhotoPlan installed? There must be these files in C:\Program Files (x86)\PhotoPlan Thanks, and kind regards, Martin

-
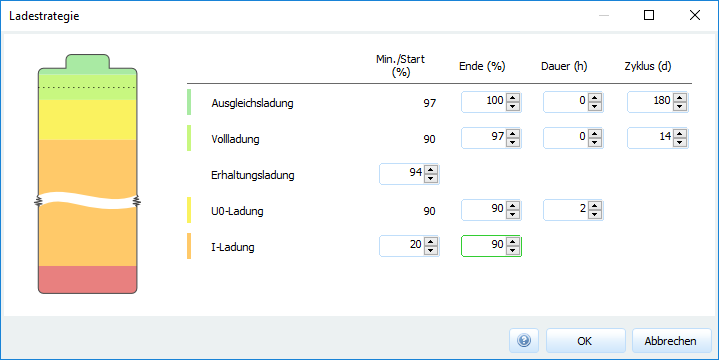
Hi Arne, wenn die Batterie bei über 80% steht und der Generator dazukommt, wird es sich um Boost- oder Pflege-Ladungen handeln, bei denen die PV nicht ausreichend Leistungen liefern kann. Am 19.08. um 11 Uhr ist das genau so ein Fall. Die PV scheint zwar genug Leistung zu bringen, allerdings muss sie erstmal die Last decken (5.65 kW) und kan nur mit dem Rest die Batterien laden. In der hier dargestellten Stunden-Auflösung der Ergebnisse sieht es so aus, als sollte das rechnerisch zwar trotzdem reichen, aber die Simulation wird ja in Zeiten starker Batterie-Beanspruchung mit kleineren Zeitschritten durchgeführt. In diesen zwei Stunden scheint es also Minuten gegeben zu haben, in denen dann doch nicht ausreichend PV-Leistung vorhanden war, weswegen dann der Generator einspringen muss. Die Einstellungen zur Pflegeladung kann man leider derzeit noch nicht um zeitliche Angaben erweitern. Wenn der Generator nicht zur Pflegeladung der Batterien eingesetzt werden soll, würde ich vielleicht die Pflegeladungen ausschalten und dafür die obere Grenze der I-Ladung (Bulk-Ladung) hochsetzen. Beste Grüße, Martin
-
Hello Maha Dardir, yes, you are right, if you choose a single axis tracker with north-south axis, then the module rotates from east to west. The axis is parallel to the land (horizontal) if you set the rotation axis incline to 0°. However, depending on where you are on our planet, you can yield more energy, if you incline the rotation axis towards the equator. I also asked our 3D team to come up with some short videos to demonstrate the different tracking options. In the meanwhile I found this image here: from http://www.wulfdach.de/photovoltaik/nachfuhrsysteme/ The rotation axis (black rod) is inclined here by lets say 25 to 30°. To lower point (where it is mounted, in the lower right corner of the picture) is facing south, and the upper point (not visible in this picture) is facing north. So the axis is still in the North-South plane, but the rotation axis is inclined. Kind regards, Martin

-
Hi Maha Dardir, the rotational axis incline is measured from the hoizontal, so 0° means horizontal and 90° means vertical. The Rotational angle of opening can be interpreted as follows: If entered 160°, the module can rotate by 80° to each side around the rotation axis. Perhaps the following comparison makes it clearer. Take a PV plant without tracking, set it inclination 30° and orientation 180° (in Berlin) and simulate and remember the energy yield. Now choose Single Axis Tracking with North-South axis, set the inclincation of the rotation axis to 30° and limit the rotational angle to 0° (which means that the modules can't rotate). The energy yield will be very nearly the same. A video would surely be a good thing, I will ask our designer and our 3D team if they can do something like that. Hope that helps. kind regards, Martin
-
Dear Emad Elkhwaga, please have a look at our help pages where we try to explain all the tracking options and parameters: https://help.valentin-software.com/pvsol/2018/pages/pv-modules/#tracking Also, please refer to this forum thread: And finally this one here: Hope that helps, kind regards, Martin
-
Dear Maha Dardir, please have a look at our help pages where we try to explain all the tracking options and parameters: https://help.valentin-software.com/pvsol/2018/pages/pv-modules/#tracking Also, please refer to this forum thread: And finally this one here: Hope that helps, kind regards, Martin
-
Dear PV*SOL users, we are proud to announce that we have published our new help pages now. You can find them here: https://help.valentin-software.com/pvsol/en/ We hope that you'll find them useful in the future, and we'd be glad to hear what you think of them. Thanks and kind regards, Your PV*SOL team
- 1 reply
-
- 1
-

-
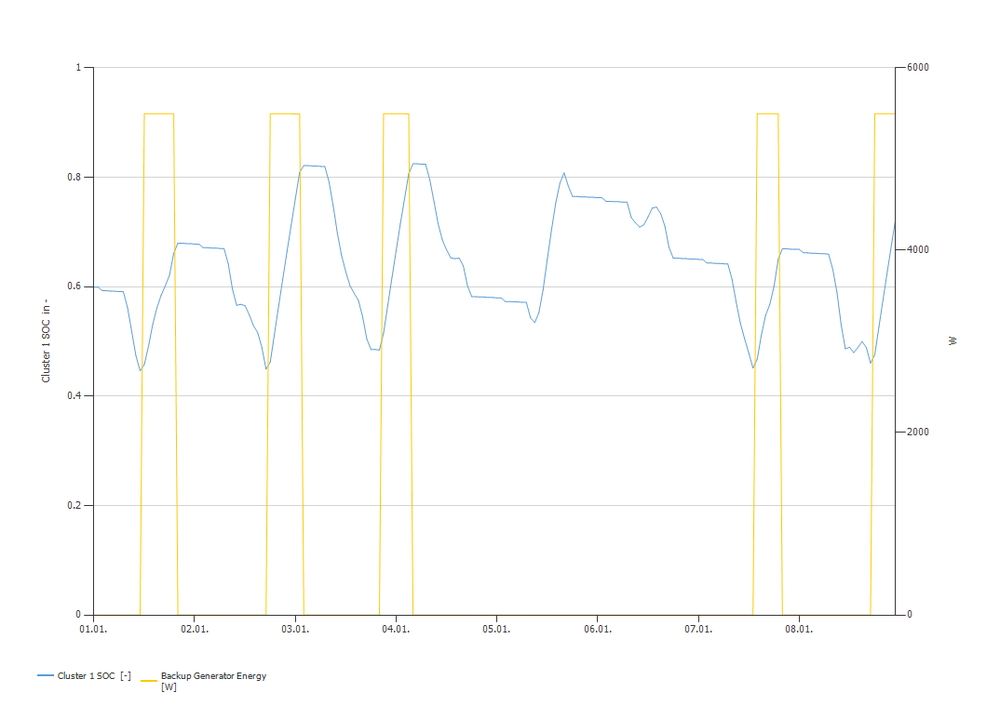
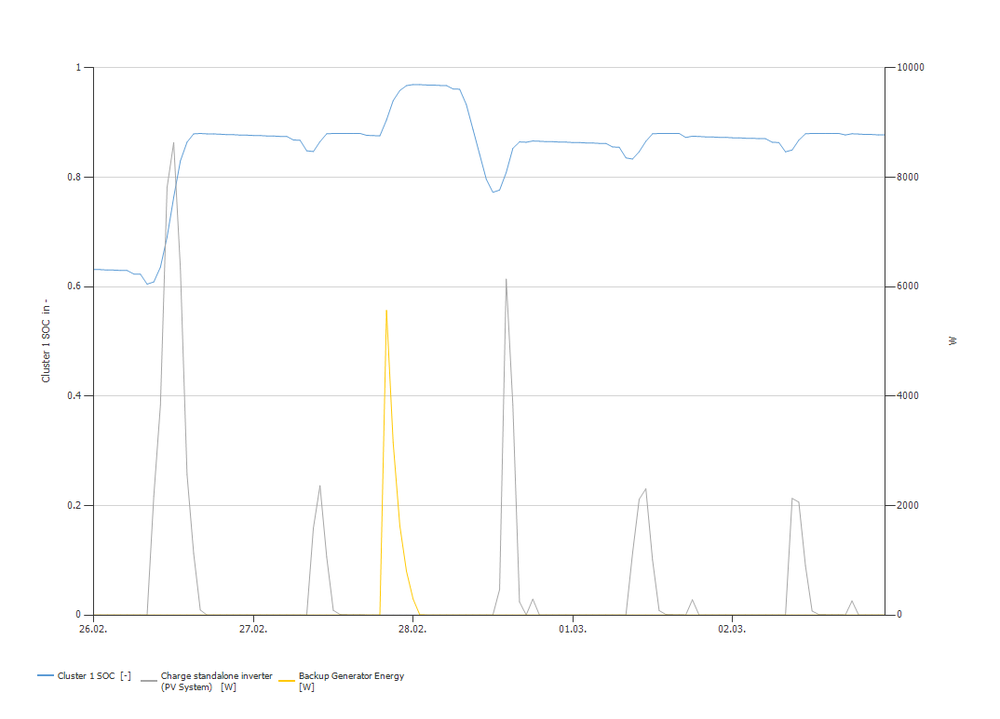
Hallo Arne, also, ich finde, das sieht eigentlich ganz gut aus.. Der Generator springt an bei Unterschreitung der Startschwelle (45%) und hört auf bei Überschreitung der Stoppschwelle (65%): Darüber hinaus wird der Generator auch bei den Pflegeladungen bei Bedarf gestartet, zum Beispiel hier bei der Voll-Ladung von 88% auf 97% (da hier nicht ausreichend PV-Leistung vorhanden ist): Wenn Sie dazu noch weitere Fragen haben, bitte immer gerne. Ansonsten haben wir ja neulich auch unsere Hilfe-Seiten überarbeitet, vielleicht finden Sie da noch was Interessantes: https://help.valentin-software.com/pvsol/2018/berechnungsgrundlagen/netzautarke-systeme/ Viele Grüße, Martin
-
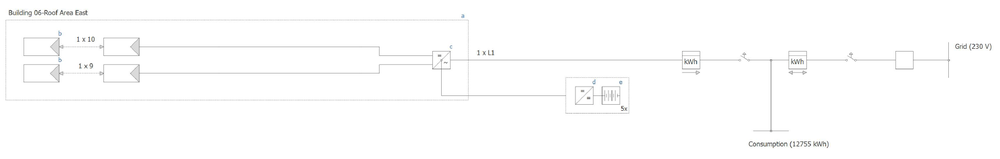
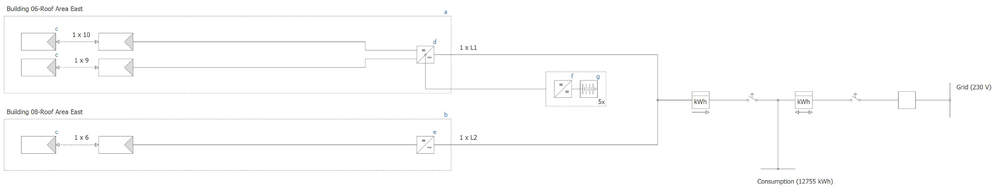
Hi Michael, thanks a lot for the project files. In this case you use a DC coupled battery system. DC coupled systems are connected to the first PV inverter only, so adding or removing PV arrays doesn't change the energy that flows in or out of the batteries. In the circuit diagram you see that for the battery, there is no difference between your two system designs: I hope this helps, kind regards, Martin
-
Hello Michael, thanks a lot for your question. I am sure we will find the solution there. Is there any chance that you can provide the project files for the two cases? Otherwise it will be hard for us to understand what is going on in the system. You can send the project file as private message. Thanks and kind regards, Martin
-
Hallo palomita, Vielen Dank für die Nachfrage. Zum Nachvollziehen der Simulationsergebnisse wäre die Projekt-Datei sehr hilfreich. Was die Ladestrategien angeht, haben wir da tatsächlich vergessen, bei der letzten Erweiterung die Bezeichnungen anzupassen. Momentan wäre Folgendes richtig: Ladestrategie -1: Entladen 2: I-Ladung (maximaler Strom) 3: I-Ladung (normal) 4: Boost 5: Full 6: Equalizing 7: Float 8: Netzladung (nur für E-Autos in Ongrid-Systemen) 9: Entladung nicht aktiviert (nur für E-Autos in Ongrid-Systemen) Zu beachten ist dabei, dass hier die Stundenwerte ausgegeben werden. Die Simulation erfolgt aber in der Regel in Zeitschritten von einigen Minuten, weswegen dann während einer Stunde auch unterschiedliche Ladestrategien gefahren werden können. Diese werden dann durch das |-Zeichen getrennt dargestellt. Während der Float-Ladung wird den Batterien nur minimal Energie zugeführt, in Ihrem Beispiel liefert die PV dafür genug. In Full-Ladungs-Phasen wird der Generator in jedem Fall gestartet, falls die PV nicht genug Energie liefern kann. Das Erreichen der Start/Stop-Schwelle geht leider aus den von Ihnen angehängten Ergebnissen nicht hervor, weswegen da wie gesagt die Projekt-Datei sehr hilfreich wäre. Vielen Dank und beste Grüße, Martin
-
Hello Jan Sorensen, you can find more information on the cycle load of batteries here in our new help: http://help.valentin-software.com/pvsol/2018/calculation/battery-systems/lead-acid-batteries/ This is written for lead acid batteries but the section about life cycles (starts between Fig 2 and 3) applies equally for lithium based batteries. Hope this helps, kind regards, Martin
-
Hi Bernd, when you are in MeteoSyn, follow these steps: go to the list view of your locations, select the location you want to remove, right click, go to containing folder, delete the corresponding *.wbv file there go back to the MeteoSyn GUI, to the 'Options' tab click 'Update database' Hope that helps, kind regards, Martin
-
Hi Maha, you can easily add your own PV modules (or any other type of product) to the databases by opening the database dialog (Menu 'Databases' then 'PV Modules'). Then select the manufacturer, in your case 'Jinko Solar'. Then you can either select a module, right click on it, and click 'copy'. Or you can add a new one by clicking 'new'. In both cases you can enter the datasheet information and save the new module by clicking 'ok'. Here you'll find some more infomation: https://help.valentin-software.com/pvsol/2018/databases/components/pv-modules/ Hope that helps, kind regards, Martin
-
Hallo DucDiesel, das klingt stark nach einem korrupten Projekt. Damit sollte man sich in jedem Fall an die Hotline wenden, da die ein paar Tricks und Kniffe kennen, wie man solche Projekte wieder ans Laufen bekommt. Am besten per Mail mit Kundennummer und angehängtem Projekt (vorher private Daten entfernen!) an hotline@valentin-software.com. Keine Garantie, dass man noch was machen kann, aber in vielen Fällen geht noch was. Wir arbeiten auch intensiv daran, dieses Problem in den Griff zu kriegen. Scheinbar unterbinden manche Virenscanner in Einzelfällen das Speichern der 3D-Projektdaten in die Projektdatei. Alles Gute und beste Grüße, Martin
-
Hi Patrik, that is a nice idea. Actually we thought that building companies would model the building that can then be imported in PV*SOL and not the other way round ? But it is nice to hear that people are considering to use PV*SOL as a building modelling tool. I will forward this idea to my colleagues of the 3D team. Kind regards, Martin
-
Hey Patrik, in this case you would have to extrude one half of the building first, edit the inclination of the roof and then extrude the other half of the roof. Hope that helps, kind regards, Martin
-
Hi PS Renewables, right now it is not possible to enter more than 1000 V for the AC mains. But it is a good point, we should raise the maximum value for HV systems to more than 1000V. It will be available in the next release (PV*SOL premium 2018 R7). Kind regards, Martin
-
Hi Diego, please contact our hotline at hotline@valentin-software.com, they also have access to the licence management. Kind regards, Martin
-
Hi Stuart, could you try to load the example project 'Photo plan' and check if Photo Plan works there? Kind regards, Martin
-
Hi all, if you want to use Excel to convert the decimal coordinates e.g. from Google Maps into the pseudo degree.minute representation that is necessary for the dat file format, you can use this formula: =(A1-FLOOR.MATH(A1))*60/100+FLOOR.MATH(A1) Hope this helps, kind regards, Martin
-
 Hello Maha, to achieve this, you can use the 'Configure Module Areas together' feature. See this post here on a similar question: When you search the forum, you will find some more information on that. Hope this helps! Kind regards, Martin
 -
How to construct a round roof within the software (Base profile)
developer_mh replied to Tim's topic in PV*SOL
Hi Tim, if you refer to .dwfx and .dwf file format from Autodesk, I am almost sure that you can export your models into .obj or similar in their programs. I don't have AutoCAD here, so I can't test it, but it should work. Kind regards, Martin


