


developer_mh
-
Posts
1,855 -
Joined
-
Last visited
-
Days Won
173
Everything posted by developer_mh
-
Hi Tim, we are in the progress to clarify some technical details in order to include ESS Home 8 and 10 into our database. It will be available soon. Thank you for your patience, kind regards, Martin
-
Hi Anders, there you touched the limitations of the offgrid components by SMA, that is correct. The MultiCluster Box is only suitable for PV systems of up to 360 kW. The requirement that the PV power must not be higher than twice the battery inverter power also comes from the SMA design rules. If you want to design such a big system, I would recommend to plan it in smaller parts: You have a PV power of 1714 kWp and a load of 1.62 MWh, that is set I guess. I would suggest to divide your plant in 5 sub-plants, with 342.8 kWp each, and enter a 5th of the consumption, i.e. 324 120 kWh. With these dimensions you won't run into limitations. Regarding the redox flow and saltwater batteries: Yes, we have it on our list, but we have not decided about the prioritization yet. Hope that helps, kind regards, Martin
-
Hi Jon, thank you for your input. Yes, we are aware of the fact that our list of offgrid battery inverters is limited to SMA products at the moment. And we definitely want to change that. I can't tell you a schedule yet but we are working on the extension of our databases, and the offgrid systems will be one aspect that we want to ameliorare. For the moment you could copy a SMA component and change the company, name and eletrical properties to your likings. Kind regards, Martin
-
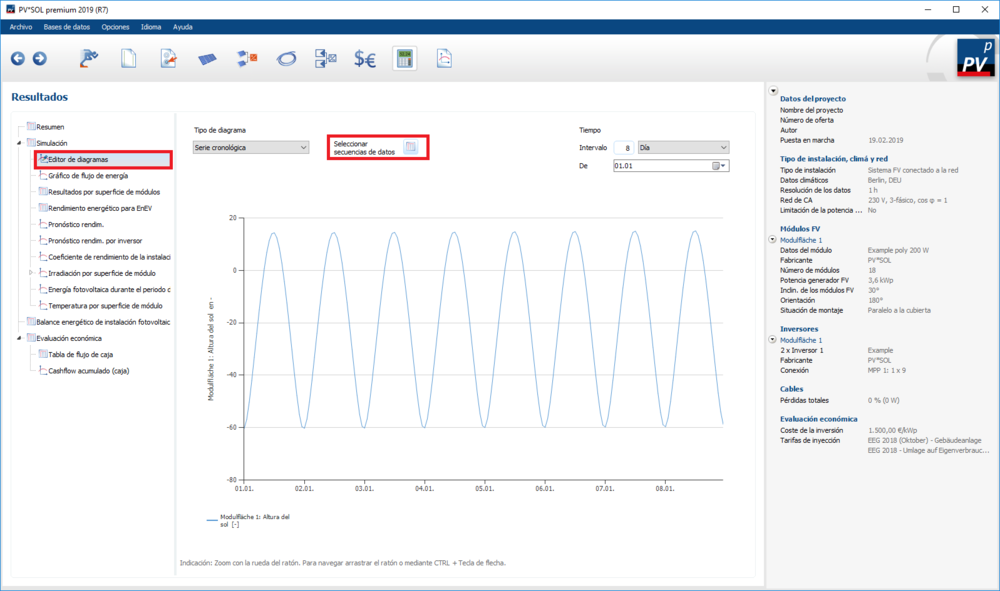
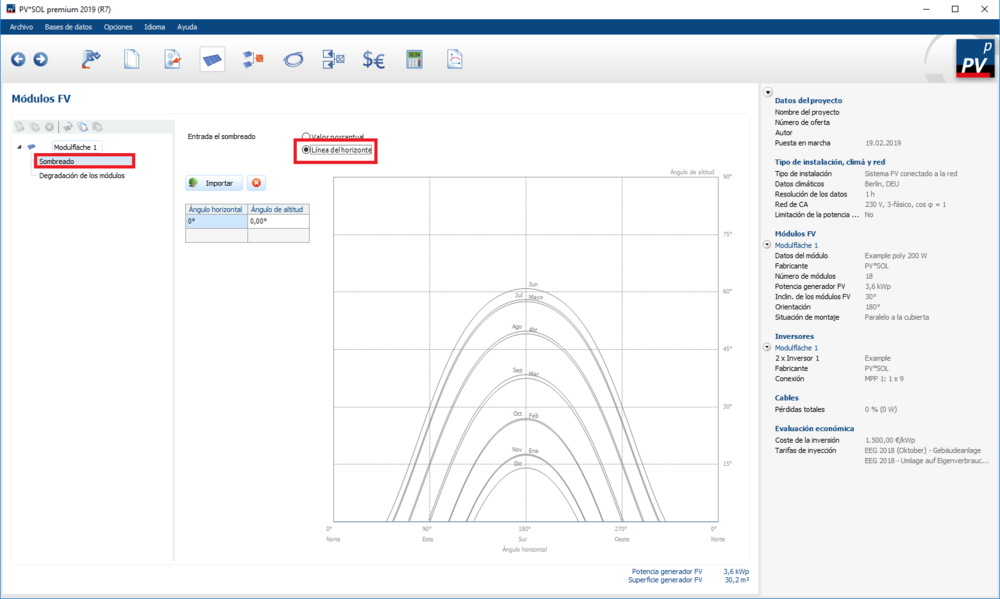
Hi JDrojas, let me add to the comments of my colleague, that if you need the sun path at the location in question, you can see it in the results. Go to the page "Results" (Resultados) and then Diagram Editor (Editor de diagramas) and select sun height (altura del sol): Another possibility is to go to the PV module page (módulos FV), then to the shading (sombreado) and then select horizon shading (línea del horizonte). There you get the solar path diagram: Hope that helps, Martin
-
Hi Mohamed, at the moment we don't offer a certification service related to PV*SOL. Our sales partner in the Netherlands offer a course "Solar Specialist" with a certification included. That comprises PV system design, usage of PV*SOL and all the important things you need to know when planning PV systems professionally. But I think this will be in Dutch language. http://www.switch2solar.nl/opleidingen/solar-specialist/ What we do have are seminars and webinars. Seminars are organized either by us or by our sales partners. You can find a list of future events here: https://www.valentin-software.com/en/sales-service/product-training/seminars And then there are (free of charge) webinars that you can attend over the internet: https://www.valentin-software.com/en/sales-service/product-training/webinars Also keep an eye on the trainings of our UK partner Solar Design Company: https://www.solardesign.co.uk/pvsol_training.php Hope that helps, kind regards, Martin
-
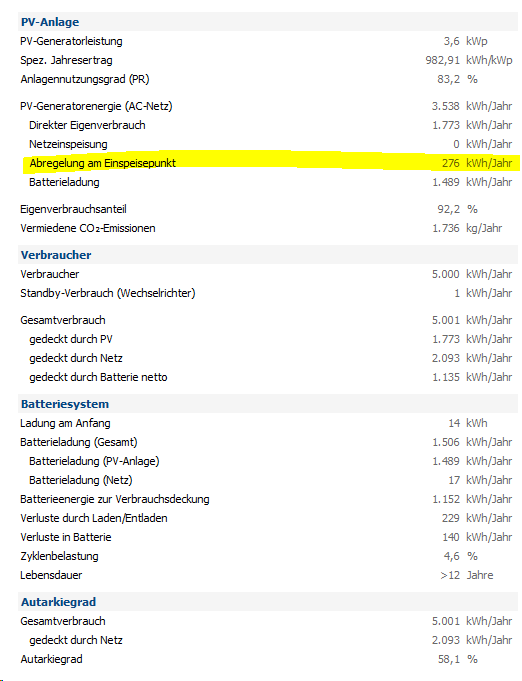
Hallo Lenlo, ja, das geht. Entweder als "echte" netzautarke (offgrid) Variante oder indem du die Einspeiseabregelung bei netzgekoppelten (ongrid) Anlagen auf 0% stellst. Im letzteren Fall wäre dann das Ergebnis "Abregelung am Einspeisepunkt" die Energie, die in den Elektrolyseur gesteckt werden könnte. Unter der Voraussetzung, dass die Anschlussleistung stimmt, also der Elektrolyseur alles Überschüssige aufnehmen kann. Die Einspeiseabregelung wird vorne auf der Seite "Anlagenart, Klima und Netz" unter AC-Netz eingestellt. Es muss natürlich der Einspeisepunkt, nicht der Wechselrichter als Abregelungspunkt gewählt werden. Viele Grüße, Martin
-
Hi Vishal, could you elaborate on what you want to protect against over voltages? Also, how does your online course refer to T*SOL? Thanks, Martin
-
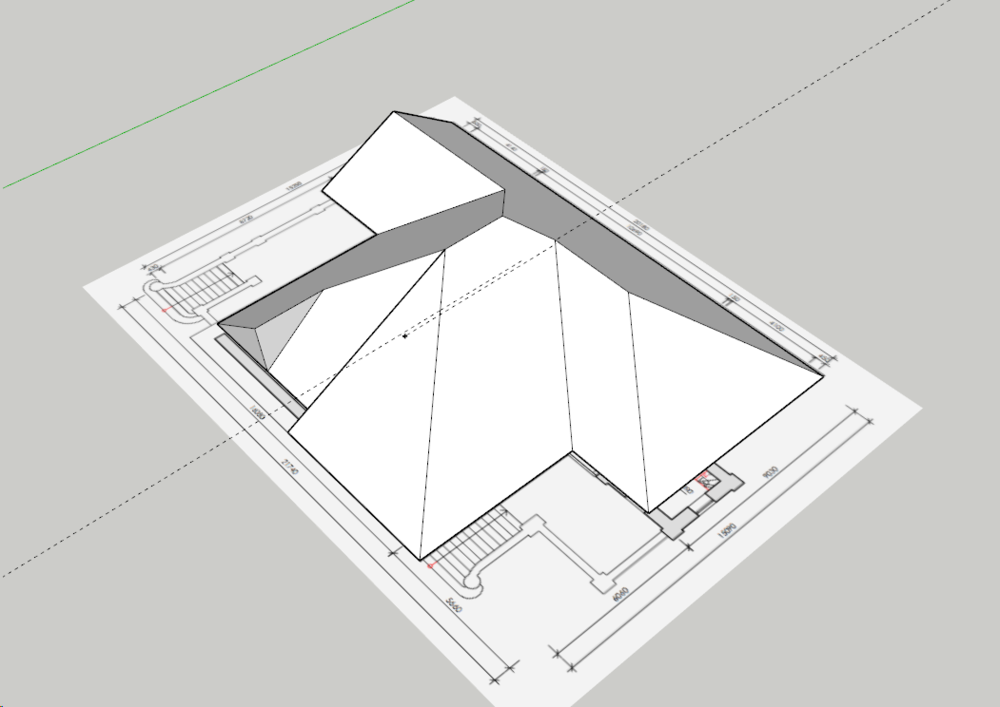
Hi Tim, here is a quick screenshot he sent me before leaving for the weekend And yes, after modelling in Sketchup, you import it into PV*SOL with the model import function, that is right. Kind regards, Martin
-
Hi Ragy, I guess that if module manufacturers know the tc of Vmpp and publish it, you are safe to use it for calculation. Kind regards, Martin
-
Hi Tim, we just discussed it here. We think you should go and try modelling the house in sketchup and then import it in PV*SOL. Even if you have to learn to use sketchup first, you will be faster in the long run. Modelling these types of buildings in PV*SOL with polygons will be very tricky. One of our 3D team members modelled this house in 20min. He used sketchup a lot, so perhaps you will need more time for your first models, but in the end you can really save a lot of time when you have a lot of those complex buildings. Kind regards, Martin
-
Hello Ragy, I would recommend to use the software (e.g. PV*SOL) to simulate the MPP voltage for a given temperature. In my opinion it is not possible to calculate it with easy formulas. If only the temperature coefficient (tc) of Voc and Pmpp are given on the data sheet, there is no way (known to me) to derive from those numbers the tc of Vmpp, except by simulating. As to your options/questions: I'd guess that the tc of Pmpp (Pmax) (in %) is always closer to the tc of Vmpp than to the tc of Voc. So, if you can't simulate, choose the tc of Pmpp. But really, in the end it is those questions why we need simulation tools in order to plan our PV systems correctly. If you want to calculate in your head, then this is ok, but be aware that the results will not be reliable. We do not recommend any other method to determine the voltage ranges of PV systems other than simulating. Kind regards, Martin
-

Differences in results in almost identical simulations
developer_mh replied to Ricardo's topic in PV*SOL
Hi Ricardo, thank you for the project files. The differences are induced by an update of the PV module data by Longi. The newer module data are taken for simulation once you enter the 3D environment. The reflection behaviour of the modules is now different which is why the simulation results are deviating slightly. That is, when I do the following, I get identical results for the inverter groups: Load the project where the whole plant with all inverters is defined Go into 3D environment, return and adopt the data Simulate Save results, e.g. for Inverter 1 Then re-enter 3D environment Delete all configurations except configuration 1 Return to main program and adopt the data Simulate See the results for Inverter 1 are the same as from step 4 Hope that helps, kind regards, Martin -
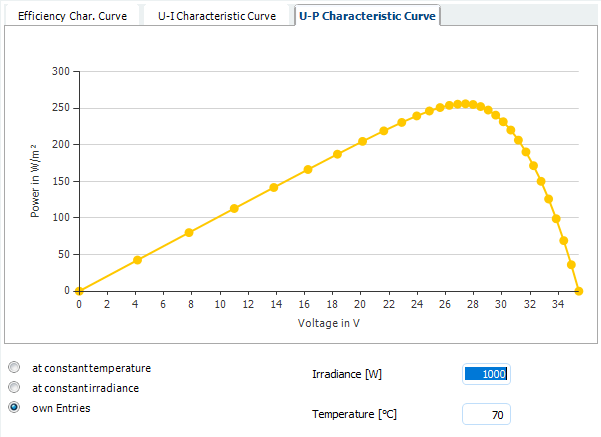
Hello Infinitech, very good question, and an important one! It is unfortunately a common mistake, even among experts in the community, to mix up the temperature coefficients of the open circuit and MPP voltage. These are not the same! The LR6-60 HPH 320M module in our database has a temperature coefficient for the open circuit voltage of -116.97 mV/K, or 0.286 %/K. So the Voc at 70°C will be Voc(70°C) = Voc(25°C) + 45 K * (-0.117 V/K) = 40,9 V - 5.265 V = 35.64 V The temperature coefficient of the MPP voltage will be different, however, usually higher than for Voc. You can easily see that the temperature coefficient of the MPP voltage must be higher than the one of Voc by looking at the temperature coefficient of the power, which is -0.37 %/K. So there must be additional, temperature related losses to close the gap between -0.37 % and -0.286 %. This is why we have to simulate the module at the given temperatures we want to analyse. We take the three temperature coefficients of Voc, Isc and Pmpp and simulate the module characteristics at a given temperature, e.g. 70°C. From these curves we can detect MPP voltage and current. See here the diagram of the power over voltage for different temperatures for the LR6-60 HPH 320M module. Voc(70°C) is around 35V, as expected. The MPP voltage seems to be at 27.5 V, which relates to a relative loss of -0.425 %/K. This is where the 551 V come from, 20 * 27.5 V ≈ 551 V. The other way 'round, you can easily check that an Vmpp of 590.74 V (as stated by Fronius) must be too high to meet the condition of the temperature coefficient of the power. Simple check: Vmpp(70°C) = 590.74 V, Impp(70°C) = 9.69 A, so the Pmpp(70°C) would be 590.74 V * 9.69 A = 5722 W. This would be a relative change of -0.233 %/K of the power, so far too less. The datasheet says -0.37 %/K. Hope that clarifies the matter. If you have any question on the topic, please don't hesitate to ask. In the meanwhile, we will contact Fronius to point them out to this problem as well. Kind regards, Martin
-
Hi S.A.Basit, the usage of the cable plan in 3D is documented here: http://3d-help.valentin-software.com/pvsol/en/#t=html%2Fen%2F3d%2FEinfuehrung_in_den_Kabelplan.htm If you need further information, please don't hesitate to ask. Kind regards, Martin
-
Differences in results in almost identical simulations
developer_mh replied to Ricardo's topic in PV*SOL
Hi Ricardo, this is an interesting case! Could you please provide the project files (the big one and the three small ones), so that I can have a look what is happening there? You can either send them here directly or by private message. Thanks a lot, Martin -
yes, R7. But right now we don't have a release schedule for that, sorry. Kind regards, Martin
-
Hi Ries, there was indeed an error in summing up the areas of the module surfaces that are connected to one inverter. Thank you for calling our attention to that. It happens in cases when not all modules from one module area are connected to one inverter. Actually a case that occurs not so seldomly, and it was correct in versions before 2019 R1, but we refactored parts of our code base where this bug came in. Again, thank you for finding this. We will release a bug fix in the next bugfix release - but not in the upcoming R6, since this is already on the way. Kind regards, Martin
-
Hi Tim, thanks for the question. Right now there is no option for wind turbines, but we will add it to our list of feature requests. Thanks and kind regards, Martin
-
Hello Hayder Ali, thank you for your question. I am afraid that this is not possible at the moment. But we will put it on the list of feature requests. Kind regards, Martin
-
Hi Magnus, yes, I will forward this request to our database team so that they can contact Ja Solar in order to have their newest products inserted into our database. If you want, you can also contact the manufacturer directly (as they are responsible to update the database entries) or send a notification to our database team at database@valentin-software.com Kind regards, Martin
-
Hi Ries, could you provide a project file, please? This would make it easier for us to see what is going on there. You can either post it here directly or send it to me via private message. Thanks a lot in advance, Martin
-
Hi Jack, if the desired inverter is not in our database (which is filled by the manufacturers), you have two options: Enter the inverter yourself Contact the manufacturer to enter their inverter Ideally, you could do both, so that you can start planning your PV system with the inverter right away and you have the manufacturer notified of the missing entry. The easiest way to enter the SE50K manually is to create a copy of the SE33.3K and change the values according to the datasheet (https://www.solaredge.com/sites/default/files/se_commercial_three_phase_inverters.pdf) I will inform our database team so that they as well can contact SolarEdge to have the new products entered. Thanks and kind regards, Martin
-
Hi Tim, if you combine SolarEdge (SE) power optimizers with non-SE inverters, one difference will be the DC voltage range. SE inverters usually have a fixed DC voltage, other inverters have a rather wide range of several hundreds of volts where they can track the IV curves and find the maximum power point (MPP). The output will be slightly different, yes. The best way to find out these differences is just to simulate different systems and compare the results Kind regards, Martin
-
Hi Kristian, I am afraid that this is not possible at the moment. Right now the starting SOC of the batteries in stand alone (offgrid) systems is determined by the average SOC that is roughly to be expected during operation. For that we take the SOC control parameters of the diesel generator: Considering the time and the SOC thresholds we determine an "average" SOC that is used as a starting point. This behaviour was desired by the SMA engineers to avoid untypical system behaviour in the beginning of the simulation (the offgrid simulation part of PV*SOL was design for SMA in the first place, some years ago). But we will put this feature request on our list, thank you. Kind regards, Martin
-
Hi Low Carbon Exchange, thank you for your feedback! We will look into that for the next release. Kind regards, Martin


