developer_mh
-
Posts
1,855 -
Joined
-
Last visited
-
Days Won
173
Everything posted by developer_mh
-
Hi Mehdi, the installation type is important for the thermal behaviour of the PV module. Please have a look here: https://help.valentin-software.com/pvsol/2018/pages/pv-modules/#installation-situation https://help.valentin-software.com/pvsol/2018/calculation/pv-modules/module-temperature/ Kind regards, Martin
-
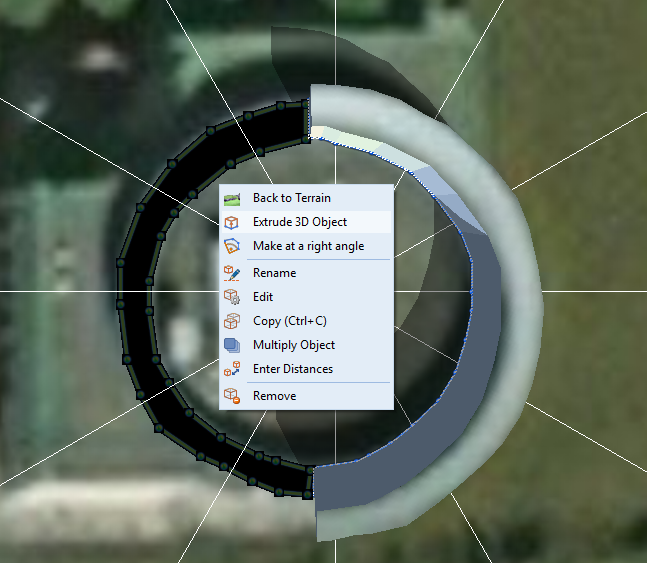
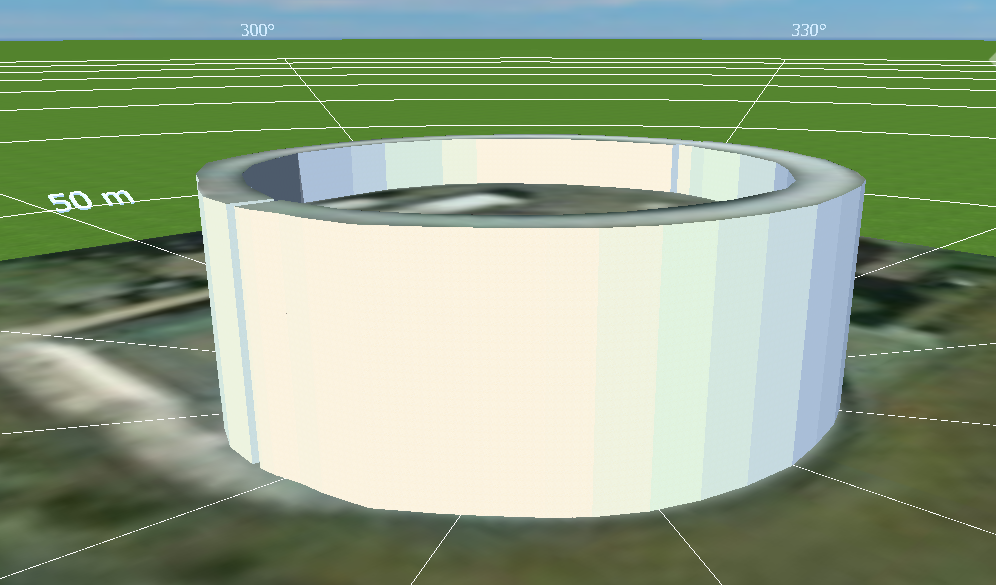
Hi Dennis, another good question Unfortunately, you can't draw modules on parapet walls, since these are regarded as obstacles. What you would have to do is to either model this biulding in another 3D software, e.g. sketchup, that offers more modelling options, and import that model afterwards. Or you extrude the segments of the building one after another. Personally I would recommend the first option, but if you'd like to do it in PV*SOL, here is what you would have to do: Sketch a 3D polygon of one half of the outer raised ring (the former parapet) and extrude it to its final height, i.e. 2m above the height of the inner area Go back to the map section and extrude the other half of the ring The go back to the map and extrude the center ring, but with less height. Like this, you'll get a building where you can place modules in the inner area as well as on the outer wall. I just did it quickly to demonstrate that it is possible, I am sure you can get better results: Hope that helps, kind regards, Martin
-
Hi Dennis, good question! Since we don't assign the electrical appliances to specific phases (L1, L2 or L3) in a 3-phase grid, we simply assume that all consumption takes place on the same phase as the PV inverter is feeding in. If you want to show your customers the differences in the self consumption rate when using 3- or 1-phase inverters (that certainly exists, as you correctly pointed out), you should identify the appliances that are connected to L2 and L3 and subtract their consumption from the load profile, so that you only consider the load on L1 when using a 1-phase inverter. Kind regards, Martin
-
Hi Stuart, sorry, my information wasn't complete. On that page you will see this number only if you don't have electrical appliances in your system. If you have, you can still see it under 'Financial Analysis' further down. Kind regards, Martin
-
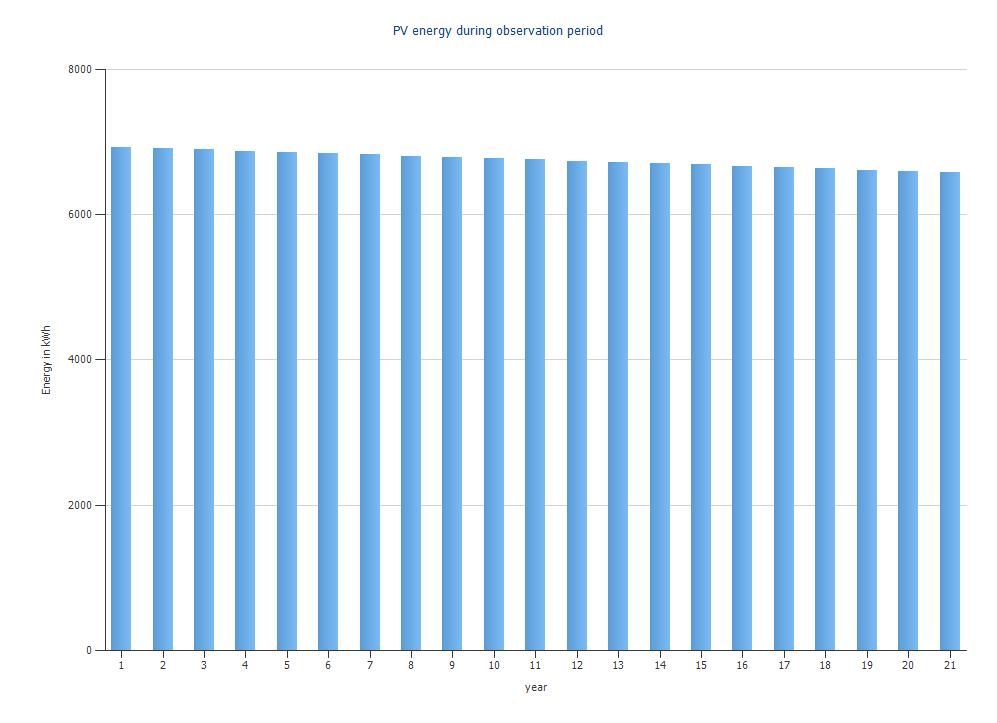
Hi Stuart, in the simulation of the first year of energy production, the module degradation is not accounted for. It is applied only to the economic calculations and displayed in the diagram 'PV energy during observation period'. This diagram is also included in the project report. On the results page, under 'Simulation', you'll see also the reduced grid feed-in due to degradation in the first year: Unfortunately we do not provide the average over the observation period in the results. You would have to copy the data table of the diagram above to the clipboard, paste it in Excel and calculate it there yourself. Hope that helps, kind regards, Martin

-

Instant AC power genereted by system - how to see?
developer_mh replied to JaroslawKonopka's topic in PV*SOL
Hi Jaroslaw, one important thing first: The climate data we use in PV*SOL are no real-time weather data of the current year! The data is a compilation of the past 20 or 30 years, this is an important difference, please have a look here: https://help.valentin-software.com/pvsol/2018/calculation/irradiation/climate-data/#what-are-climate-data-sets-what-does-typical-mean-year-mean But nevertheless, you can of course have a detailed look at the instantaneous power of the system in the diagram editor on the page 'Results', under 'Simulation'. Choose 'Select data series' to select the series 'PV energy AC minus standby use': There you see the AC power in Watts. And your electrician actually gave you a good advice. Your installed power on the DC side is 9920 W, the max output on the AC side is 9000 W, so you have a dimensioning factor of 110 % (9920 / 9000). This is a very reasonable system design, as you very rarely reach the full 9920 W with your system. It is better to choose a slightly smaller inverter, that saves you money and the amount of energy that you loose is negligible. Hope that helps! Kind regards, Martin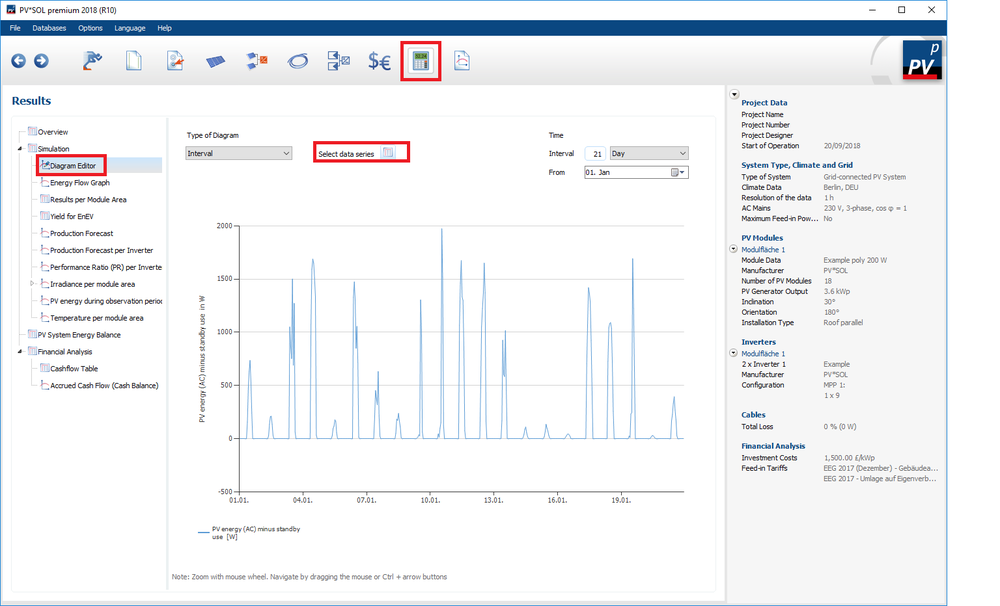
-
Hallo myrza, die Sunny Islands von SMA sind alles einphasige Geräte, daher braucht man in dreiphasigen Systemen immer mindestens drei Geräte, also eins pro Phase. Musst du für deine Masterarbeit wirklich ein Offgrid-System dimensionieren? Wenn nicht, wähle die Anlagenart "Netzgekoppelte PV-Anlage mit el. Verbrauchern und Batterie-System". Da hast du dann auch Speichersysteme zur Auswahl, die man direkt so kaufen kann. Ich denke, du meinst wahrscheinlich eher sowas? Beste Grüße, Martin
-
Thank you very much for the kind words! We are very pleased to hear that
-
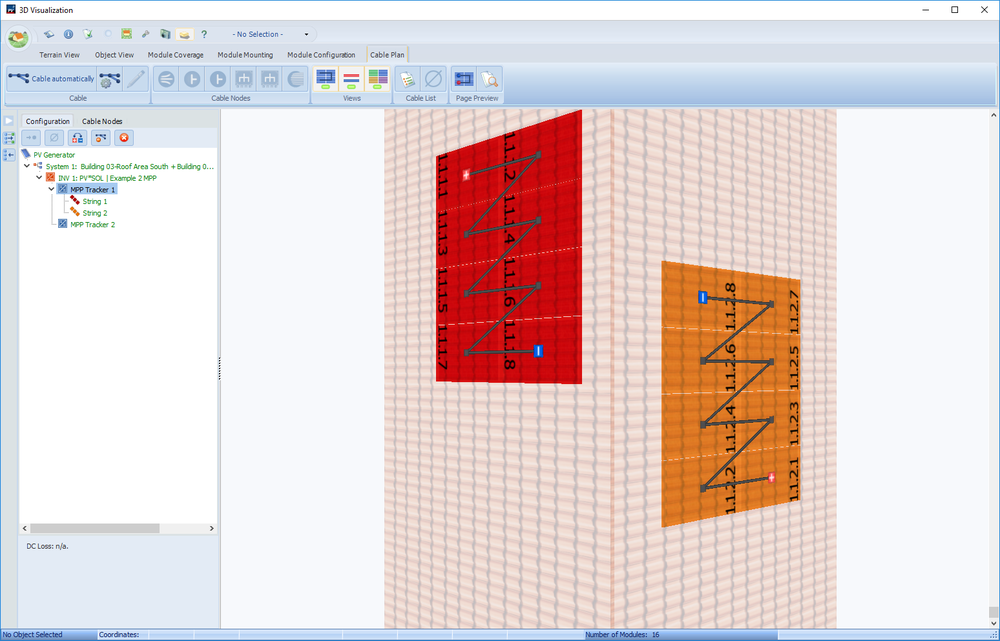
You can place cable grommets for each inverter configuration, if this is what you mean. Just drag and drop them from the toolbar onto the roof, then right click on the inverter configuration and select 'Cable with' -> Cable Grommet 01. When right clicking the cable grommet you can also set the distance from there to the inverter. I think you can achieve what you need by placing cable bundles along that path and grommets at the end and then connect them all by following the steps above (right click, select 'cable with' option etc.) You can use the distance to the inverter option for that. Ah, yes, if you configure panels from different module areas together on one MPP tracker, they will share a cable path. That will look like this: But you cannot really edit the connection between the two roofs afterwards. You can start by reading the help pages here: http://3d-help.valentin-software.com/pvsol/en/#t=html%2Fen%2F3d%2FEinfuehrung_in_den_Kabelplan.htm And then, perhaps a look at our video tutorials might help in some specific questions: https://www.youtube.com/user/valentinsoftware/videos If you miss more help on a specific topic, please let us know! Kind regards, Martin
-
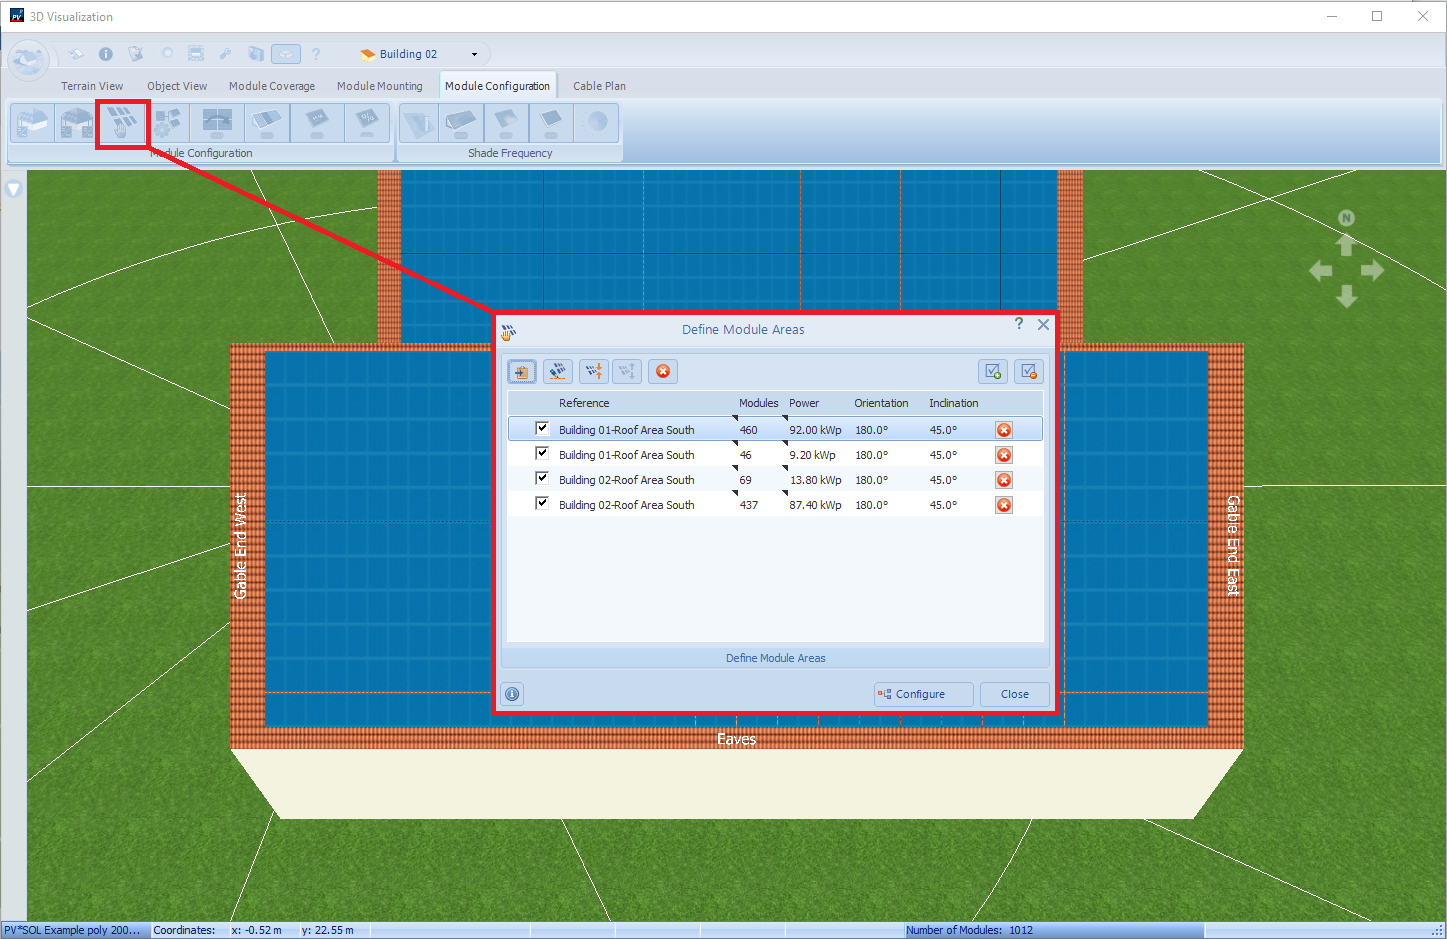
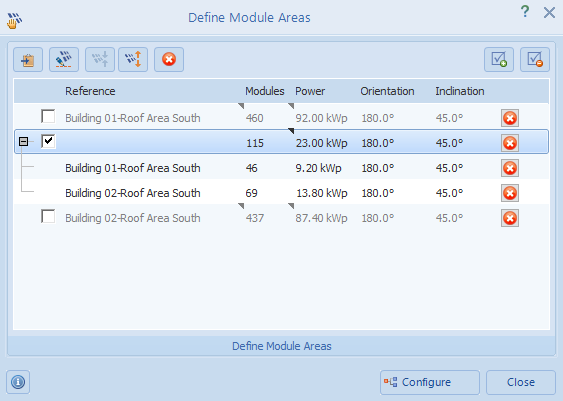
Hi James, you are right, in polystring configurations you can only have one inverter at the moment. If you want to configure your two module areas to three different inverters, you would have to split the module areas in advance. Just select the first 460 modules of building 04 while in the 'Module Configuration' tab, and then right click and add them to the 'Define Module Areas' dialog. Then select the remaining 46 panels of building 04 and add them two. The same you do with building 02, 69 panels first and then 575 panels. Then go to the 'Define Module Areas' dialog: When you select the two items in the middle, i.e. the 46 modules from building 04 (building 01 for me) and the 69 modules of building 02, you can click on 'Combine Selection' to get the modules together: Now you can configure them with thre different inverters, as you desired. Good luck and kind regards, Martin

-
New PV*Sol 2018 is excellent, some small problems.
developer_mh replied to jamesbm's topic in PV*SOL
Hi Pablo, thanks a lot for your kind words. Let me recommend our youtube video on Pix4D models to you, perhaps you will find some settings there that will help you out. I think especially the Processing Options of Pix4D are of importance. We also offer technical support for all of our customers, so if you decide to become our customer (which would make us really happy), you can send in your model and have it checked. No guarantee that we can fix it though, as there are a lot things that can get complicated in the world of 3D models. Kind regards, Martin -
Hi Anders, just click on my username and then on "Message". Kind regards, Martin
-
Hi Ricardo, what you heard from your German colleague is actually true. We are known to model PV systems more on the conservative side. This prevents our customers from bad surprises That is, when you plan your PV system in PV*SOL, you can be very confident that you will reach and most likely surpass this yield in reality. In our opinion, this is a very important fact that system planners really appreciate in the long run. But we can't say for example that our simulated yields are always 2% under the real yields. If you simulate 100 systems around the world with different technology and so on, the spread will be 5 to 0 % deviation, with an average of around 2%. Hope that helps, kind regards, Martin
-
Hi Ricardo, I understand the uncertainties that these difference may cause. The fact is that there is no single "truth" for climate data for a given location, but different use cases and data sources. MeteoNorm tries to compile long term typical meteorological years for any location around the world, usually comprising 20 to 30 years of ground based or satellite measurement. That means the climate data you get from MeteoNorm is very typical for a location when looking at the last 20 or 30 years. This kind of data is generally accepted as valid input data for photovoltaic system analysis. In some countries however there are published standards with predefined climate dataset of varying provenience. Some projects or investors in these countries require PV simulations to use these data as input in order to introduce some kind of comparability between the simulations. This might be reasonable when there are a lot of climate data providers that offer climate data of very incosistent quality. To be honest, I don't know how the authors of UNE EN 94003 2006 had their data from. Given that the process of standardisation usually takes several years, these data were likely recorded well before 2006, I guess around 1990. MeteoNorm uses data from 1991 - 2010, so perhaps this is the reason for the difference in the annual irradiation sum. But we would have to know the source of the 94003 2006 data to really understand the differences. If you plan PV systems in Spain, and no one is asking you or your company to use the UNE data, I would personally go with the more up-to-date data of MeteoNorm. Kind regards, Martin
-
Hi Ricardo, the model chain of PV*SOL is quite complex, I would recommend our help sites as a start: https://help.valentin-software.com/pvsol/2018/calculation/ As you can see, there a really a lot of input data, parameters and algorithms that all play their part in the simulation of a PV plant. The complete comparison of the PV*SOL and the SolarGIS model chain could easily make up a Master thesis Just to name a few key questions that strongly affect the PV output: What meteorological input data do you use for irradiance and temperature? Do you simulate in 1h or 1min resolution? What models do you use for diffuse irradiance and transposition to the module plane? What models for reflection, soiling etc? How do you model the temperature and weak light behaviour of the PV module? How is the circuitry and the interconnection as well as ohmic losses accounted for? How detailed is the DC/AC inverter model? But from the history of our two companies you could perhaps conclude that SolarGIS is very strong in providing meteorological input data, while we have a strong expertise in modelling the electrical behaviour of PV systems and rely on meteo data provider MeteoNorm (as you already know from a previous blog post). Kind regards, Martin
-
Hi Ricardo, another interesting question you ask there! The shading frequency in the 3D environment that is shown on every module (what your image is displaying) is the percentage of the annual reduction of the direct irradiance on the module under clear sky conditions. You can interpret this as the lowest possible loss that will occur due to the shadows on this module. In the simulation there are a number of additional effects that will lessen the energy output, i.e. diffuse shading, mismatch of the electrical behaviour (as you described it) and so on. The percentage you get in the report is really the annual energy loss due to shading. There we compare the energy output of the PV plant without any shadows with the real one, so we include all various effects. Hope that clarifies the matter, please let me know if not. Kind regards, Martin
-
Dear Ricardo, thanks for your question. In PV*SOL we use the climate data provider MeteoNorm that also takes care of the climate data interpolation. For some countries, we additionally provide extra climate files. This is the case in Spain as well, where the climate files that you can select correspond to the UNE EN 94003:2006 "Datos climáticos para el dimensionado de instalaciones solares térmicas." These climate data files might differ from what you get out of MeteoNorm. In your investigation, the locations of Barcelona and Girona show climate data from the UNE standard, while the interpolated location of Santa Eugenia de Berga shows MeteoNorm climate data. You will also see that when you create your own climate data location near Girona or Barcelona, you will have values of around1610 kWh/m² as well. When I use MeteoNorm directly, i.e. the stand-alone version, and create the location of Santa Eugenia de Berga, I get the information that it is 100% satellite data that is used for the interpolation. Micro-climate features like fog are not considered, no. But there are some interesting specialities of the MeteoNorm interpolation algorithm that is worth a read: http://www.meteonorm.com/images/uploads/downloads/mn72_theory7.2.pdf Hope that helps, kind regards, Martin
-
Hi Anders, thanks for getting back to us. To be honest, I am having a bit touble to fully understand what happens on your machine. Could you provide a step by step description of what you are doing and what is happening? I am asking, because in the first place, you cescribed your "second problem" to be caused by using 3D planning after not using it in the first place. Now it seems more to be related to using the map section of the 3D planning. Also, it is not possible to swap the map section after you already worked with it, so I am not sure I understand your second problem description. Concerning the help: I just tested it in all possible variations but I can't get the help to not show up. What happens if you hit F1 to show the help? Perhaps you can record a short screen video to demonstrate your problems? you could send them to me by private messages. Thanks a lot and kind regards, Martin
-
Hallo Felix, ein richtiges Schnee-Modell ist in PV*SOL leider noch nicht hinterlegt, da hast du recht. Abgesehen von der Information, wann wo wieviel Schnee fällt (was schon nicht einfach zu ermitteln ist), braucht es ja dann auch noch gute Modelle, die in Abhängigkeit von Außentemperatur, Sonneneinstrahlung, Windgeschwindigkeit und Modulneigung ausrechnen, wie lange der Schnee auf den Modulen liegen bleibt. Also keine triviale Sache Aber wenn man die Schneeliegedauer kennt, und aus Erfahrung sagen kann, an wieviel Tagen zB im Januar die Module eingeschneit sind, kann man diesen monatlichen Prozentualwert bei den monatlichen Verlusten durch Modul-Verschmutzung eintragen. Auf der Seite PV-Module, unter Weitere Parameter, Punkt Simulation, ganz unten. Ich hoffe, das hilft weiter. Beste Grüße, Martin
-
Die geignete Konfiguration von Wechselrichtern für 4048 aleo S_19 270Wp
developer_mh replied to Jay's topic in PV*SOL
Hallo Jay, nach welcher Vorgabe soll denn die Anlage verschaltet werden? Bist du frei in der Wahl der Wechselrichter? Dann würde ich zur Reduktion der Anzahl empfehlen, Wechselrichter mit einer größeren Leistung einzusetzen. Du kannst auch Modulflächen mit gleicher Ausrichtung und Neigung zusammenfassen, um sie dann gemeinsam zu verschalten. Viele Grüße, Martin -
Hi Andreas Lundberg, we are happy that you are considering to purchase our software. And then of course, we are not happy that you experience problems while working with it. If I get your first problem right it seems that PV*SOL is sent to the background when you click on 'Start'. I would guess that there is another program/tool involved on your machine that causes this behaviour, since we can't reproduce this here and have no other customers complaining about this. Normally, the splash screen should appear after you click 'Start', and finally the software should open up in the foreground. Perhaps you can check what antivirus software you are running and allow PV*SOL there in the whitelist. Concerning the second problem: Could you describe exactly what you do to produce the crash? Is it reproducible? That a lot in advance for collaborating, I am sure we will find the solution to your problems. Kind regards, Martin
-
Hi M.Khalifa, I guess you refer to the sizing factor or dimensioning factor that describes the PV power installed on the DC side in comparison to the nominal AC power of the inverter? Right now it is not possible to include it in the report, I am afraid, but since we are in the progress of redesigning the report, I will forward this request to my colleague. Thanks and kind regards, Martin
-
Hi James, the solution in this case would be to select the Polystring option (called 'Polystring Configuration' in the software). Then you can select any inverter you want and connect the strings form different module areas as you desire. Hope that helps, kind regards, Martin
-
Hi Mohamed Alaa, I just opened up a new thread for your question since it touches a slightly different topic, I hope this is ok for you. The message 'Bad file version' pops up if you try to open project files in older program versions. For example, when you create a project in PV*SOL premium 2018 R9, you can't open it in PV*SOL premium 2017 R9, or sometimes even in newer versions of PV*SOL premium 2018 (i.e. R8 and before). So, please ensure that you have the same software version of both of your devices. Kind regards, Martin
-
pvsol Configuration of two roof areas with 2 inverters multiple MPPT's
developer_mh replied to Marius's topic in PV*SOL
Hi Marius, you are right, when configuring tow module areas together you cannot see the inverters separately. In your case you would have to split your eastern module area in two smaller units (10 x 18 modules and 3 x 18 modules), so that you can connect a part of the eastern module area to inverter 1 and the other parts to inverter 2, together with the western module area. Hope that helps, kind regards, Martin