developer_mh
-
Posts
1,855 -
Joined
-
Last visited
-
Days Won
173
Everything posted by developer_mh
-
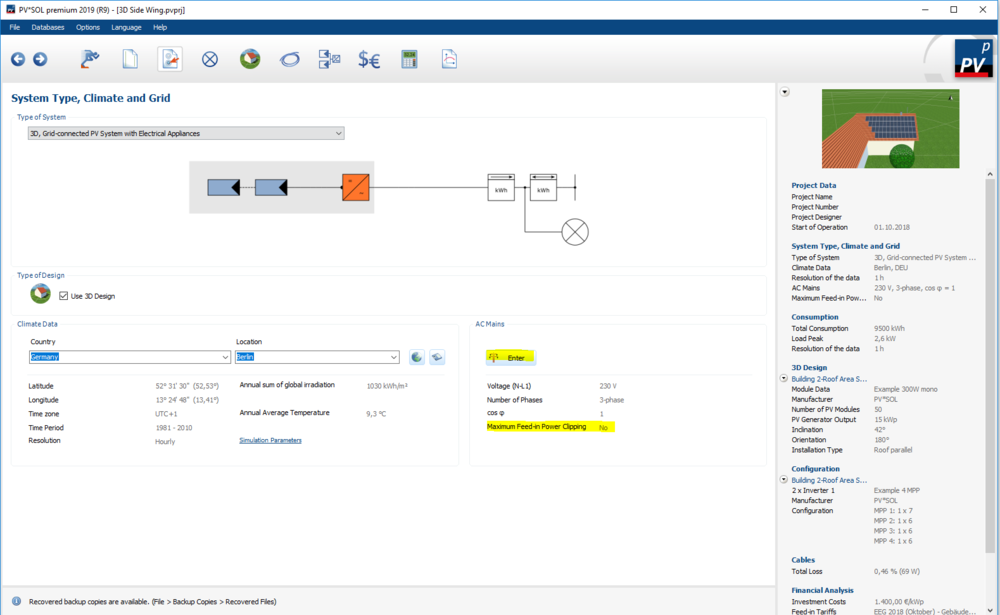
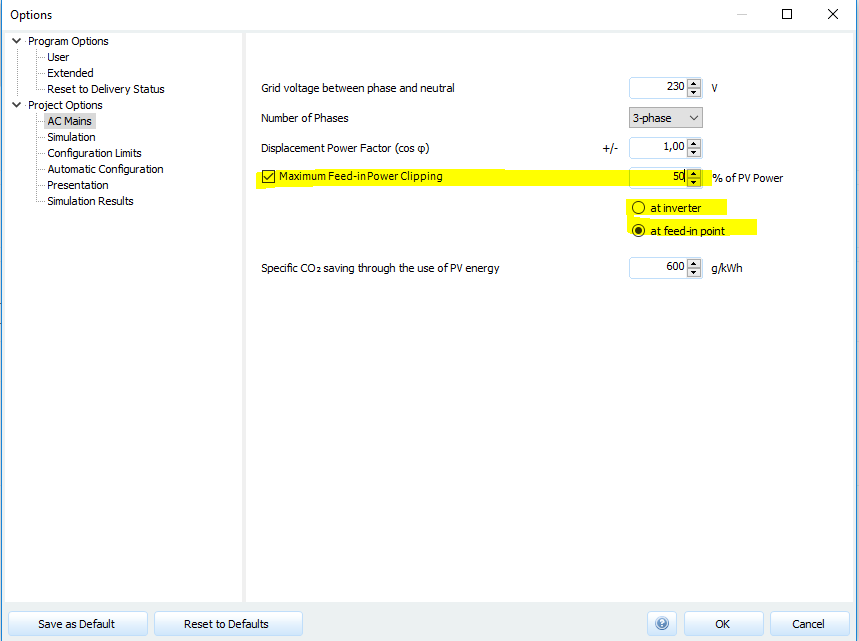
Hi Jtebuck, there are various kinds of clipping mechanisms in PV*SOL. 1) There are inverter clippings due to voltage, current or power limitations that take place directly in the inverter. You can see these effects in the results in the energy balance: 2) Then there are maximum power clippings that you can edit on the page "System Type, Climate and Grid" in the AC mains section: I guess this option would be the best to suite your needs. The clipping threshold is set in % of the PV power installed on the DC side, so you would have to calculate the corresponding percentage beforehand. Let me know if this is what you need. Kind regards, Martin
-
Hi Raphael, yes, it is sufficient to install just the latest version. All installers of PV*SOL comprise the whole functionality. Kind regards, Martin
-
Hi Marta, yes, this message is shown when the total upload size exceeds 10 MB (which was the limit for all users). I raised it to 20 MB now so you can retry and upload the other screenshots. Kind regards and have a nice weekend, Martin
-
Hallo, die einzige Möglichkeit, die ich da sehe, wäre genügend Module in die Strings zu packen, also mindestens 13, die ausreichend bestrahlt werden. In diesem Fall würde das aber nicht gehen. Eine andere Lösung wäre, einen anderen Wechselrichter mit einer niedrigeren MPP-Spannung zu verwenden. Der SE6000H z.B. arbeitet auf 380V, das wäre in diesem Fall schon sehr viel passender: Beste Grüße, Martin
-
Hi Marta, I am not sure if I can reconstruct your problem correctly. Could you describe step by step what you do (click) after opening PV*SOL? This would be helpful. Ideally you could provide a screenshot of each step. Which version do you use? Do you use climate data that you generated yourself? Kind regards, Martin
-
Hi Gustavo, you would need to fill up the data series for 365 days. If you have a 15 min resolution, you need 35040 values for one year. Since you have only 337 days of measurement, PV*SOL 'complains' that the number of records is wrong. The solution is to provide a full year of data, then it works. Kind regards, Martin
-

Return on Assests (Gesamtkapitalrendite) calculation
developer_mh replied to Vishnu's topic in PV*SOL
Hi Vishnu, thank you for your question. We calculate the Return on Assets (german: Gesamtkapitalrendite) with the internal rate of return (interner Zinsfuß). In the old help files, this information was provided in the glossary: http://3d-help.valentin-software.com/pvsol/en/#t=html%2Fen%2FBegriffe.htm&rhsearch=internal rate of return&rhsyns= &rhhlterm=internal rate of return We will add this information to the new help files. Thank you for pointing us to the missing info. Here is more on the method to calculate the internal rate of return: https://en.wikipedia.org/wiki/Internal_rate_of_return Hope that helps, kind regards, Martin -
Hallo GeromeK, die Klimadaten in PV*SOL kommen von MeteoNorm, einem speziell auf Klimadaten spezialisierten Produkt. (https://meteonorm.com/) Die Daten für Deutschland beruhen auf den langjährigen Zeitreihen des Deutschen Wetterdienstes. Sobald der DWD seine Testreferenz-Zeiträume aktualisiert, landen diese Daten also zunächst in Meteonorm und dann mit dem nächsten Aktualisierung der Schnittstelle bei uns. Es ist also nicht so einfach möglich, einen aktuelleren Zeitraum zu wählen. Wenn die Klimadaten aktualisiert werden, informieren wir darüber natürlich in den Release Notes. Hier noch etwas ausführlicher zu den Test-Referenzjahren: https://help.valentin-software.com/pvsol/2019/berechnungsgrundlagen/einstrahlung/klimadaten/ Beste Grüße, Martin
-
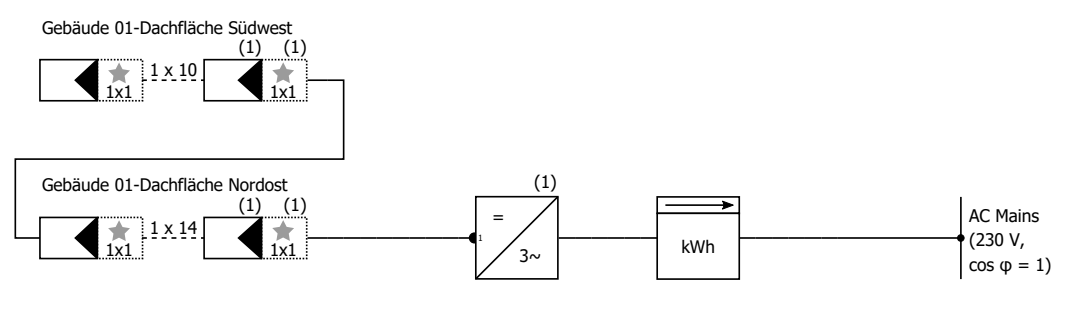
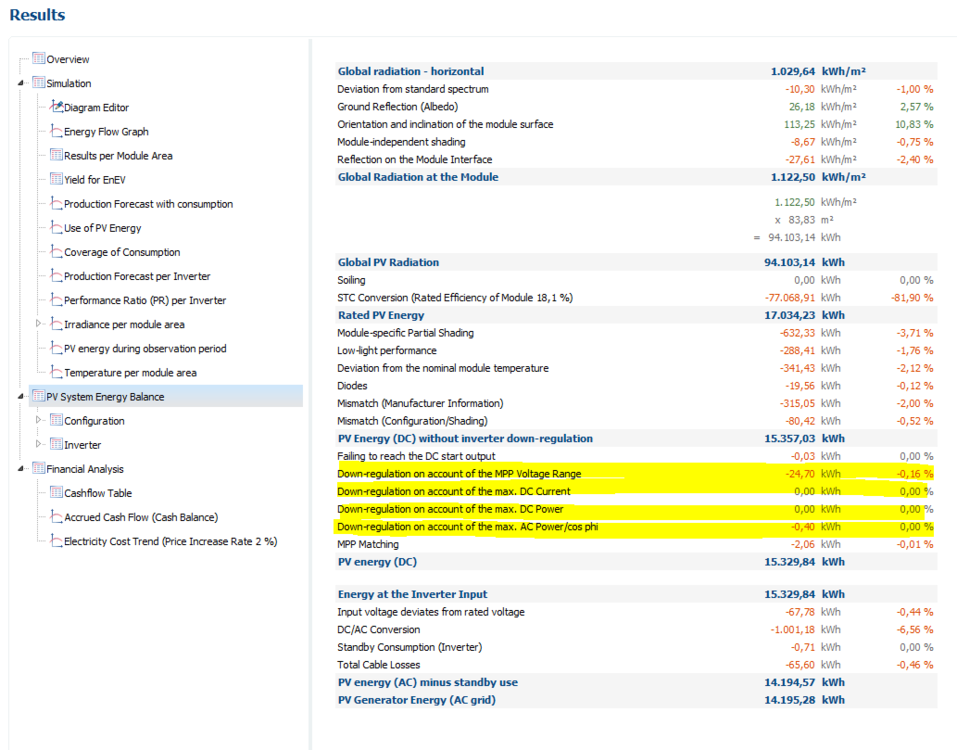
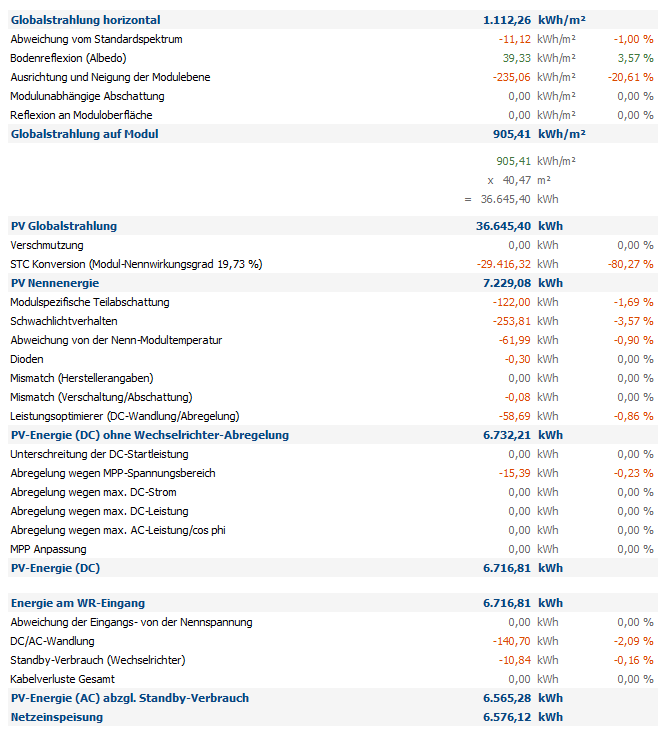
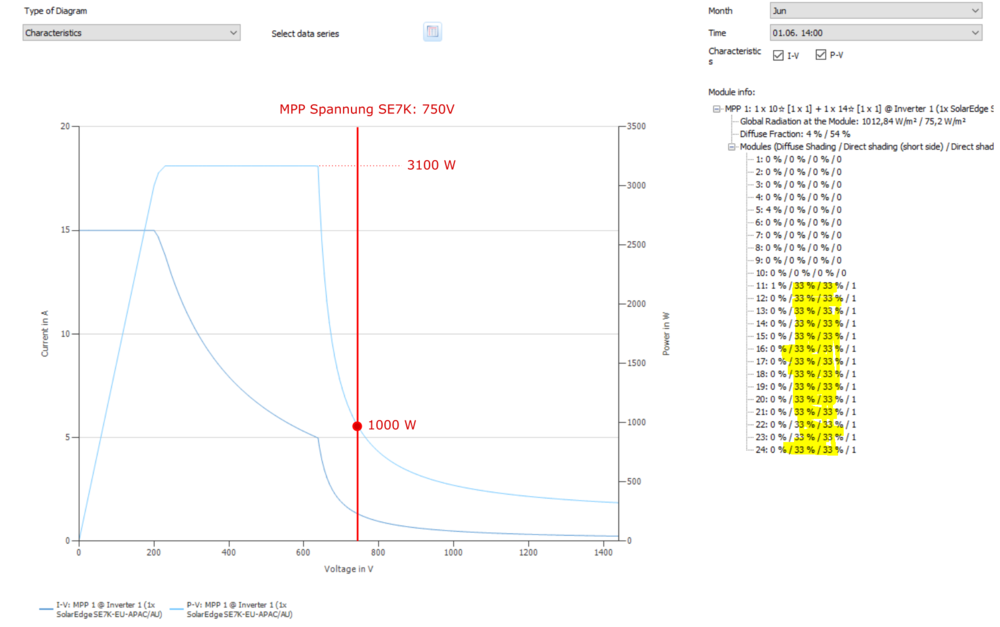
Hallo GeromeK, vielen Dank für das Projekt. Für die anderen Leser fasse ich mal die Anlage-Konfiguration zusammen: In diesem Fall sind 14 Module mit SolarEdge P370 Powert-Optimizern auf einer Dachfläche (Nord-Ost) in Reihe geschaltet mit 10 Modulen auf der gegenüberliegenden Dachfläche (Süd-West), die ebenfalls mit P370 ausgestattet sind. Der SolarEdge Wechselrichter SE7K, an den die Module angeschlossen sind, hat eine feste MPP-Spannung von 750 V. Was in diesem Fall passiert, kann man sich anhand der Kennlinien in den Ergebnissen ganz gut visualisieren. Die Aufzeichnung der Kennlinien kann man in den Programmoptionen unter "Simulation" aktivieren. Ich nehme mal als Beispiel den 01. Juni um 14h. Da wird die süd-westliche Dachfläche mit 1013 W/m² bestrahlt, während die im nordosten nur 75 W/m² abbekommt, da sie im Vollschatten liegt. Dadurch überlagern sich die Kennlinien der Power-Optimizern zu folgender Gesamt-Kennlinie, die der Wechselrichter sieht: Dunkelblaue Kurve: Strom-Spannungs-Kennlinie Hellblau: Leistung-Spannungs-Kennlinie Das Überlagern der Kennlinien läuft in einer Reihenschaltung ja so, dass sich die Spannungen addieren, während die Ströme gleich bleiben. Um die MPP-Spannung des Wechselrichters zu erreichen, braucht man mindestens 13 Module mit P370 Power-Optimizern ( 750 V / 60 V = 12,5 - die 60V kommen von der maximalen Ausgangsspannung der P370). In diesem Fall werden aber nur 10 Module voll bestrahlt, die restlichen 14 auf der nordöstlichen Seite tragen kaum etwas bei. Daher sackt die Leistung knapp über 600 V auf der Gesamt-Kennlinie ab und der Wechselrichter sieht nur noch etwa 1000 W statt der eigentlich verfügbaren 3100 W. Diese Verluste werden dann der Abregelung wegen des MPP-Spannungsbereichs zugeschrieben und sind insofern korrekt. Das zeigt mal wieder, dass der Einsatz von SolarEdge-PowerOptimizern nicht zwangsläufig zu einer Ertragssteigerung in jeder beliebigen Anlagen-Konfiguration führt. Auch hier muss sehr genau (wie bei herkömmlichen Wechselrichtern auch) auf die Verschaltung geachtet werden. Daher wird auch von SolarEdge für die neuen P370 bei 3phasigen Wechselrichtern (wie der SE7K einer ist) eine minimale Modul-Anzahl von 16 vorgeschrieben, um diese Art von Verlusten zu vermeiden. Siehe hier: https://www.solaredge.com/sites/default/files/se-p-series-add-on-frame-mounted-power-optimizer-datasheet-de.pdf Darauf wird bei der Verschaltung in PV*SOL auch hingewiesen, wenn die neuen P370 gewählt werden (die mit worldwide im Namen). Beste Grüße, Martin

-
Hallo GeromeK, wäre es möglich, uns die Projektdatei zukommen zu lassen? Gerne hier im Forum per private message, danke. Viele Grüße, Martin
-
Hi Patrik, you are right, sorry. The edge numbers are only shown for "Arbitrary buildings". If you select "Edit" on a standard building, you don't see the edge numbering. But the scheme is the same, the first polygon segment that you draw defines your lateral surface/wall/side n# 1 of the building. Then you go clockwise to number the other lateral surfaces/walls. Kind regards, Martin
-
Hi Patrik, if you right click the extruded building and then "Edit" you'll see the edge numbering. These are the same as used for the textures. Edge 1 is the first edge that was drawn. Heop that helps, kind regards, Martin
-
Hi Jan, the economic caluclations in PV*SOL are based on the net present value, see the formulas here: https://help.valentin-software.com/pvsol/2019/calculation/financial-analysis/ So, yes, it includes all assets that are part of the LCOE calculation as well, like loans, taxes, operating costs and so on. Hope that helps, kind regards, Martin
-
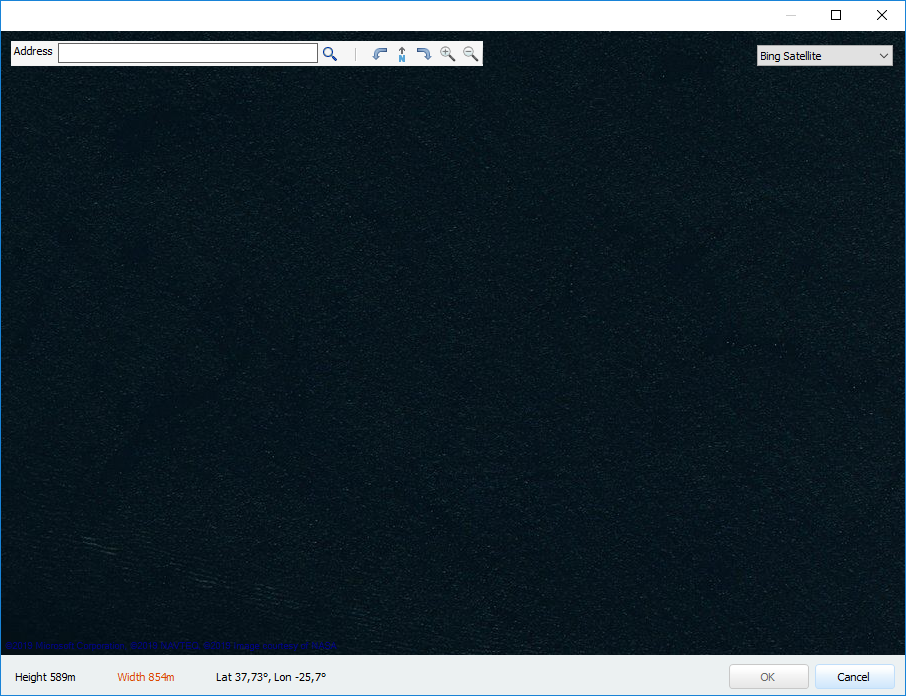
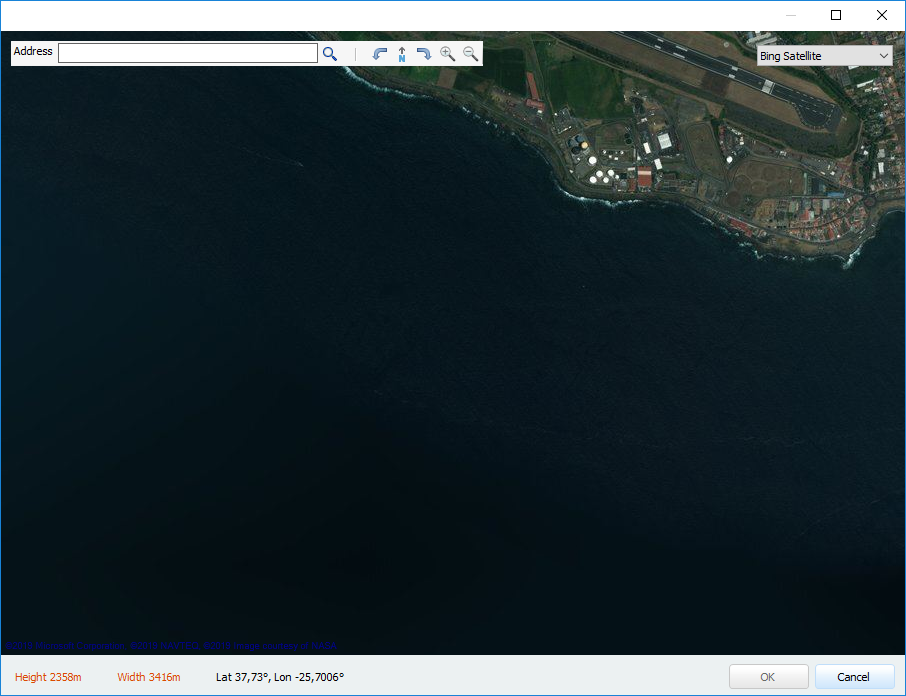
Hi Marta, what do you mean by "Trim Map"? I just tried it again here, I chose the climate location Portugal - Ponta Delgada, then I open the 3D environment, choose "Map Section", then click on the Image "New Map Section, Click here", then I see this: This seems dark, but is just ocean. It is dark blue If you zoom out just a little (not totally), you see that the island is just nearby: Perhaps this is what confused you. You can drag the map with your mouse, you can zoom with the mouse wheel. Just select the location you want, zoom in so that neither the height nor the width label are red, and hit "OK". Good luck, kind regards, Martin
-
Hi Vicente, could you send us the 3D model (the obj file), so that we can have a look? Thanks, Martin
-
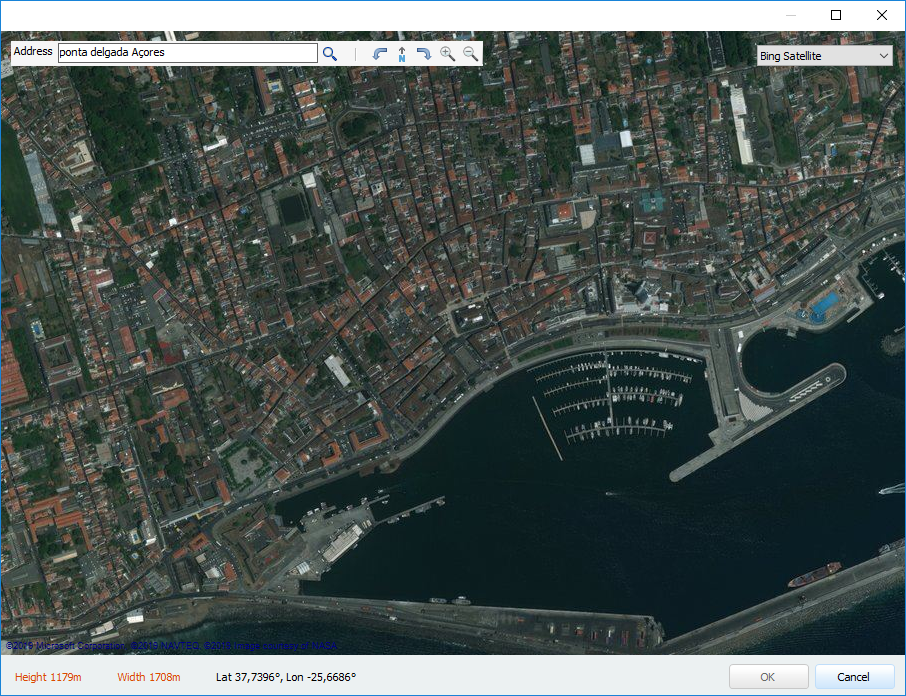
Hi Marta, regarding the first question: Perhaps your internet connection was not up when you first searched. Try to search again for "ponta delgada Açores", and it should show the following: Sometimes, if the internet connection hangs, nothing is shown. So try to zoom in and zoom out and then it should be fine. Regarding the second point: The "OK" button is disabled if the selected map area is too large for PV*SOL 3D environment. It can handle 800 m in East-West (Width) and 800m in North-South (Height) direction. If either dimensions is exceeded, the corresponding field is labelled in red and the OK button is disabled. Hope that helps, kidn regards, Martin
-
Hallo Raphael, Meteonorm 7.3 wird spätestens in der Version 2020 R1 kommen, also im Herbst diesen Jahres. Beste Grüße, Martin
-
Hi James, you can send me files here by private message, thank you. Kind regards, Martin
-
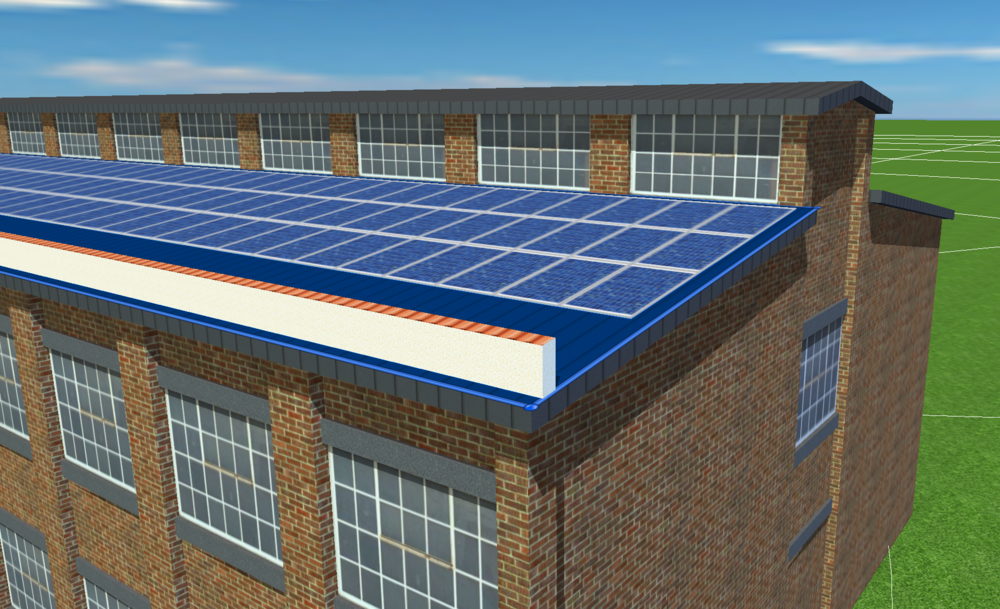
Hi Vicente, if you use imported 3D models like the one you have, shadings from "verges" (or parapets, or attics or how they are called) can lead to wrong results. A solution would be to remove the verge/parapet/attic from your model, import it afterwards in PV*SOL and then place a verge there. Like so: Then the shading calculations should be fine. Hope that helps, kind regards, Martin
-
Hi James, yes, we had this problem again with the climate data. And before I begin, I'd like to repeat our apology for the inconvenience caused. It is difficult to explain why this happened without explaining in detail our code structure, employee situation and testing environment. But you as a user have a right to know, so I'll try it. As you know we already had this bug one year ago in our 2018 version. That time we already developed a new version of PV*SOL (2019 R1) where we refactored (restructured, redesigned) a lot of code. When software grows over time, developers have to do this regularly in order to keep the code base manageable and extensible. As a consequence we had two versions (we speak of repositories, with several branches each) of the code base, the old one (2018 line) and the new one (2019 line). The bug we had with the Meteonorm data was fixed in the 2018 branch, but the employee who introduced and fixed the bug in the 2018 repository forgot to fix it in the 2019 repository as well. Before we published this new version he left our company (a bit spontaneously) and although we had a lot of handover meetings before he left, we oversaw this one line in the installation script that fetched the old MN data into our installation. There is a lot more to it but I won't go into details. All I can say is that we are really sorry that this happened again and we are aware of the message boxes are annoying our users once more. Thanks and kind regards, Martin
-
Hi Tim, thank you for your feedback. I will forward this question to our database team and see what they say. Kind regards, Martin
-
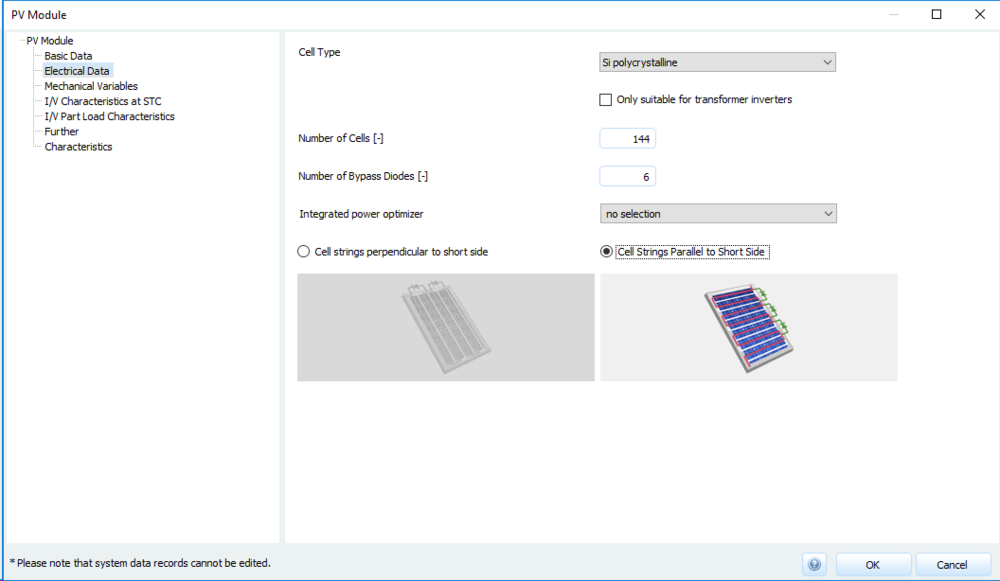
Hi Kamal, right now we don't have a distinct simulation model for half cell modules. But as we recognize that these modules are getting more and more popular, we do have this feature already on our list and hope to publish it soon. In the meanwhile you can just enter your own module data as follows: With these data you can simulate the module. The only thing that will not be 100% correct is the behaviour in partly shaded conditions, so simulate with care Kind regards, Martin
-
Hi Kamal, thank you for your question. In general the specific yield is not influenced by the consumption or the battery system, as long as it is AC coupled. That means that electric appliances and the battery system etc are connected on the AC side of the PV inverter. This is the case for most of the battery systems. But there are systems that are coupled on the DC side of the PV inverter, we call that DC generator or DC intermediate coupling. Refer to these explanations here: https://help.valentin-software.com/pvsol/2019/calculation/battery-systems/#type-of-coupling In the case of DC couplig the battery system and the consumers influence the AC output of the PV inverter, and so they influence the specific yield. On the one hand this is obvious, on the other hand it might seem a bit confusing, as you pointed out correctly. We are aware of this and we think of making it more clear in the results where the differences in yield come from. Hope that helps in the meanwhile, kind regards, Martin
-
Best software for installers? Information for beginning companies?
developer_mh replied to aapn77's topic in PV*SOL
Hi aapn77, since you posted this request in the PV*SOL forum, let me answer first from the PV*SOL perspective. I'll cover the points you mention in your question. You can import your solmetric suneye directly You can auto-fill any roof design, either in 2D design mode or in 3D You can have arbritrarily shaped "no-module-zones" You have regular updates of the software and the database, so you are always up to date You'll get (validated!) radiation data from all over the world You can also import Sketchup models in PV*SOL you you prefer to make your 3D models in Sketchup You get a very detailed and nice-looking report for your customers You get all the plans and drawings and nice screenshots on top You really shouldn't do all this work in an Excel sheet Let me put it like this: If you are a PV enthusiast or hobbyist, there is nothing wrong with cobbling your own calculation tool together. But if you are a professional this effort is just not worth it. The costs for PV*SOL will be saved within three to 10 PV projects that you plan, I would guess, depending on where you work and what size your projects are. Not to mention that you will have to prove to your customers that you did a good calculation and that there are no errors. We develop PV*SOL for about 25 years now, and have invested a lot in the validation of our algorithms, climate data, PV module and inverter databases and so on. No single person can provide that, it wouldn't make sense. My suggestion would be to just test PV*SOL 30 days at no cost and then evaluate if it fits your needs: https://pvsol.software/en/ Hope that helps, Martin -
Hello Marta, imported 3D models from Sketchup can have a variety of issues that arise due to the complexity of the model. Be sure to follow the hints here in the pdf when exporting your model: https://www.valentin-software.com/sites/default/files/downloads/sonstiges/en/3d-recherche-rev-01-en.pdf Also, in this video, there are some hints on how to work with Sketchup, so that we can import the model correctly: Hope that helps, kind regards, Martin