


developer_mh
-
Posts
1,860 -
Joined
-
Last visited
-
Days Won
173
Everything posted by developer_mh
-
Hi Ries, could you provide a project file, please? This would make it easier for us to see what is going on there. You can either post it here directly or send it to me via private message. Thanks a lot in advance, Martin
-
Hi Jack, if the desired inverter is not in our database (which is filled by the manufacturers), you have two options: Enter the inverter yourself Contact the manufacturer to enter their inverter Ideally, you could do both, so that you can start planning your PV system with the inverter right away and you have the manufacturer notified of the missing entry. The easiest way to enter the SE50K manually is to create a copy of the SE33.3K and change the values according to the datasheet (https://www.solaredge.com/sites/default/files/se_commercial_three_phase_inverters.pdf) I will inform our database team so that they as well can contact SolarEdge to have the new products entered. Thanks and kind regards, Martin
-
Hi Tim, if you combine SolarEdge (SE) power optimizers with non-SE inverters, one difference will be the DC voltage range. SE inverters usually have a fixed DC voltage, other inverters have a rather wide range of several hundreds of volts where they can track the IV curves and find the maximum power point (MPP). The output will be slightly different, yes. The best way to find out these differences is just to simulate different systems and compare the results Kind regards, Martin
-
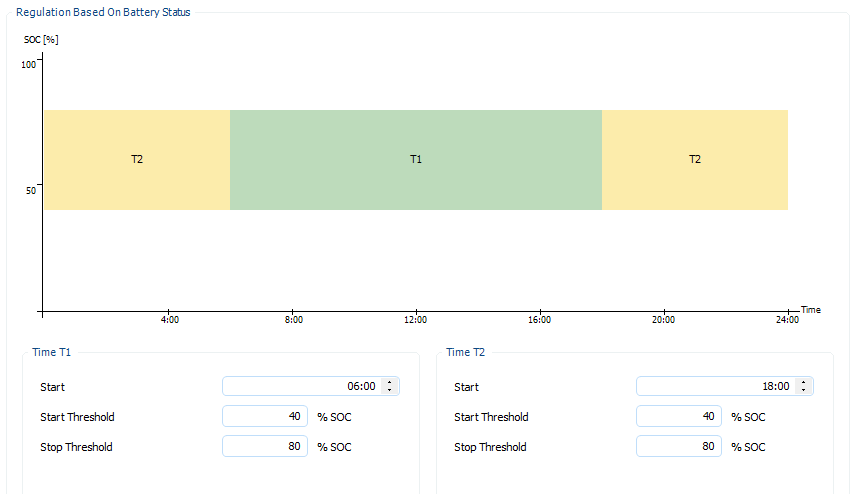
Hi Kristian, I am afraid that this is not possible at the moment. Right now the starting SOC of the batteries in stand alone (offgrid) systems is determined by the average SOC that is roughly to be expected during operation. For that we take the SOC control parameters of the diesel generator: Considering the time and the SOC thresholds we determine an "average" SOC that is used as a starting point. This behaviour was desired by the SMA engineers to avoid untypical system behaviour in the beginning of the simulation (the offgrid simulation part of PV*SOL was design for SMA in the first place, some years ago). But we will put this feature request on our list, thank you. Kind regards, Martin
-
Hi Low Carbon Exchange, thank you for your feedback! We will look into that for the next release. Kind regards, Martin
-
Thanks for the project. For me, this looks fine. The nominal output current of the Enphase inverter is max. 1.5 A (350 W / 230 V), usually it will be far less since you only have the 320 Wp from the module when the irradiance is at 1000 W/m². But even if you have 1.5 A output from the inverter, your ohmic power loss is only about 0.4 W (P = I² x R). The resistance of your cable is 0.18 Ω ( ρ*l/A, 0.018 Ω·mm²/m * 25m / 2.5mm²). So the relative losses on the AC side in your worst case are 0.4 W / 350 W = 0.12 %. In the DC side, you have 9.6 A MPP current (under STC, like above) and a cable resistance of 0.018 Ω·mm²/m * 2m / 4mm² = 0.009 Ω, so a power loss of 0.83 W (or relative 0.83/320 = 0.36%). So, when comparing ohmic losses, be sure to always have an eye on the currents. Cheers, Martin
-
Hi Sander, could you provide us with a project file so that we can investigate your test case better? You can either post it here or send it over by private message. Thanks a lot, Martin
-
Hi Sander, thank you for the post, it is interesting to see that Huawei now also provides power optimizers. From the datasheet and their website it is not clear, however, in which optimizer mode they really operate. See an explanation on the operation modes here: https://help.valentin-software.com/pvsol/2019/calculation/power-optimizer/ To include them into our database, we have to make sure we get the optimizing mode right. I will inform our database team so that they can contact Huawei to ask for more information. In the meanhwile you could either ask them directly or you could just enter the device as a SolarEdge device (full mode), if you want to accept the risk of choosing the wrong optimizing method. Kind regards, Martin
-
Hallo Sepp, ich habe das gerade hier nachvollzogen und kann es leider nicht nachstellen. Das heißt, bei mir ist das Logo auch auf anderen Rechnern als meinem zu sehen. Welche Version von PV*SOL benutzt du denn? Ist das Logo evtl schreibgeschützt oder in einem geschützten Bereich (Netzlaufwerk oä?). Evtl. könnte Abhilfe schaffen, das Logo zuerst auf den Rechner zu kopieren, auf dem auch PV*SOL installiert ist und es dann in den Benutzer-Optionen neu auszuwählen. Über eine kurze Rückmeldung, ob das geholfen hat, würden wir uns sehr freuen. Viele Grüße, Martin
-
Hi João, No, sorry. But you could simulate the 3D environment without tracking, save the shading losses from the results and enter them as a shading percentage of your 2D simulation with tracking system. This will only cover the shading by far objects (homogeneous shading), however. A detailed shading analysis with mutual shading of the trackers for example, is not possible. But if the tracking systems have sufficient distance from each other, this won't be problematic. Hope that helps, kind regards, Martin
-
Hi Tim, thank you for the interesting question. I guess it is neither a real issue nor a limitation of our software If you select SolarEdge power optimizers with inverters of different manufacturers you will get a "warning" from PV*SOL, stating that the optimizers may only be used with inverters from SolarEdge. This is because SolarEdge says so (not sure why), but since it is only a warning in PV*SOL, you can simulate the system anyway. We heard from other planners that they combine SE power optimizers with other inverters as well. But perhaps check again with SolarEdge what their opinion is on that topic. Kind regards, Martin
-
Hi matko89, please only write one post per issue, thank you. This will keep things easier to follow up for you and for us as well. Did you get positive feedback on the deactivation form? If yes and the problem persists, please contact our technical hotline at hotline@valentin-software.com. Kind regards, Martin
-
Hi matko89, did you get positive feedback on the deactivation form? If yes and the problem persists, please contact our technical hotline at hotline@valentin-software.com. Kind regards, Martin
-
Hi João, could you provide us with the project files so that we can analyse the comparison? Without seeing the PV system and the meteo data it is impossible to tell where the difference in PR and yield comes from. Thanks a lot in advance and kind regards, Martin
-
Buenas dias Felipe, let me give an English translation of your Spanish question first: So, the answer would be to try the following work-around: That is: Install the newest version of PV*SOL premium (right now it is 2019 R5) Run it once and close it, so that you find the file PVSOL.ini in this folder: C:\Users\USERNAME\Documents\Valentin EnergieSoftware\PVSOL premium 2019\PVSOL.ini Open it in a text editor and search for the element <MainPagerWider>0</MainPagerWider> Change it to <MainPagerWider>-1</MainPagerWider> and save the file Start PV*SOL premium In Espanol: (Traducción realizada con el traductor www.DeepL.com/Translator) Instalar la última versión de PV*SOL premium (ahora mismo es 2019 R5) Ejecútalo una vez y ciérralo, para que encuentres el archivo PVSOL.ini en esta carpeta: C:\Users\USERNAME\Documents\Valentin EnergieSoftware\PVSOL premium 2019\PVSOL.ini Ábrelo en un editor de texto y busca el elemento <MainPagerWider>0</MainPagerWider>. Cámbielo a <MainPagerWider>-1</MainPagerWider> y guarde el archivo Iniciar PV*SOL premium Hope that helps to finish your project! Martin
-
Hi flak and others, there are no updates, I am sorry. We will keep you posted. Kind regards, Martin
-

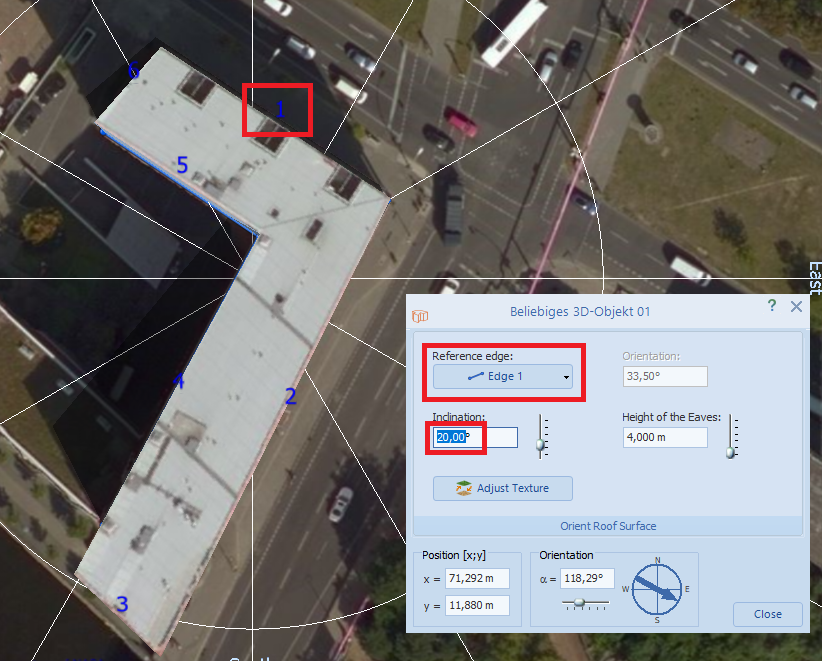
Extruding 3-D objects with inclination from non-rectangular polygons
developer_mh replied to Ricardo's topic in PV*SOL
Hi Ricardo, you can extrude the 3D object from a non-rectangular polygon and apply the inclination afterwards. Just right click on the object, select "Edit", then choose the edge that should act as rotation/inclination axis and enter an inclination value: Hope that helps, kind regards, Martin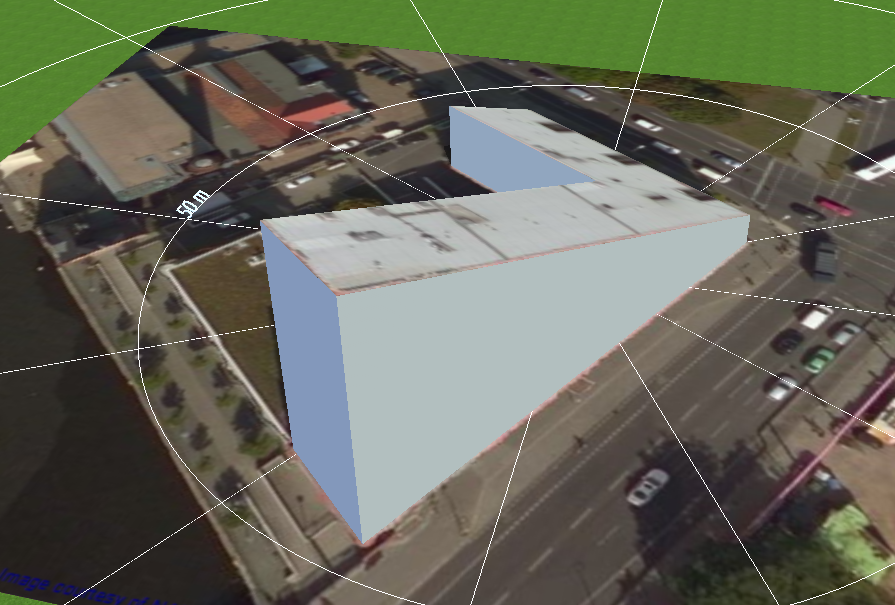
-
Hello cedric, you can install PV*SOL on the new computer, then revoke the serial number on the first computer and enter it in the PV*SOL installation of the new computer. Keep in mind however that you can't swap your license infinitely. You can do this twice a year. After that you will need to use our form "Software Reacitivation Request" here: https://www.valentin-software.com/sites/default/files/downloads/sonstiges/en/request-reactivation.pdf Kind regards, Martin
-
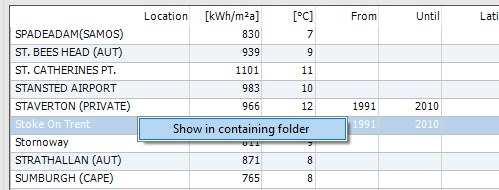
Hi Justin, it seems that you might have some legacy climate data files in your system that are not handled well by MeteoSyn. The fact that you have 4 versions of Stoke on Trent sounds like that this is the problem. I suggest to do the following in order to clean up your climate files: Open the projects where you have Stoke on Trent climate files in and temporarily select another climate location Save these projects Open MeteoSyn by clicking on the world icon next to the location selection: Go to the list view, select one of the Stoke on Trent files, right click and go to the file location In this folder, delete all Stoke on Trent files Go back to MeteoSyn, go to the Options View and select "Update database" Go to list view again and make sure that all Stoke on Trent locations are gone Then re-create a new climate data set the usual way, by clicking on "Create climate data for new location" Now open the project files from 1. again and select the new Stoke on Trent climate file Hope that helps, Martin

-
Hi Justin, when I create the climate file for the location Stoke on Trent in PV*SOL premium 2019 R5, I get an annual sum of global irradiation of 917 kWh/m² (the yield being something different as it describes the electrical energy that the PV plant is generating). Could you send a project file where your Stoke on Trent location with 1017 kWh/m² is included, please? Thanks and kind regards, Martin
-
Hi Justin, climate data were not updated between R4 and R5 of PV*SOL premium 2019, but the database was. Perhaps you use PV modules that were updated by the manufacturers? Kind regards, Martin
-
Hi Giovanni, my Italian is very limited but I understand your request as follows: I will forward this to my colleagues. Kind regards, Martin
-
Hi M.Khalifa, the inverters (and all other products) are entered into our database by the manufacturers. From time to time we will deploy and database update so that new products become available in PV*SOL. In this case, SMA has not yet entered the Tripower 60 and 75 yet. In such cases, please contact our database team at database@valentin-software.com, so that they can ask SMA to enter their new products. But for now I will forward your request to them. Thanks and kind regards, Martin
-
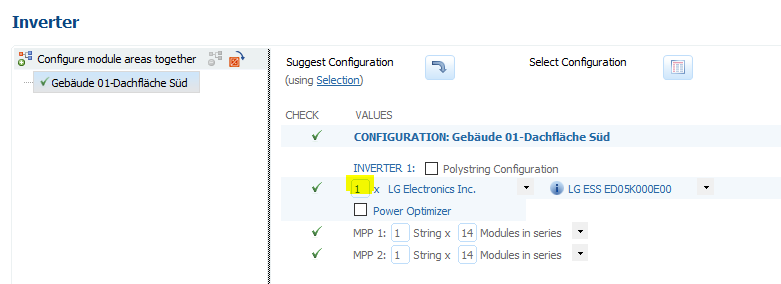
Hi Tim, the problem here is that PV*SOL internally handles the 3 inverters as one unit (actually in your case it should handle them as two units, since 50 modules are not distrubutable evenly on 3 inverters). If you want to connect a DC coupled battery system to a "2 x Inverter xyz" configuration, PV*SOL doesn't know to which of those 2 inverters it should attach the battery system to. That's why the warning 'In case of DC-coupled battery systems, only one inverter should be used in the first configuration' appears. To avoid that, make sure that the first inverter configuration appears only once in your system, like so: But even with this setup you won't be able to connect 3 battery systems with DC coupling to 3 PV inverters. At the moment you can only connect one or more battery systems to one PV inverter. But in general you are right, it should be possible to connect 3 battery systems to 3 PV inverters in the way you described. We will add that to our list of features, thanks for the input. Kind regards, Martin
-
? This is the funniest bug we had in a while! Can you reproduce it by any chance? I mean, could you provide a project file and steps (clicks) that will lead to pink panels? Or maybe green ones Kind regards, Martin
