


developer_mh
-
Posts
1,855 -
Joined
-
Last visited
-
Days Won
173
Everything posted by developer_mh
-
Hi Martin, yes, you could send me the projects to my mail address which I will send you in a minute via private message. Please understand that for me it is a lot easier to explain what is going on if I have the project file, but I will try to give a general explanation. What distinguishes the three different measures "Module-independent shading", "Module-specific Partial Shading" and "Yield Reduction due to Shading" is (roughly) the following. Yield Reduction due to Shading is the result of simulating the whole PV system twice and compare the electrical output of the unshaded PV system with the electrical output of the "real" PV system. We have to simulate twice because the electrical output of a PV system is not proportional to the percentage of shading as this leads to lower module temperatures, lower currents and ohmic losses and so on. Module-independent shading is the minimum percentage of the diffuse irradiation (not direct!) that is not reaching the modules. Imagine it like this: For each module in the PV system we receive a diffuse shading factor from the 3D visualisation. The diffuse shading factor is a geometrical ratio of the portion of the sky dome that is visible to the module. It is 0 if the whole sky dome is visible (no horizon and no other shading objects) and 1 if the module doesn't see anything of the sky. Now we determine the minimum diffuse shading factor that occurs in the PV system and input this in the calculation of the module-independent shading. When we simulate, the diffuse irradiance on the modules is reduced by this factor for each time step. Module-specific Partial Shading is the electrical loss of energy in the modules due to shading of diffuse and direct irradiance. That is, for most of the modules there is a diffuse shading fraction left (except for the one with the lowest shading factor) that has to be taken into account, as well as all the shading of the direct irradiance by the horizon or near objects. In contrast to the first section in the Energy Balance, where we list irradiation energies in kWh/m², the second section lists electrical energies in kWh. Due to the electrical configuration of the modules it can happen that a geometrical direct shading factor of 0.05 leads to an electrical loss of 0.33, if a whole module substring is going down. So that's an important aspect here. Hope that helps... if that doesn't answer your questions fully, please don't hesitate to send me your project files. Kind regards, Martin
-
Hallo samessolar, doch, mit Strg und Mausrad kann man die Vorschau vergrößern und verkleinern. Also Strg-Taste gedrückt halten und dann das Mausrad bewegen (scrollen). Viel Erfolg und beste Grüße, Martin
-
then you can go with my second example, i.e. polystring and "Connect strings in series"
-
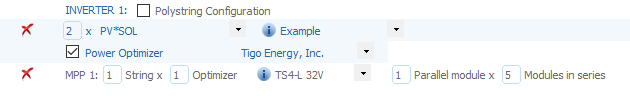
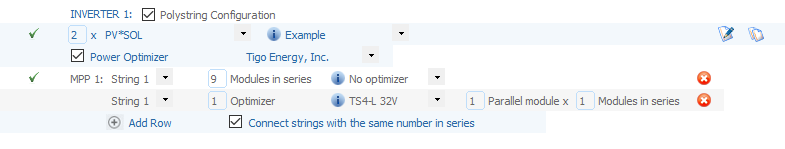
Hi Andrzej, you can connect the power optimizers in any imaginable way. Also only one per string, although this is not recommended. See this configuration for example, where I connect 5 modules in series on one Tigo TS4-L 32V: Keep in mind however, that the Tigo optimizers are not designed for such a configuration. The voltage and current ranges and also the power levels are designed for one module only, perhaps two if you have bad lighting conditions. If you want to configure a string with e.g. 9 modules without and only with power optimizer, you can do the following with the polystring feature: Hope that helps, kind regards, Martin
-
Hi Noé, R3 was released this morning, so if you want, you can update and check if you see the wiring diagram now. If not, we would be very interested on you log file under C:\ProgramData\Valentin EnergieSoftware\log\PVSOLpremium.log Also, in the newest folder that ends with a "T" in your temporary project folder at C:\Users\USERNAME\AppData\Local\Valentin EnergieSoftware\temp\PVSOL premium 2019\ there should be a *.svg and *.pdf file, do you see them? And if you don't mind, it would be helpful if you could send us the dxdiag output, perhaps via private message. You can hit the Windows key, enter "dxdiag" and then "Save all information" and send us the txt file. Thanks a lot for your cooperation again, kind regards, Martin
-

Error: Object reference not set to an instance of an object
developer_mh replied to Ricardo's topic in PV*SOL
Hi Ricardo, yes, the bug is fixed in the upcoming release, PV*SOL premium 2019 R3. Kind regards, Martin -
Hi Martin, could you provide an example project so that we can reproduce the situation? Thanks a lot in advance, kind regards, Martin ps: sorry for answering so late, we are a bit busy with the new release right now..
-
Hi Dennis, the cabling feature is unfortunately not supported for module mountings right now. This is why you can't place anything there. You can use the cabling feature for modules that are placed directly on the roofs (Module Coverage). Kind regards, Martin
-
Hi Noé, I will answer in English, so that everyone else can understand the issue. First, let me rephrase your question in English (translated with deepl.com ) We are aware of the issue, but we can't reproduce it here. In the upcoming bugfix release (2019 R3) it will be possible to create the project report, even if the display of the wiring diagram fails. In order to find out the reason why the wiring plan fails, we would then be happy to receive the log files (after 2019 R3 is released). In the meantime, could you provide some information about your computer? Thanks a lot for your cooperation, kind regards, Martin
-
Error: Object reference not set to an instance of an object
developer_mh replied to Ricardo's topic in PV*SOL
Hi Yvar, we just tested it again and here it works fine. Just ensure that you enable the corresponding option in the panel of the module configuration: Hope it helps, kind regards, Martin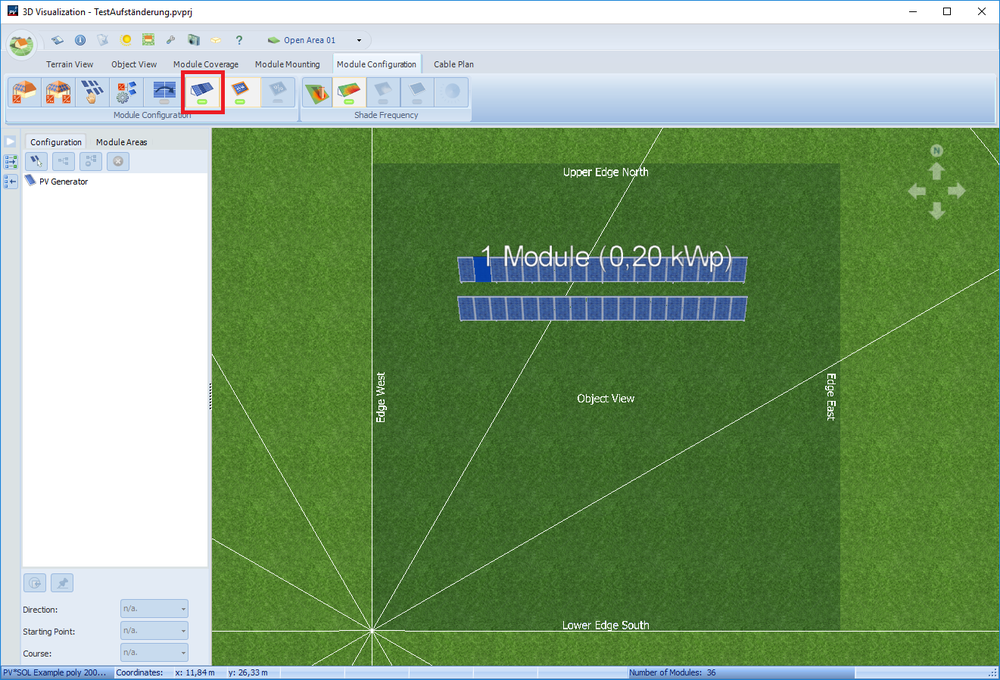
-
Error: Object reference not set to an instance of an object
developer_mh replied to Ricardo's topic in PV*SOL
So, just for the record, and in case that other users have a similar problem: In PV*SOL premium 2019 R2 there is a bug that can occur when you have the following setup: you edit a 3D project were shadows have already been calculated You add more objects in 3D so that the shading calculations are deleted Then you leave 3D, adopt the data to PV*SOL, but you don't recalculate the shadows When you then try to save the file, an error might occur, depending on the inverter configuration you have We will fix this bug in the next release. For now you can save the projects when you calculate the shadows again. Sorry for the inconvenience, Martin -
Error: Object reference not set to an instance of an object
developer_mh replied to Ricardo's topic in PV*SOL
Hi Ricardo, could you send me your log file under C:\ProgramData\Valentin EnergieSoftware\log per private message, please? Thanks a lot in advance, Martin -
Hi Caio, perhaps you could try the following: Install the newest version of PV*SOL premium (right now it is 2018 R10, soon it will be 2019 R1) Run it once and close it, so that you find the file PVSOL.ini in this folder: C:\Users\USERNAME\Documents\Valentin EnergieSoftware\PVSOL premium 2019\PVSOL.ini Open it in a text editor and search for the element <MainPagerWider>0</MainPagerWider> Change it to <MainPagerWider>-1</MainPagerWider> and save the file Start PV*SOL premium Could you tell us if your menu bars are visible now in the 3D visualisation? Thanks a lot and sorry for the inconvenience caused, Martin
-
Hi Christian, du kannst ganz einfach Text-Dateien importieren, schau mal hier: https://help.valentin-software.com/pvsol/2018/navigationsseiten/verbrauch/ Viele Grüße, Martin
-
Ja, aber auch Polysun kann derzeit nur die Daten von Meteonorm 7.2 haben, nur um das nochmal klarzustellen. Der Unterschied in den Erträgen rührt dann von der Verwendung unterschiedlicher Datenquellen her, also DWD vs Meteonorm 7.2. Um auch in PV*SOL die Daten von Meteonorm 7.2 für deutsche Standorte zu verwenden, sollten sie in Meteosyn interpoliert werden. Grüße! Martin
-
Hallo Sonnenpower, Messwerte liegen natürlich beim DWD in aktuelleren Zeiträumen vor. Was wir in PV*SOL verwenden, sind aber ja typische meteorologische Jahre, die aus mehreren Messjahren kompiliert werden. Dazu wird auch nochmal mehr erklärt in den Hilfeseiten: https://help.valentin-software.com/pvsol/2018/berechnungsgrundlagen/einstrahlung/klimadaten/#was-sind-klimadatens%C3%A4tze-was-bedeutet-typical-mean-year Bei der Interpolation neuer Standorte werden immer die Meteonorm-Datensätze verwendet! Das heißt, wenn du jetzt einen neuen Standort durch Interpolation erzeugst, werden nicht die sonst sichtbaren DWD-Daten verwendet, weswegen sich die Globalstrahlungssummen dann auch unterscheiden können. Ein Spanier hatte neulich schon mal eine ähnliche Frage, vielleicht hilft dir das auch nochmal weiter: Viele Grüße! Martin
-
Hallo sonnenpower! Die Daten, die wir momentan in PV*SOL integriert haben, stammen aus MeteoNorm 7.2, sind also bis zum Erscheinen der neuen Version 7.3 die aktuellsten. Wir haben zusätzlich für einige Länder noch weitere Daten hinzugefügt, die nich aus MeteoNorm stammen, siehe hier: https://help.valentin-software.com/pvsol/2018/berechnungsgrundlagen/einstrahlung/klimadaten/ Für Deutschland sind das die Daten vom DWD, wie du ja auch geschrieben hattest. Diese liegen uns nur für den Mittelungszeitraum 1981 bis 2010 vor. Wenn Sie aktuellere Daten haben, würden wir uns sehr über einen Hinweis freuen! Neue Standorte können Sie ganz einfach selbst erzeugen, entweder aus interpolierten MeteoNorm-Daten (die dann wahrscheinlich ähnliche Strahlungswerte wie in Polysun aufweisen), oder aus eigenen Messwerten, z.B. aktuelleren DWD-Daten. Mehr dazu hier: https://help.valentin-software.com/pvsol/2018/navigationsseiten/anlagenartklimaundnetz/meteosyn/ Viel Erfolg und beste Grüße, Martin
-
Hi Cesar, we had several customers with this bug. Unfortunately we still haven't identied the real source of the problem. But in PV*SOL premium 2018 R10 we added some UI enhancements that should minimize the impact of this bug. Which version are you using. And when you say " Few weeks ago everithing was working fine. " could you tell us what happened in the meanwhile? Did you update PV*SOL, oder Windows? Or some graphics drivers perhaps? Every information is helpful! Thanks a lot, kind regards, Martin
-
Hi Kamil, I think the problem here is that the one module under the roof which has 100% direct shading perhaps isn't considered correctly regarding the diffuse shading, which should also be 100%. Could you send me the project file? But in general, what happens if you have a string connection like the above is that all modules are forced down to the i v curve from the diffuse irradiance, which is not 0. This is why you don't get 0 kWh output. All bypass diodes of the shaded module would be active so that you loose a bit additional energy (current from the other modules * diode voltage), but you'll still get energy out of the string. You can also have a look here: https://help.valentin-software.com/pvsol/2018/calculation/pv-field/ Hope that helps, kind regards. Martin
-
Hello Anders, good point. We will contact the manufacturer and see if they can provide us with the technological details that we need to simulate these batteries. Thanks for the input! Martin
-
Hi Dmytro, please contact our sales team at sales@valentin-software.com, with your customer number and serial number. They will be able to help you out. To avoid that situation in future, it would be good if you deregister your PV*SOL before reinstalling windows. Kind regards, Martin
-
Hallo Felix, ja, das wäre momentan die einzige Möglichkeit, auch wenn sie etwas unsauber ist. Die 20% für die Modul-Verschmutzung bewirken, dass die Einstrahlung im gesamten Januar zu jedem Zeitpunkt um 20% gemindert wird. Was man eigentlich bräuchte, wäre ja eine Möglichkeit, die Einstrahlung an 6 der 31 Tagen um 100% zu mindern. Aber das geht leider derzeit nicht auf komfortable Weise. Die umständlichere Variante wäre, die Klimadaten zu exportieren, dann z.B. in Excel die Einstrahlung an 6 Tagen auf 0 zu setzen, daraus wieder eine importierbare Klimadatei zu erzeugen und sie dann in MeteoSyn zu importieren. Beste Grüße, Martin
-
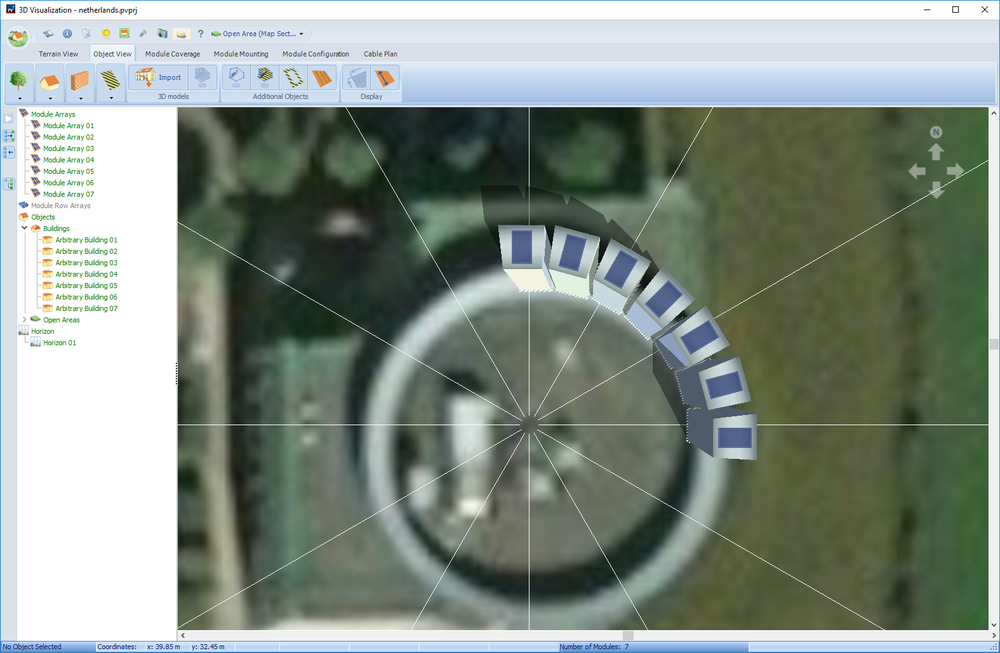
Hi Dennis, This is a tricky project you have there! Unfortunately you can't rotate the modules directly, you can just rotate buildings with modules on them. So in this case you would have to create small segments of the outer circle, place a module there and then copy and rotate until you get the full circle. Here's a quick sketch: of course the segments must be more precise. Does this help? I know it is a bit cumbersome, but at least it is possible Good luck and kind regards, Martin
-
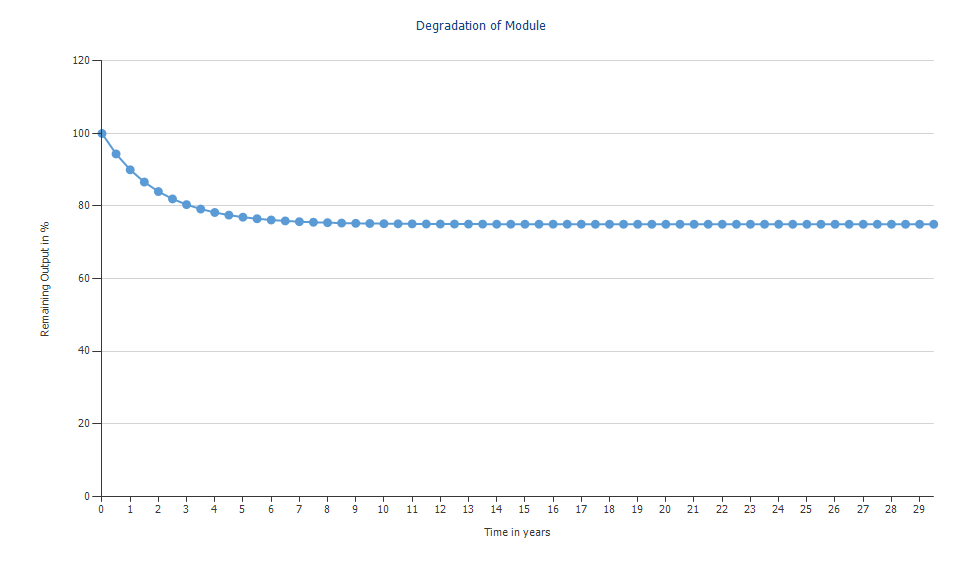
Hi Stuart, Then you could copy the values from the diagram perhaps. But the numbers there represent full calendar years, so there might be differences if your start of operation is not January 01. Additionally there is the difference between the grid feed-in and the PV energy (AC) even when you don't have electrical appliances as the inverters have some own consumption during night. Also consider that you don't start with 97% module power if you enter a degradation of 97% for the first year. You start with 100% and the module power will reduce to 97% in the first year as displayed in the diagram as well: Perhaps I should give an example. I have a standard PV system with consumer, module degradation is shown as above, start of operation is January 01. From the Energy balance: PV energy (AC) as simulated without module degradation is 3537.69 kWh Grid feed-in (i.e. minus the standby consumption of -0.79 kWh), also without module degradation is 3538.48 kWh From the simulation results: Grid feed-in in the first year is 3479 kWh note that 3479 / 3538 = 0.983, which is more than the 97% because you only reach the 97% in the end of the first year From the diagram 'PV energy during observation period' PV energy AC in the first year is 3477.9 kWh (taken from the first bar in that bar chart) this is slightly less due to the standby consumption of the inverter So, I guess what you want are the numbers from the bar chart 'PV energy during observation period', right? You could copy them by right clicking on the chart. If you have any further questions, please let me know! Kind regards, Martin
-
Hi Dennis, If you use a 3-phase inverter, we consider the electrical appliances to be equally distributed over the three phases, so in this case yu don't have to do anything special. Kind regards, Martin

