-
Posts
1,855 -
Joined
-
Last visited
-
Days Won
173
Everything posted by developer_mh
-

DC-link coupling in a Off-grid PV system with auxiliary generator
developer_mh replied to Juan Antonio's topic in PV*SOL
Hi Juan, sorry for the late answer. Somehow I overaw this question.. right now it is not possible to simulate an offgrid system with DC coupled batteries, I am afraid. The offgrid logic that we implemented is based on the SMA products, so there is no DC option, sorry. Kind regards, Martin -
Hi b_yilmaz, yes, you can achieve this by using the polystring feature. You can combine any thinkable configuration of modules together. https://help.valentin-software.com/pvsol/2019/pages/inverters/polystring-connection/ Hope that helps, kind regards, Martin
-
Hi Alex, yes, it is true, this option is missing right now. We will consider it for future versions. Right now you can export the project report as Word file and then add the desired graph manually. You can save all diagrams in PV*SOL by right clicking on them. Hope that helps for the moment, thanks for your feedback. Martin
-
Hi Alexclavijon, in order to debug this, it would be helpful if you could provide some more information. Which version of PV*SOL are you using? Can you send the log file "PVSOLpremium.log" ? It is located under C:\ProgramData\Valentin EnergieSoftware\log Thanks and kind regards, Martin
-
Hi RobS, here you can find more information on how to set P90 parameters: https://help.valentin-software.com/pvsol/2019/pages/financial-analysis/bankability-p50p90/ Please note that this option is only available for full feed-in PV systems. That is, if you have electrical appliances in your system, you won't see the P90 option. Kind regards, Martin
-
Hallo FXR, diese Einstellung kann beim AC-Netz vorgenommen werden: https://help.valentin-software.com/pvsol/2019/navigationsseiten/anlagenartklimaundnetz/#ac-netz Beste Grüße, Martin
-
Hi Lucija, there is some other process that is accessing our temp folders under C:\Users\EnercoSolardooEnerco\AppData\Local\Valentin EnergieSoftware\Temp\PVSOL premium 2019\ Please check if you can add an exception rule in your antivirus software so that this directory is not touched. Firstly, you can also close PV*SOL and delete all files and folders inside this temp folder. Kind regards, Martin
-
Hi Lucija, it seems that the problem occurs when you click on the IV curves tab in the PV module dialog. I can see that another process is accessing a file that we need to show the IV curves, that is why it crashes. One option would be to find out which process is accessing the file (e.g. an antivirus software?). Another option would be not to click on that IV curves tab when creating new modules. Kind regards, Martin
-
Hallo Mario, Negativwerte für Verbraucher gehen nicht, da hast du Recht. Mir ist aber ehrlich gesagt noch nicht ganz klar, welche Daten vorliegen, und was aus der Simulation mit der Altanlage herauskommen soll. Es gibt die Produktionswerte der alten PV in 15-Minuten Auflösung und den Jahresverbrauch des Haushalts, also ein Wert für ein Jahr? Ist dieser Jahresverbrauch abhängig von der PV-Produktion der Alt-Anlage? Beste Grüße, Martin
-
Hi Lucija, could you send the error report using the dialog you showed here? If you type in your name into the textbox "Where possible, please describe ...", I can see which error report was yours. Thanks a lot, kind regards, Martin
-
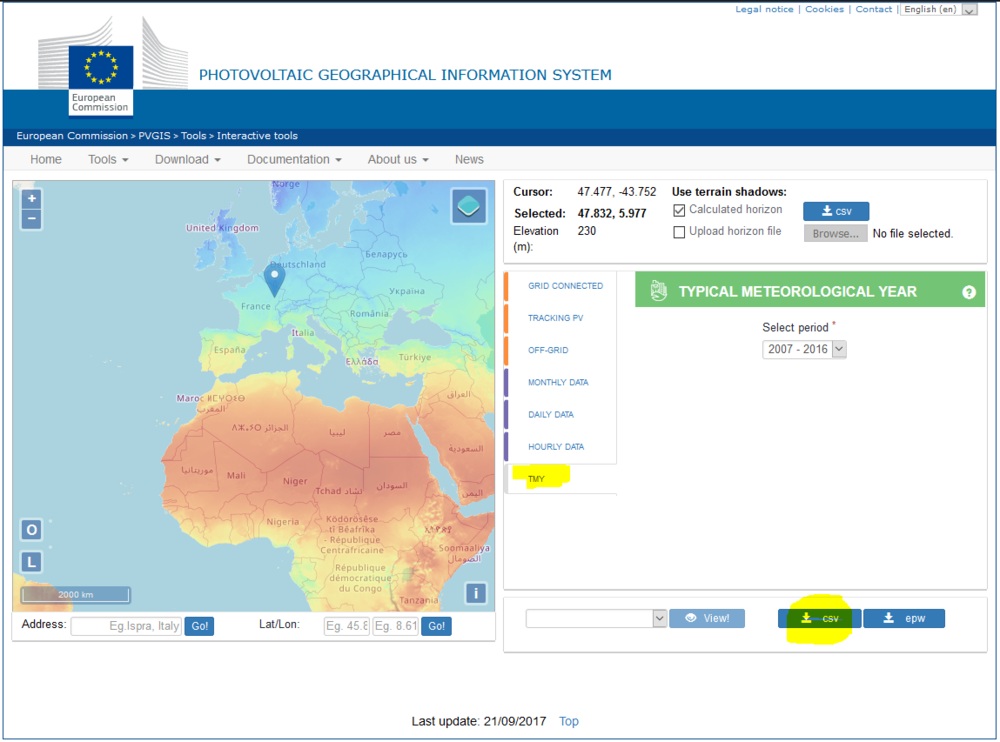
Hi Patrik, we would recommend to get the TMY data from PVGIS, this would be the most reasonable option to simulate a PV system: You can then transform the *.csv file into a *.dat file that you can import into PV*SOL, following these instructions here: https://help.valentin-software.com/pvsol/2019/pages/system-type-climate-and-grid/meteosyn/#create-new-location Unfortunately, you can't import longer periods than one year. If you want to simulate real years, you would have to import one *.dat file for each year and then simulate them separately. Hope that helps! Martin
-
Thank you, Vishnu, for answering!
-
Hi Vishnu, You are right, a module without reflection losses doesn't exist. And to our present knowledge it can't exist in future. The PV module data is entered into our database by the manufacturers, so they are responsible to provide the correct values. Or provide the values that represent their module in the best way possible. We calculate the reflection losses in dependance of the angle of incidence: https://help.valentin-software.com/pvsol/2019/calculation/pv-modules/reflection-in-module-plane/ Kind regards, Martin
-
Hi Vishnu, the first result that you show is the energy yield according to EnEV (German Standard "Energieeinspeiseverordnung") and is calculated with the (simple) formulas given in the standard. https://help.valentin-software.com/pvsol/2019/pages/results/energy-yield-for-enev/ The second result is the energy balance that is an output from our simulation core. https://help.valentin-software.com/pvsol/2019/pages/results/energy-balance/ So, if you want to have a "Nachweis" for the German EnEV, take the first results. If you want to have a detailed and validated simulation of your PV plant, take the second Kind regards, Martin
-
Hi Vishnu, we calculate the impact of the shading down to substring level. You can read more on that topic here: https://help.valentin-software.com/pvsol/2019/calculation/pv-modules/shading-due-to-nearby-objects/ We consider the diffuse shading to be equally distributed over one module. But we calculate it separately for each module, so the mismatching effects that you mention are taken care of in our simulation. Kind regards, Martin
-
Hi Peter, if you want to connect several module areas together to one inverter, please have a look here: There is also a link to a post where this question is answered. Hope that helps, kind regards, Martin
- 7 replies
-
- poweroptimizer
- e3/dc
-
(and 1 more)
Tagged with:
-

Convert weather data file to .DAT or other for PVSOL
developer_mh replied to UserPV's topic in PV*SOL
Hi UserPV, here is a description of how the data has to be formatted: https://help.valentin-software.com/pvsol/2019/pages/system-type-climate-and-grid/meteosyn/#options Hope that helps, kind regards, Martin -
Hi Vishnu, the battery charge from the grid occurs when the battery management (charging strategy) requires a full or equalization charge in situations where the PV can't provide sufficient energy. Here you find more info on that topic: https://help.valentin-software.com/pvsol/2019/calculation/battery-systems/charging-plans/ You can set the duration of these charging modes to 0 to disable them (in the 2nd example the equalization mode is disabled): https://help.valentin-software.com/pvsol/2019/pages/battery-system/charging-strategy/ Hope that helps, kind regards, Martin
-
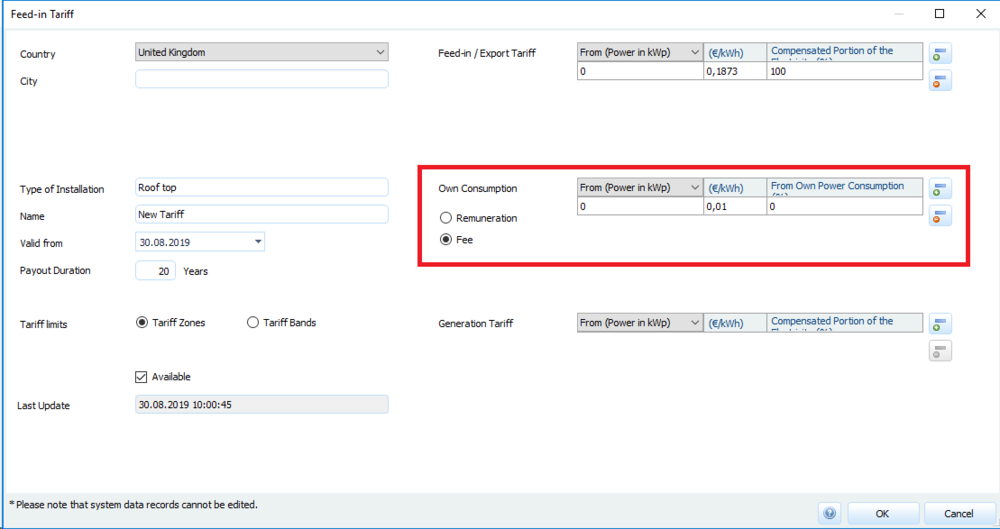
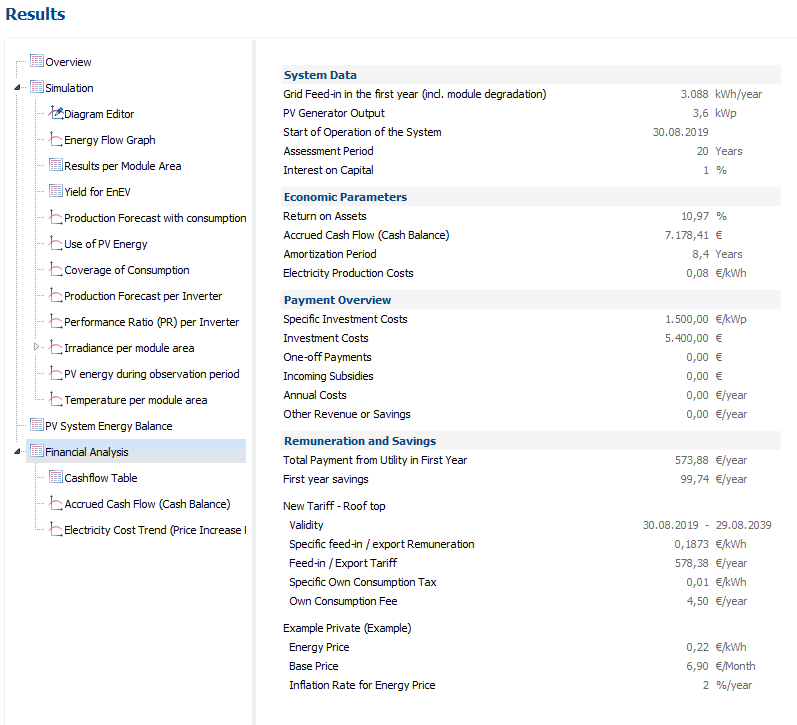
Hi Tim, what you describe is a common use case for PV systems. You have a feed-in tariff that remunerates the energy that your system injects into the grid. You have a consumption tariff that you have to pay for every kWh that you draw from the grid. And then you have the "own consumption" when you can supply your electrical applications with the PV energy from your roof. Normally, the own consumption is free (and it should be, like you don't have to pay for the tomatoes that you grow in your garden), except for Germany, where you have to pay for that, too. But these are political discussions. But for these reasons, you can also enter a fee (and also a remuneration) for own consumption in the tariffs: In the results you then have all three assets: You will also find these results in the project report. Kind regards, Martin
-
Hi Remu, a deletion of the climate data sets from the list is not possible, I am afraid. But what you see is only meta data of the available locations, so all these data sets don't take space on your hard drive. Only if you see a file name in the last column there is a real climate data file on your system. Kind regards, Martin
-
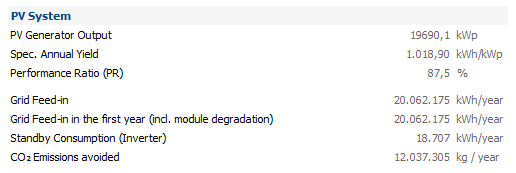
Hi UserPV, in the case of the example project "Solar Park Neuhardenberg incl P90", we have module degradation as well as P50/P90 analysis. See these topics for more information: https://help.valentin-software.com/pvsol/2019/pages/financial-analysis/bankability-p50p90/ https://help.valentin-software.com/pvsol/2019/pages/pv-modules/module-degradation/ These two factors effect the amount of energy that is fed into the grid in the first year. If you set the P50/P90 bankability to 50 and the module degradation to 100% (no degradation), then hese two numbers are equal: You can play around with the factors to see how they influence the results. Kind regards and good luck, Martin
-
Hallo Villamizar, der Lastabwurf ist nur bei Offgrid-Projekten (Anlagenart netzautark mit oder ohne Diesel-Generator) verfügbar. Kannst du genauer beschreiben, wie das Energie-Konzept mit Net-Metering und Batterie-Speicher "im Sinne des Lastabwurfs" aussehen soll? Vielleicht finden wir eine Lösung. Beste Grüße, Martin
-
Freut mich, dass du die Lösung dann noch gefunden hast. Beste Grüße, Martin
-
Hi UserPV, could you provide an example project file so that we can take a look at it? Thanks a lot, kind regards, Martin
-
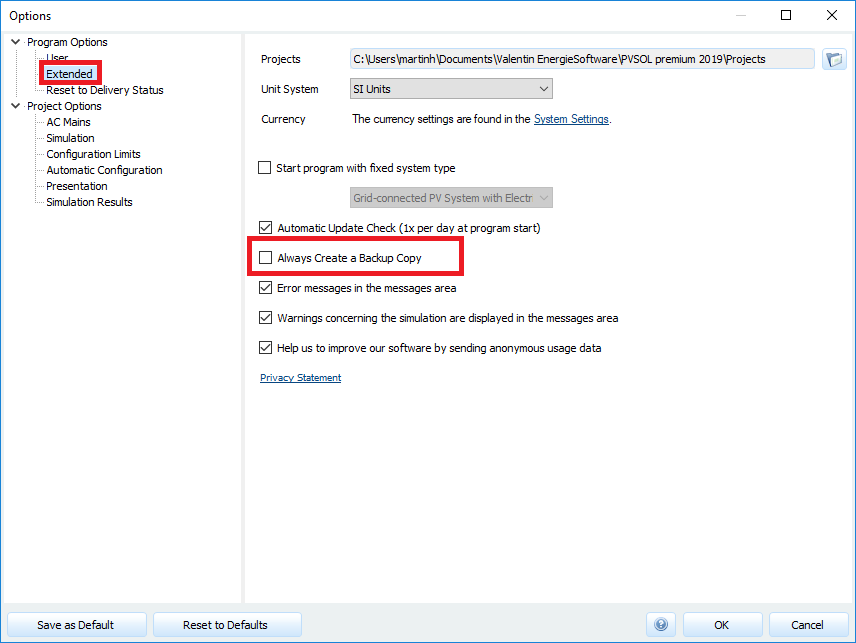
Hi Andrei, that would be here in the program options: Also refer to these pages for more information: https://help.valentin-software.com/pvsol/2019/options/ Kind regards, Martin


