developer_mh
-
Posts
1,860 -
Joined
-
Last visited
-
Days Won
173
Everything posted by developer_mh
-
Dear Flavio, thank you for your log file. Unfortunately it doesn't contain any information related to your problem, so I guess the error occurs outside of PV*SOL. Do you have a firewall, that blocks certain URLs from being loaded, perhaps? Could you check if you can reach these URLs, please? https://www.openstreetmap.org http://www.bing.com/maps http://maps.google.com Also note that bing and google use the http protocol, not https, so perhaps this might be the reason. Perhaps your network is blocking http (without s) requests? Kind regards, Martin
-
I hope not, since PV*SOL doesn't require administrator rights.
-
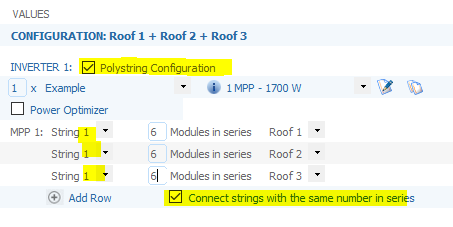
Dear Remu, yes, if you click "Add Row" below your first string, you can add a row for each module area (for each roof). Then select "Connect strings in series". Then all rows with the same string number will be connected into one electrical string. Hope that helps, kind regards, Martin
- 1 reply
-
- 1
-

-
Dear Flavio, could you send us your log files, please? You can find them under C:\ProgramData\Valentin EnergieSoftware\log Please send the file named "PVSOLpremium.log" via private message here in the forum, perhaps we can see something there. Kind regards, Martin
-

Trina Tallmax TSM-DE15M(II) 400W and Jinko Cheetah HC JKM340M-60H-V
developer_mh replied to Daniel's topic in PV*SOL
side note: we recently overhauled our whole database eco system, and as a side effect we now have a website where you can see the current state of our database and what modules are available: https://pvsol-database.valentin-software.com/ Current list of Jinko modules for example: https://pvsol-database.valentin-software.com/Products?productType=PvModules&areUnavailableProductsVisible=False&selectedCompany=f13d5c09-e3c6-4980-8593-f748363117d0 These new databases will be connected to PV*SOL from the next major version on. Kind regards, Martin -
Trina Tallmax TSM-DE15M(II) 400W and Jinko Cheetah HC JKM340M-60H-V
developer_mh replied to Daniel's topic in PV*SOL
Hi Daniel, thank you for reporting these missing modules. In general, the manufacturers are responsible for entering their modules into our database, so we will inform them that there are modules missing. You can also write directly to our database team at database@valentin-software.com if you want to report missing products. Kind regards, Martin -
Hello Jo, [this is a translated version of my German answer] I am aware that you are probably hoping for feedback from other planners, but here is my (preferably neutral) assessment of the topic of large PV plants in PV*SOL. In my answer I would like to distinguish between the 3D mode in PV*SOL and the non-3D mode (manual planning). In both cases there are detailed results on electrical and economic aspects of the system, configurable circuit diagrams and much more. 3D Mode + Very good visualization of the system (any module tables can be configured, surrounding shading objects, horizon line etc) + very powerful shading simulation (row-to-row shading, electrical influence of shadows down to module substring level) + Clear visualization and editing function for the electrical wiring + configuration/string plans - Limitation to 7500 modules (equals to about 2.3 MW at 300 W per module) - No cable diagram for mounted systems 2D mode + unlimited number of modules and module areas + shorter simulation times - No detailed calculation of shading (shading values can only be entered as a percentage, but the horizon line works) - Wiring is not as clearly displayed as in 3D So much for my pro/con list. I am curious what the other users say. As far as the limitation of the number of modules in 3D is concerned, a feasible work-around (which we know many users also use) would be to divide the system into several individual systems and then plan them separately. You can also use 3D planning to determine the reduction in yield due to shading using an example plant, and then transfer this as a percentage value into the 2D planning. I hope that this helps for the time being, best regards, Martin ps: PV*SOL is available free of charge for 30 days with a full range of functions for testing, so just give it a try
-
Hallo Jo, ich bin mir bewusst, dass du wahrscheinlich vor allem auf Rückmeldungen von anderen Planern hoffst, aber hier schon mal meine (möglichst neutrale) Einschätzung zu dem Thema Freiflächen in PV*SOL. Hierbei würde ich in meiner Antwort gerne unterscheiden zwischen dem 3D Modus in PV*SOL und dem nicht-3D-Modus (manuelle Planung). In beiden Fällen gibt es detaillierte Ergebnisse zu elektrischen und wirtschaftlichen Aspekten der Anlage, konfigurierbare Schaltpläne und vieles mehr. 3D-Modus + sehr gute Visualisierung der Anlage (beliebige Modultische konfigurierbar, umliegende Verschattungsobjekte, Horizontlinie etc) + sehr leistungsstarke Abschattungssimulation (Reihen-Abschattung, elektrischer Einfluss der Schatten bis auf Modul-Substring-Ebene) + übersichtliche Visualisierung und Editierfunktion für die elektrische Verschaltung + Belegungs- /Strangpläne - Beschränkung auf 7500 Module (macht bei 300 W pro Modul etwa 2,3 MW) - Kein Kabelplan für aufgeständerte Anlage 2D-Modus + unbeschränkte Anzahl von Modulen und Modulflächen + kürzere Simulationszeiten - keine detaillierte Abschattungsberechnung (Abschattungswerte nur pauschal eingebbar, Horizontlinie geht aber) - Verschaltung wird nicht so übersichtlich dargestellt wie in 3D Soweit meine Pro/Kontra-Liste. Ich bin gespannt, was die anderen User so sagen. Was die Beschränkung der Modulanzahl in 3D angeht, wäre ein gangbarer Work-Around (den unseres Wissens auch viele Nutzer anwenden), die Anlage in mehrere Einzel-Anlagen aufzuteilen und diese dann separat zu planen. Man kann sich auch mit einer 3D-Planung die Ertragsminderung durch Abschattung anhand einer Beispiel-Anlage ermitteln, und diese dann als Pronzentwert in die 2D-Planung übernehmen. Ich hoffe, das hilft erstmal weiter, beste Grüße, Martin ps: PV*SOL gibt es ja 30 Tage kostenlos mit vollem Funktionsumfang zum Testen, also einfach mal ausprobieren
-
Hi Robert, the error message indicates that the file is locked by your file system. The reason might be that it is opened in another application, or that it is located on a network drive where PV*SOL doesn't have access. Try to copy your values in a txt file and place it on your desktop. Close all programs that possibly have a finger on this file (including other instances of PV*SOL), and then try to import again. Kind regards, Martin
-
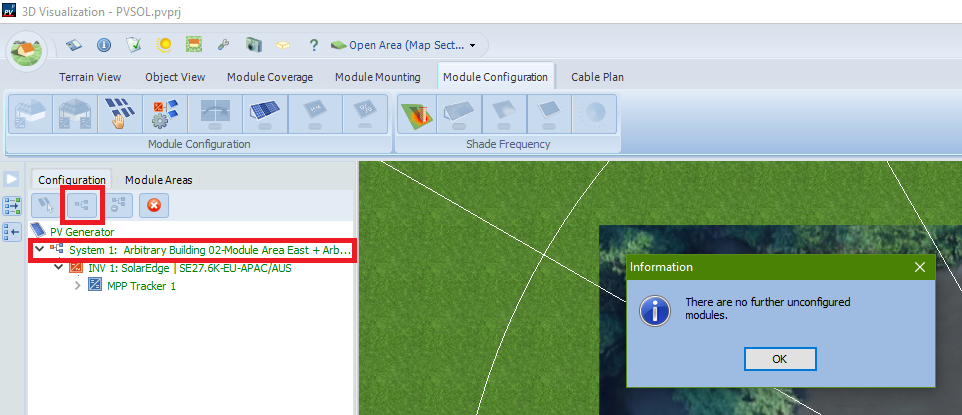
Dear Remu, you can view and edit the configuration when you select the tree view node named "System 1: Arbitrary [...]" and then click "Edit Configuration": Kind regards, Martin
-
Hi, there is no need to wait, as you get the next updates for free anyway. When you buy PV*SOL, there is a 6 month maintance service already included, so you get all updates that are published in this period. Kind regards, Martin
-
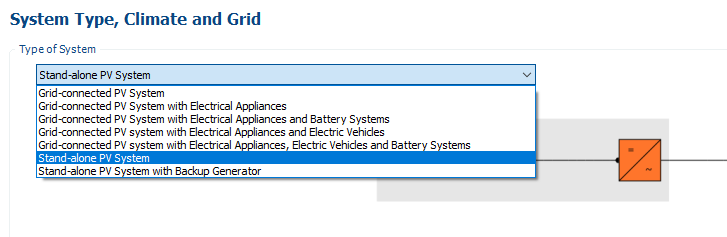
Dear mmakatri, if you don't have a grid, i.e. a "stand-alone" (or "offgrid") system, the only two system types that you can use are the last two from the list: For stand-alone systems, we don't have DC/DC coupled battery systems at the moment, I am afraid. But you can do the following to approximate your system: Set the grid voltage to your DC bus voltage (12 V or 24 V, or whatever you use in your system) Also set the mains voltage of the PV and the battery inverter to the same voltage modify the DC/AC efficiency of the PV inverter and the AC/DC efficiency of the battery inverter so that the "PV to battery" , the "battery to load" and the PV to load" energy paths are met as precisely as possible On the cabling page, just set the cable lengths of the AC side as your DC bus cables The results will be very close to a real DC coupled offgrid battery-PV system. Hope that helps, kind regards, Martin
-
Dear João, the best format would be *.obj. The speed of the shading simulation is not affected by the original file input, that is correct. Kind regards, Martin
-
Hi, we plan to release PV*SOL premium 2020 R1 in January, so this month. You can expect it in the days from Jan 21 on. We are now in the finalizing phase, and so far all goes according to plan. The feature list will be published together with the release I don't want to spoil the surprise here.. Kind regards, Martin
-
Dear João, now we are back in the office with almost all team members, so you can expect the answers to your questions in the near future. Please understand that - although we are a company that sells software in nearly all countries of the world - we are not able to maintain full support over christmas and new year, simply because our team size is not large enough. Thank you for your understanding and a happy new year to you nonetheless, Martin
-
Dear mmakatri, I am not sure if I understand your question correctly. What do you mean by "what about the converter"? Kind regards, Martin
-
Dear Tim, the level of detail for the cable losses (and other result series) is at MPP tracker level, so right now it is not possible to see the results per string if multiple strings are connected to one tracker. Kind regards, Martin
-
Dear Vishnu, adding an investment that comes into effect after x years after the start of the calculation period is not possible at the moment. We have this feature request on our list, but at the moment we can't give you details about the schedule, I am sorry. Kind regards, Martin
- 1 reply
-
- 1
-

-
Hello mmakatri, on the page "System, Climate and Grid", choose the System Type "Grid-Connected PV System with Electrical Appliances and Battery Systems". Then you can select battery systems on the Battery Systems page. There are three types of systems, as described here: https://help.valentin-software.com/pvsol/2019/calculation/battery-systems/#type-of-coupling Yours would be a "DC intermediate" or "DC-link" coupling. Hope that helps, kind regards, Martin

-
Hi Antonio, you can have a look at our help pages, a good starting point would be here: https://help.valentin-software.com/pvsol/2019/pages/presentation/ You can also use the search function to search for specific parameters. If you find parameters that are not explained in the help pages, please let us know. Kind regards, Martin
-
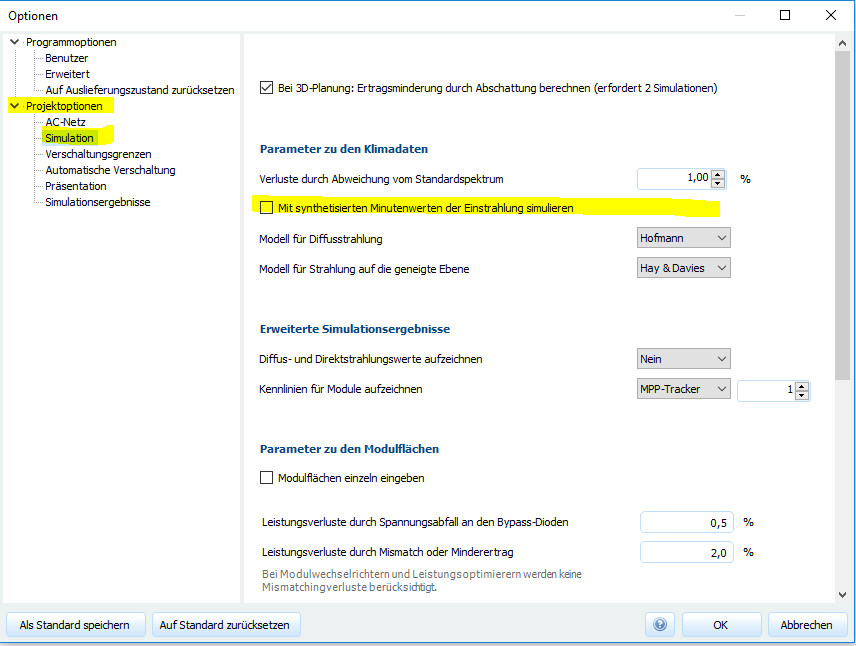
Hallo Sonnenstrom Pöppl, um die Abregelungseffekte möglichst realistisch einschätzen zu können, empfiehlt es sich immer, mit Minutenwerten der Solarstrahlung zu rechnen. Mit Stundenwerten wird der energetische Verlust durch die Wechselrichter-Abregelung unterschätzt. Die Verwendung von Minutenwerten kann unter Optionen -> Projektoptionen -> Simulation eingestellt werden: Generell hängt die Höhe der Abregelungsverluste von vielen Faktoren ab. Die Ausrichtung der Anlage ist sicherlich ein wichtiger Faktor, ja. Sehr wichtig ist z.B. auch der Dimensionierungsfaktor der Anlage, also das Verhältnis von DC Nennleistung der PV Module zur AC Leistung des Wechselrichters. Je größer der Dimensionierungsfaktor, desto höher auch die Abregelungsverluste. Beste Grüße, Martin
-
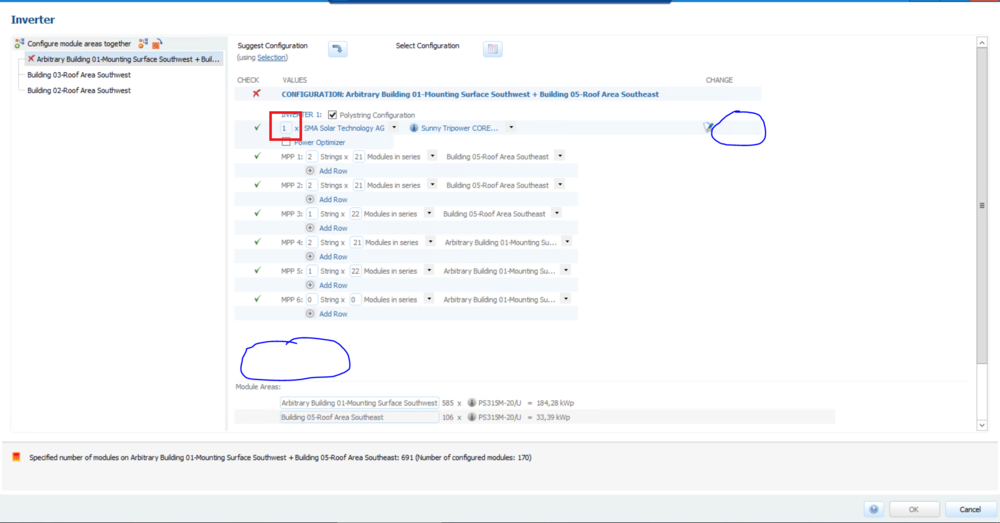
Hi Robin, no, I am afraid that is not possible. You can have more than 1 inverter configuration for two combined module areas, but they have to be identical. In this case you can enter a number greater than 1 in the first field here: But I guess that this will not solve your problem. Right now, there is no other possibility, sorry. Kind regards, Martin
-
Hi Robin, you are not doing something wrong, and it is not a bug, it is just a missing feature. But I am glad to be able to announce this feature for the next major release PV*SOL premium 2020 R1. We will publish it in January 2020 if all goes according to plan. Kind regards, Martin
-
Moduldegradationswerte gehen immer auf 100% zurück
developer_mh replied to ojsolar's topic in PV*SOL
Hallo ojsolar, ja, wir sind uns dessen bewusst. Der Fehler hätte in der aktuellen Version schon gefixt sein sollen, ist er aber nicht. Eine Lösung ist auf dem Weg. Wir möchten uns für die Unannehmlichkeiten entschuldigen. Beste Grüße, Martin -
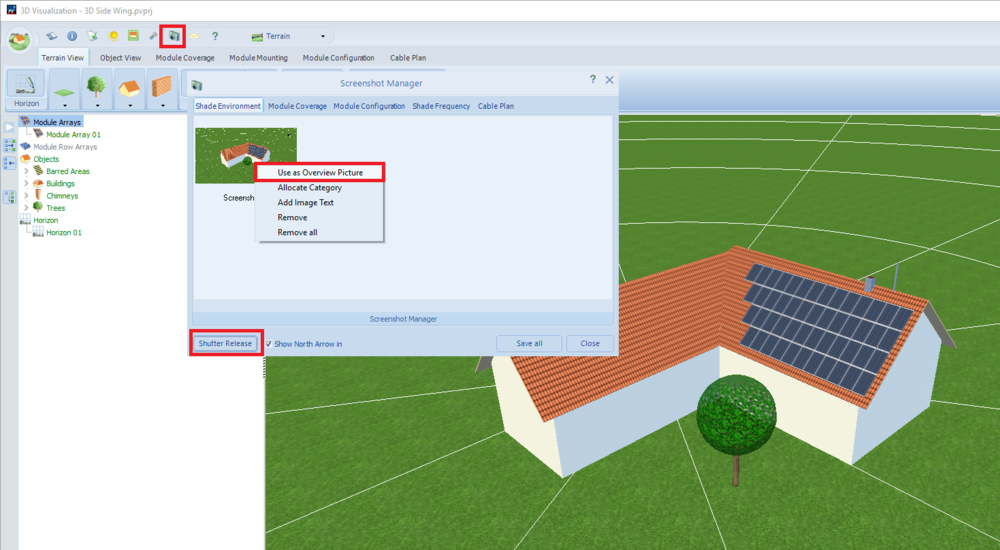
Hi Alex, yes, I can confirm that in some cases the camera doesn't catch the whole system. My recommendation would be to use the screenshot manager to define your own project overview. Hope that helps, kind regards, Martin