


developer_mh
-
Posts
1,860 -
Joined
-
Last visited
-
Days Won
173
Everything posted by developer_mh
-
Dear Sarah, these kind of systems are currently not supported in PV*SOL, I am afraid. We have this topic already on our list, but I can't tell a date for the release right now. Kind regards, Martin
-
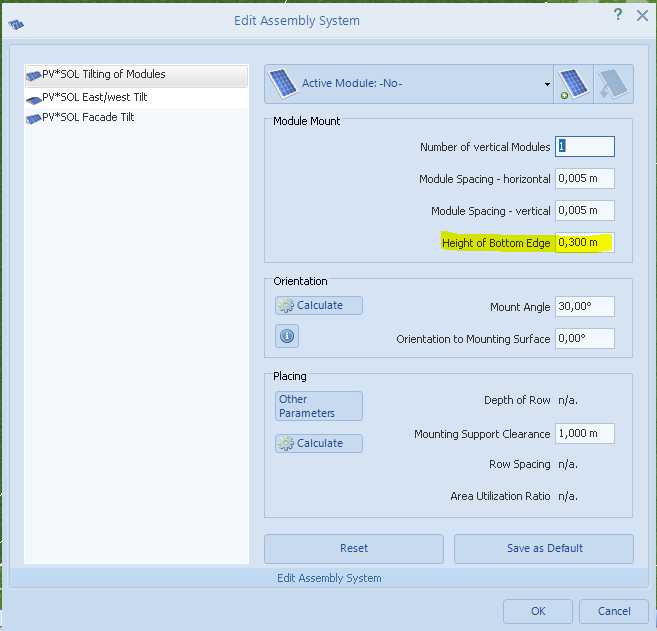
Dear Waqar, you can define the height of the mounting structure here: This dialog pops up when you create a new module mounting system. Hope that helps, kind regards, Martin
-
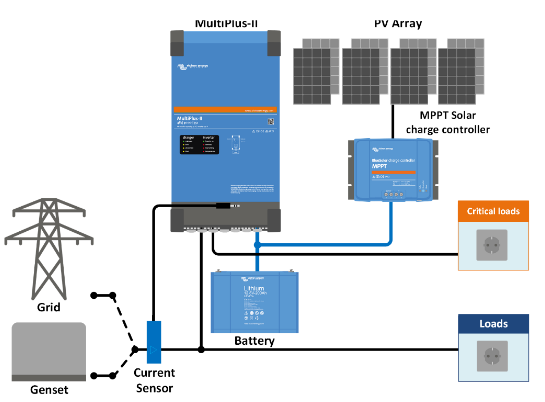
Hi Anton, the Victron MulitPlus II approach is somewhat different to our ongrid and offgrid system types. I'd interpret it as offgrid for the PV (as it does not feed into the grid), but ongrid for the loads (as loads are covered by grid energy). In case of grid outage, it would clearly be a DC coupled battery offgrid system: I think the most suitable way to model this in PV*SOL would be an offgrid system with diesel backup generator, and you interpret the generator energy as from grid energy. In offgrid systems in PV*SOL you can also define load shedding, which might be useful for this kind of application. Then, you define a PV inverter with the MPP tracker properties of the MPPT solar charge controller. The DC/AC efficiency would be your DC/DC efficiency of the solar charger. And then you need an offgrid battery inverter with the corresponding properties of the MultiPlus-II. This should give you results that are as close as possible with PV*SOL at the moment. Let me know if this helps. If you need any further assistance, please don't hesitate to ask. Kind regards, Martin
-
Hi Anton, do you have a schematic drawing of your system? Perhaps we can find a system type that comes close to your application. But a pure DC coupled offgrid system is not possible right now in PV*SOL, I am afraid. Kind regards, Martin
-
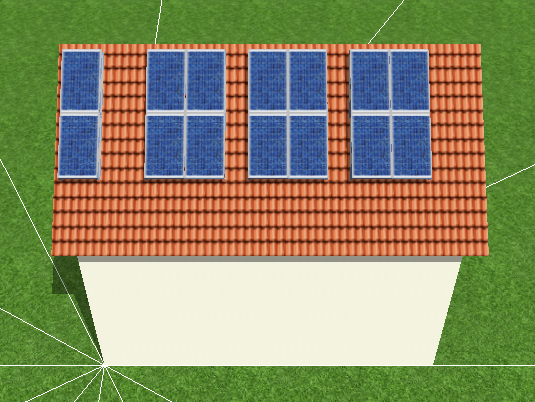
Hi Frido, yes, I do exactly understand what your points are, thank you for letting us know. We have these features requests and tweaks on our list, but right now I can't say when they could be released. For your first and initial problem, there might be a viable work-around (which I used for my screenshot as well). If you use module mounting systems instead of module coverage it should work as you expected. Module coverage relies on a fixed grid, which is why the outcome is like in your image, buiding B1. When covering the roof, the strict grid is followd, and if there is an obstacle or barred area, the module will not be placed. For a lot of applications, this might be the wanted behaviour. When using module mountings, you don't have this fixed grid, but each row is placed independently, so it results in a layout like in my screenshot. Give it a try and let me know if this does the trick for you. Kind regards, Martin
-
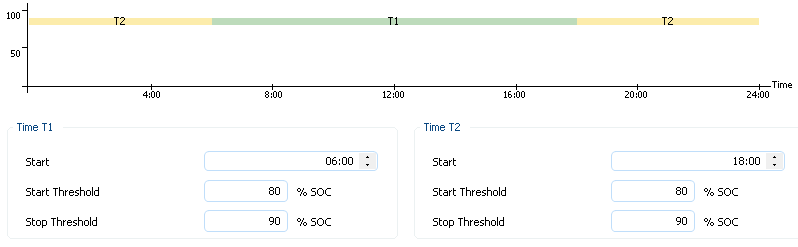
Hi Rasmus, sorry for the late reply. A simulation with another start or end date is not possible I am afraid. But concerning your concrete request about the SOC in offgrid systems: When the simulation starts, the batteries are set with an initial SOC value. In the case of offgrid plants, this is pre-calculated as an expected average SOC from the backup generator SOC thresholds. Even if the backup-generator is not used in the system, ie if you have chosen a system without backup generator, these thresholds are used. This was done for historical reason (in terms of software development), and we plan to change it in the future, but right now it would help you to manipulate the starting SOC. Just select the system type with diesel generator, set the SOC control thresholds to 80 and 90 respectively, and then change the project type back again. If you run the simulation now, the starting SOC will be between 80 and 90 %. No guarantee that this will work in the future but then we will have some other sort of editable starting value. For on grid battery systems the starting SOC value is fixed at 80%. For electric vehicles the starting SOC value is fixed at 100%. Hope that helps, kind regards, Martin
-
Hallo Marco, wir haben leider aus Zeitgründen noch nicht im Detail ergründen können, warum der Import dieser konkreten obj-Datei dieses Verhalten hervorgerufen hat. Es hatte sich dann auch insofern geklärt, als dass der Import im dae/3ds-Format geklappt hat. Es ist uns schon länger leidlich bewusst, dass die Welt der 3D-Formate sehr komplex ist, und auch innerhalb eines Formats wie z.B. obj, immense Unterschiede in der Interpretation durch die verschiedenen Tools liegen. Gute Erfahrungen haben wir mit obj-Modellen gemacht, die aus Blender kamen, aber hatten auch schon oft Probleme mit obj aus anderen Quellen. Daher bietet es sich auch immer an, die verschiedenen Formate auszuprobieren, die die Tools als Export anbieten. Viele Grüße, Martin
-
Hi Emmanuel, could you give more detail about the problem? Or provide a screenshot? Kind regards, Martin
-
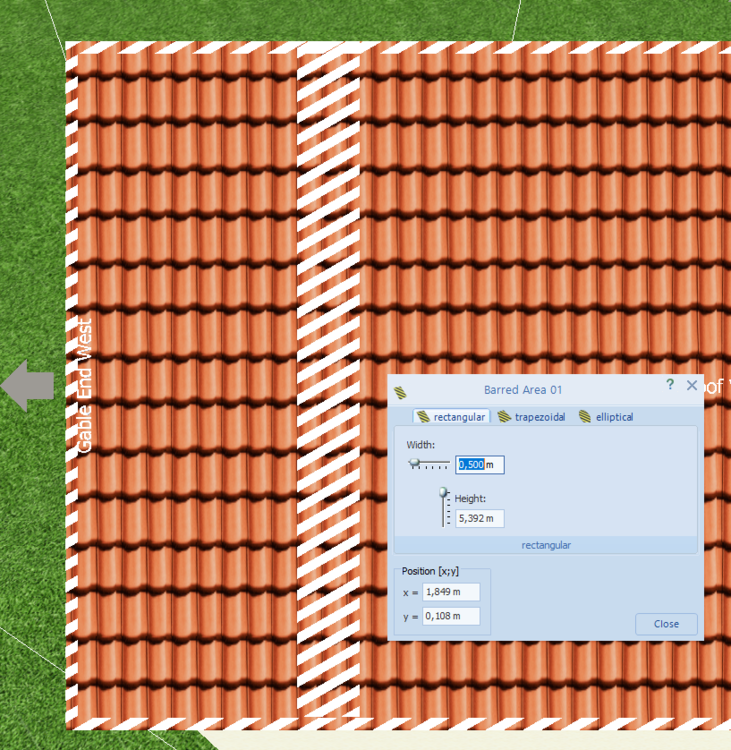
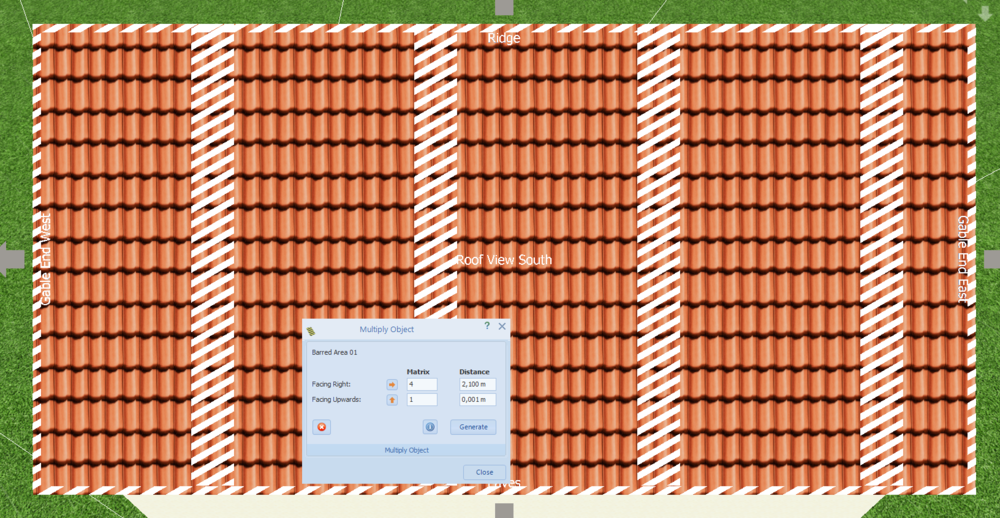
Hi Frido, at the moment you have the possibilty to achieve thermal gaps with barred areas, which you can define in their width (first image), and then multiply them (second image). Then you can place module mounting structures on the whole roof (or open area), and the barred areas are automatically left as gaps. Note that the first segment on the left might need a little adjustment depending on your geometry. In the future, we want to offer a more comfortable way to define these gaps, but I can't give a date right now. Hope that helps in the meantime, kind regards, Martin
-
This is excellent, Jordn! Thank you for sharing this. Impressive! Really a nice idea to share those projects. Some time ago there was another project from UK that was shared here in the forum, let me see if I can find it. Here it is. I like it because there is also a picture of the real PV system: Kind regards, Martin
-
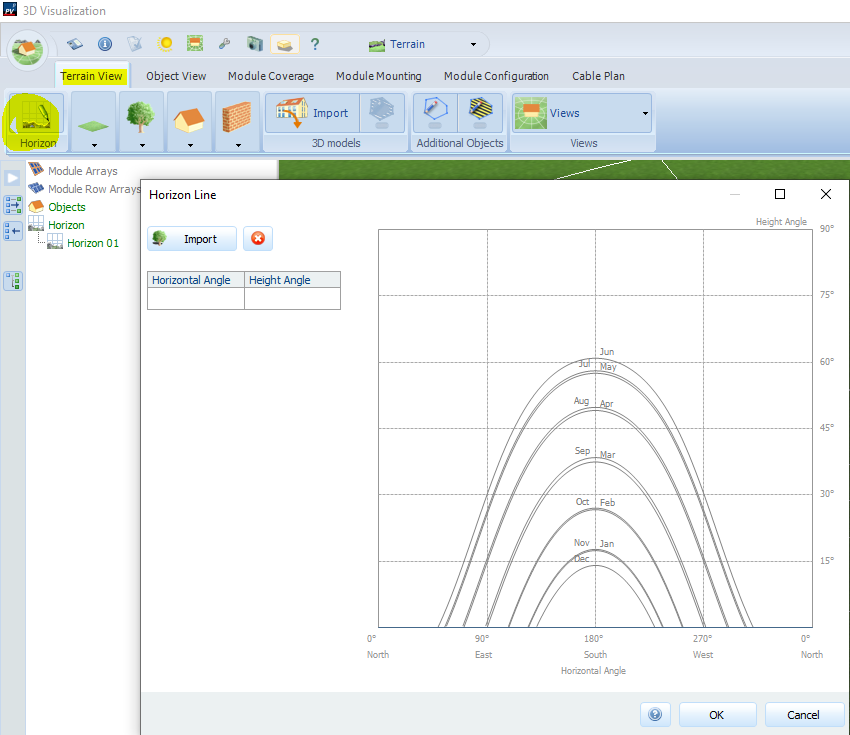
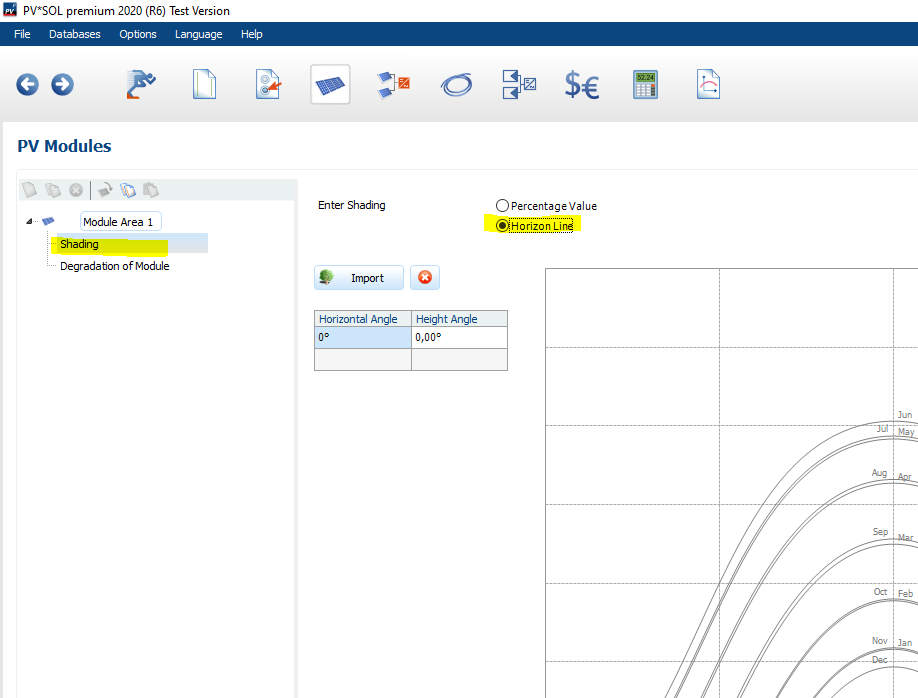
Dear Jordn, the sun position graph is visible in the horizon editor. In 3D projects this is here: In 2D projects it can be found here: The lines shown for every month refer to the 21st of each month, so that the real solstice can be seen. Kind regards, Martin
-
Hallo Frido, danke für den Fehlerbericht. Das ist kein Problem, das uns bekannt ist. Insofern würden wir uns freuen, wenn du uns die originale obj und die von dir erstellte pvprj zukommen lassen könntest. Gerne per private message hier im Forum. Danke und viele Grüße, Martin
-
Hallo Magge, die Testversionen haben den vollen Funktionsumfang, daran kann es also nicht liegen. Könntest du mal einen Screenshot schicken von dem Haus, dessen Dach du einzustellen versuchst? Am besten mit dem Bearbeiten-Dialog im Vordergrund, der die Einstellungen zeigt, die dann bei dir nicht klappen. Dank und Grüße, Martin
-
Hi Frido, could you send us the project file that you are having these problems with? You can send it via private message here in the forum. Thanks and kind regards, Martin
-
Dear Vikrant, in those cases please contact our sales team at sales@valentin-software.com, with your customer number and your serial number. They will be able to help you out. Kind regards, Martin
-

How to create an inverter with 9 MPPTs and 18 Strings per MPPT
developer_mh replied to Richard Guse's topic in PV*SOL
Dear Richard, I must admit that I have not seen an inverter with 162 DC inlets before... and yes, the maximum number of inlets in PV*SOL is 100 at the moment. But in PV*SOL you can connect more than 18 strings to the inverter anyway, even if the number of DC inlets is smaller. The consequence is that in the cabling page, a connection box (GCB) is used to connect the strings to the MPP tracker. But we will increase th elimit of that DC inlet field in the future, thanks for the feedback. Kind regards, Martin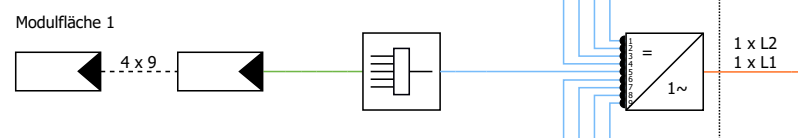
-
Modules for AEConversion AE INV315-50 micro inverter
developer_mh replied to Vishnu's topic in PV*SOL
Dear Vishnu, please do not apologize for aksing these questions. You can be sure that if you have the question there will surely be others that have the question as well. 1) Unless the manufacturer explicitly forbids the usage of modules with higher power, you don't risk the loss of warranty (but I am not a lawyer) or damage of the micro inverter. As you said, in usual conditions a 340 Wp module is not delivering 340 W. What you risk if you connect a module with higher power, current or voltage to an inverter is the clipping. The inverter just cuts anything that is over these threshold values, and you lose a bit energy. How much you lose can be verified in the results section, under "Energy balance". 2) Yes, clipping occurs for current, voltage (min and max) and power limitations. And yes, you are right, most of the employees of Valentin are Berlin based. Thank you for your wishes, same to you! Kind regards, Martin -
Dear Lenka, in PV*SOL we don't display the DST in our results. That is, when you see a time stamp saying August 13 16:00, it means that your watch would show 17:00 if you are in a region with DST (like Europe for example). That is what we do, correct. We decided not to move data in the diagram. The reason is that you would create a data gap of one hour when the time switches from winter to summer, and you would have an overlap of data in autumn, when you switch back. And additionaly the DST rules can get very complex around the globe, so we decided to provide standard winter time. But yes, if you read the diagrams, the time stamps in summer must be moved one hour forward. Kind regads, Martin
-
Dear José, I am sorry that you are not able to work with the 3D environment anymore. Could you give some more detail, if possible? What exactly happens when you start 3D? Could you provide screenshots, please? And also, please provide the log file "PVSOLpremium.log" that you can find at C:\ProgramData\Valentin EnergieSoftware\log Thanks in advance, Martin
-
Dear Karam, at the moment PV*SOL doesn't have this feature. It will be released with the next major version, 2021 R1. At the moment it is scheduled for beginning of November 2020. Kind regards, Martin
-
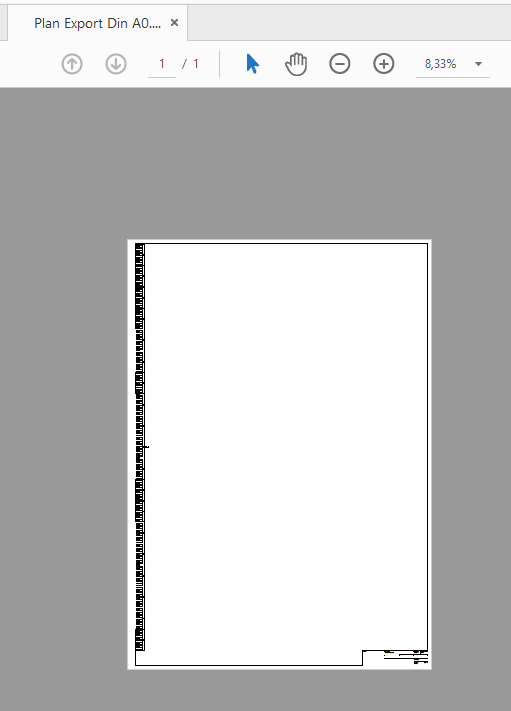
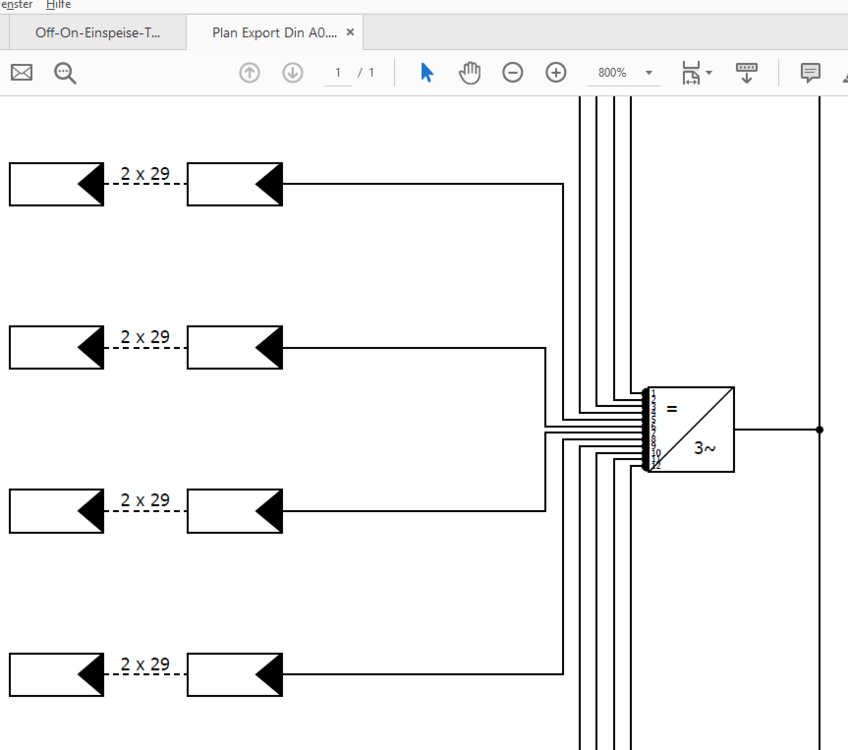
Dear and, the resolution of large plans is in fact a bit tricky. At least in the project report, where the plans are rasterized before printing them into the pdf or docs file. But you can export the cable plan directly on the cable page, as pdf or svg. In this case, the vectors are not rasterized and you conserve the good quality. See this export as DIN A0 page to pdf: and zoomed in: This does not work for the cable plans at the moment, since they are generated in a different way. But you could export those as dxf (where vector information is still included), and open it in a vector graphics application, like inkscape (it is open source and very powerful, we use it a lot: https://inkscape.org/). Hope that helps, kind regards, Martin
-
Hi Jimmy, you can right-click on the imported model, choose "Edit" and then rotate the object. Hope that helps, kind regards, Martin
-
pvsol 2019 Problem with cable menu view - PVSOL 2019
developer_mh replied to Alvin's topic in PV*SOL
Hi Alvin, the cable page was redesigned a little in recent versions, so if you can, consider updating to a newer version. If not, you could try to de-maximize the window of PV*SOL and then strech the window manually so that you can see the controls better. Kind regards, Martin -
photogrammetry Tilted photogrammetry model in 3d ambient
developer_mh replied to Alvin's topic in PV*SOL
Dear Alvin, I guess you will need to rotate the 3D model in another software, e.g. Blender or the like. Which photogrammetry software are you using? And aside from that, having a look at your model, I would recommend to choose only the building you are interested in, plus some surrounding buildings or trees. Try to keep the resolution of the geometries as high as possible, otherwise it will be difficult to get reliable shading simulation results. Kind regards, Martin -
Hi Jordn, this is a very interesting project you are working on there! Thank you for sharing this. In general, the climate data used to simulate the PV system have the strongest influence on the symmetry of the results. Other influences can come from the models used to calculate the irradiance on the tilted plane and so forth, the synchronity of the sun's coordinates with the climate data and the like. I just checked this for some locations and climate data sources, and compared the orientations 90° (East) and 270° (West) with 180° (South), all at 30° inclination. Berlin with data from DWD: East brings 82,4 %, West 80,6 % Berlin with TMY data, also DWD, but different source: East brings 82,7 %, West 77,7 % Severn England, SAP 2012 dataset: East brings 82,6 %, West 81,9 % Newquay UK, interpolated in PV*SOL with Meteonorm 7.2: East brings 82,6 %, West 81,4 % So, in contrast to your results, we have a higher irradiation on the East facing systems. This seems strange to me, could you provide a project file, perhaps? You can also send it via private message. Which version of PV*SOL are you using? Kind regards, Martin


