developer_mh
-
Posts
1,855 -
Joined
-
Last visited
-
Days Won
173
Everything posted by developer_mh
-
Hi iwanycka, thank you for your project file. As it is a rather large project (6000+ modules on 17 inverters with 9 MPP trackers each), I guess that the computer runs into memory problems. Try to close PV*SOL premium, and then open this file: C:\Users\USERNAME\Documents\Valentin EnergieSoftware\PVSOL premium 2020\PVSOL.ini Find the line that starts with <Results SaveHourlySimulationResults="False" SaveOneMinuteSimulationResults="False" SaveIVCurves="False" CalculateYieldLossDueToShading="True" MaxNumberOfInvertersForResults="20" ... normally around the middle of the file. Then change the attribute MaxNumberOfInvertersForResults="20" to MaxNumberOfInvertersForResults="10" Then start PV*SOL again and run the simulation of your project. The changed setting will tell PV*SOL not to record each individual result of each inverter for the energy balance, and that saves a lot of memory. Since you are not the only customer experiencing these kinds of problems, we will address this issue in the upcoming release (2020 R9) where we will introduce another attribute called "MaxNumberOfMppsForResults". There are a number of inverters with a lot of MPP trackers now, so we will have to track the total number of those as well in order to avoid memory problems. Kind regards, Martin
-
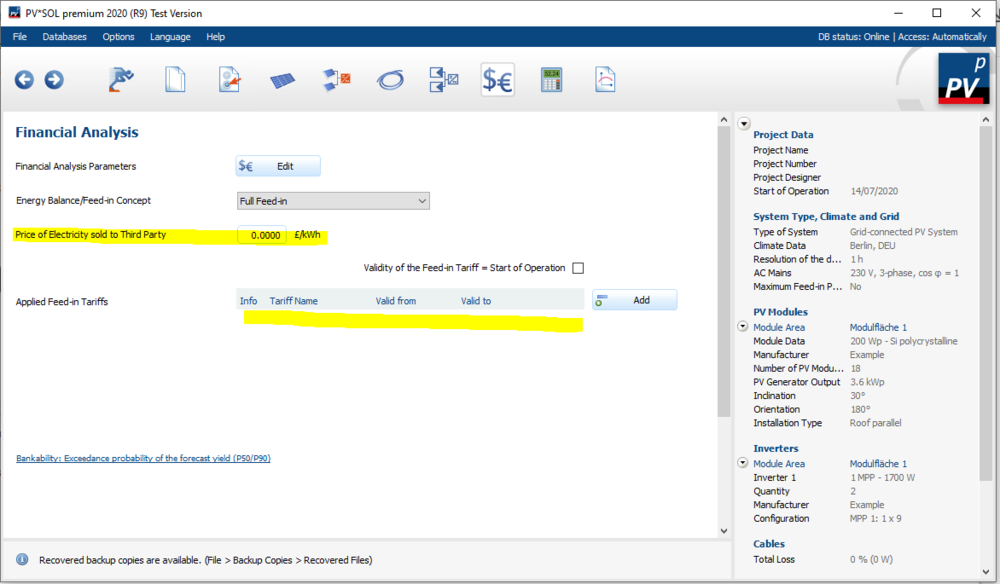
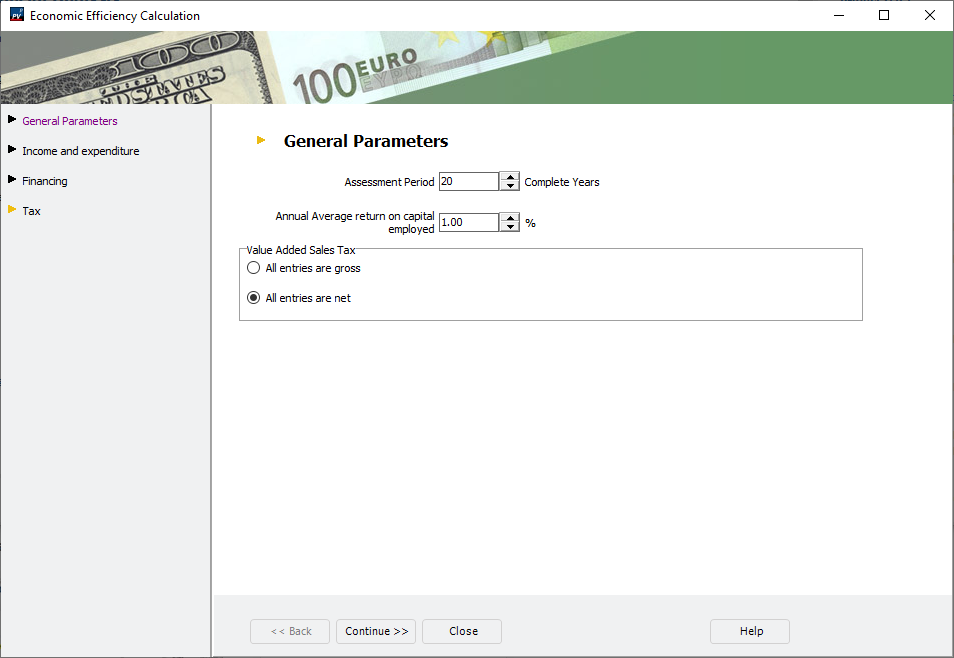
Hi ChaseSecrist, when analyzin PV systems with PPAs, you should chose the "Grid-connected system" first: Then on the page "Financial Analysis" you'll want to delete the feed-in tariffs. You can enter the price of electricity that is sold to third parties in the corresponding field. The other financial parameters (assessment period, investment cost, loans etc.) can be entered in a dialog that opens when you click on the "Edit" button. Hope that helps, kind regards, Martin

-
Hi Iwanycka, would it be possible to send us the project file (with the Sungrow 100CX), so that we can have a look into it? You can send it here vie private message. Thank you, kind regards, Martin
-
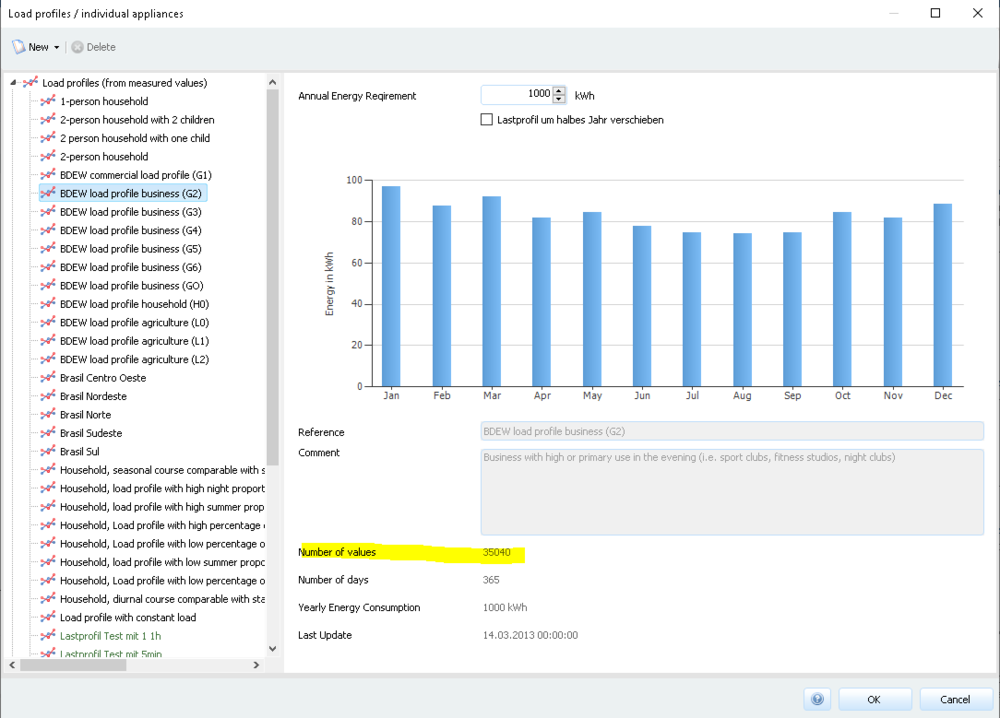
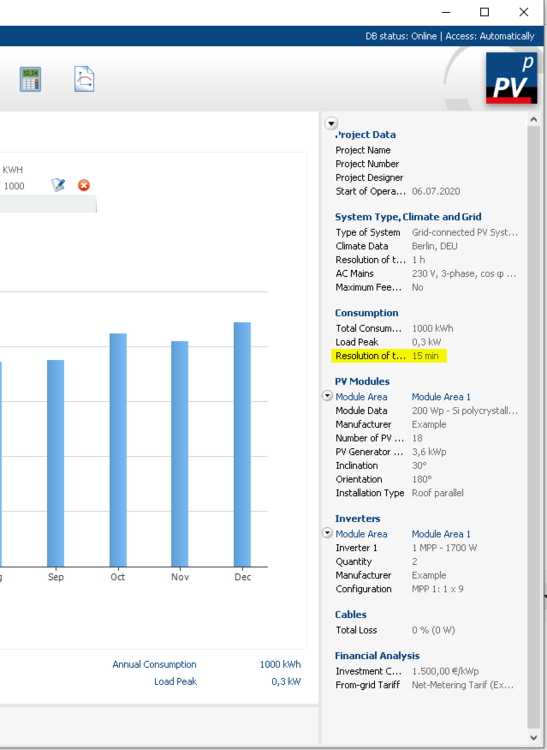
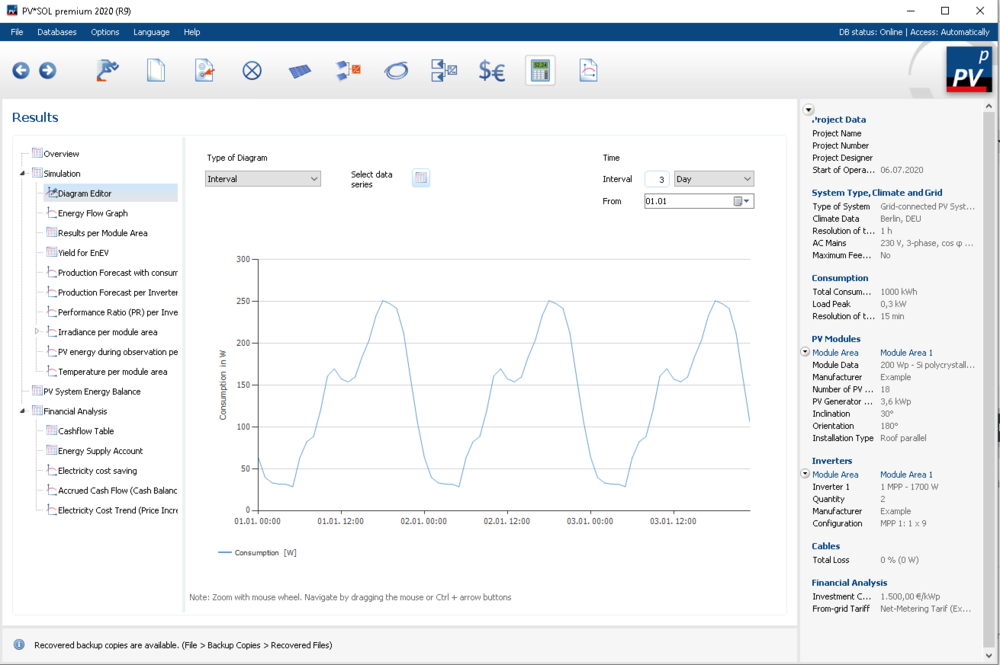
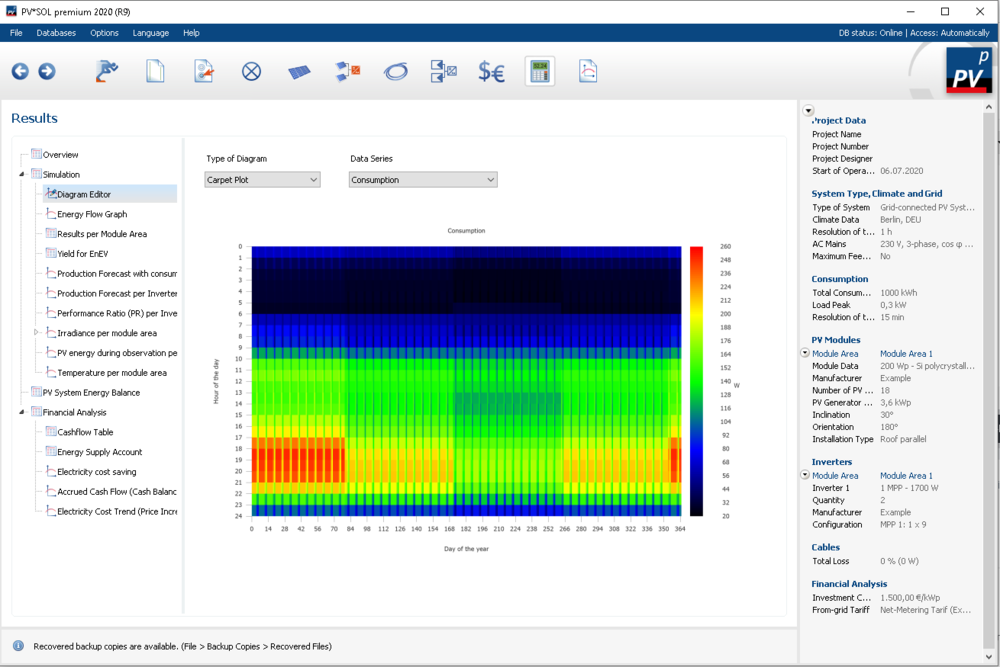
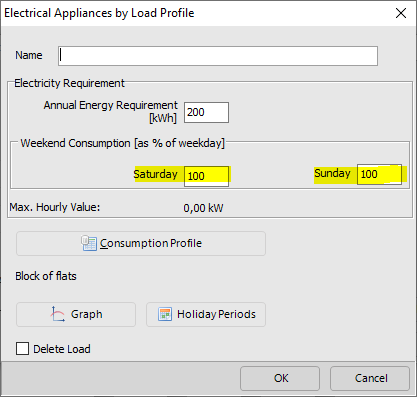
Dear Miguel, thank you for your questions regarding the consumption profiles. All load profiles have a resolution of at least one hour. Most predefined load profiles have a resolution of 15min or 1min. In case of the BDEW profiles it is 15min. You can see the number of values when selecting the profile: Or, when having selected the profile, you'll see the resolution in the status on the right: The actual profile can be analysed after the simulation, at Results -> Simulation -> Diagram Editor. There you have either the option to select the consumption time series or the carpet plot: These diagrams will also be available directly on the consumption page in our new major release PV*SOL premium 2021 R1 (planned for November 2020), so that they are more accessible. This feature will also be added in the next major release PV*SOL premium 2021 R1 (planned for November 2020). It was available in past releases, however, so if you wish, you can refer to this thread to see your options: Hope that helps, kind regards, Martin
-
Hello Lee, the message that there is no internet connection available is not related to paying for an update or so. Updates are always included if you have a valid software maintenance contract. When you purchase you get 6 months of updates for free. See more here: https://valentin-software.com/en/products/software-maintenance/ You can contact our sales team with your customer number so they can explain the details. Which version have you been purchasing? Try to download the newest version and do a fresh install, this might help: https://valentin-software.com/en/downloads/ Kind regards, Martin
-

different end simulation results for the same projekt
developer_mh replied to Vishnu's topic in PV*SOL
Dear Vishnu, yes, there have been some changes in the simulation core. If you can tell me the program version of PV*SOL that was used to run the simulations in the first place, I can identify the changes that are responsible for the change of the simulation results. You can also have a look at the changelogs here: https://valentin-software.com/en/products/pvsol-premium/ Kind regards, Martin -
very nice work, Jordn! This looks really amazing.
-
Sungrow SG110CX inverter configuration problem
developer_mh replied to ashraf_elawad's topic in PV*SOL
Dear Ashraf, we were able to identify the problem. A solution will be published in the next release, PV*SOL premium 2020 R9. The solution will fix the issue that the automatic configuration is not able to find a valid configuration for the Sungrow SG110CX. Kind regards, Martin -
Hi Ricardo, thank you for notifying us of the missing inverter. I will forward this request to our database team, so that they can take care of it. You can also write to them directly for future requests at database@valentin-software.com. Kind regards, Martin
- 1 reply
-
- 1
-

-
Here's the link: https://downloads.valentin.de/pvsol/setup_pvsolpremium_2019_14.exe Kind regards, Martin
-
Hi Mads, thank you for your question. Unfortunately we have not yet implemented this feature that we had in the past in the new consumption dialog. We will implement it as soon as possible. Right now the only solution for you would be to define such a load profile in PV*SOL (premium) 2019 and then import it in PV*SOL (premium) 2020. Kind regards, Martin
-
Sungrow SG110CX inverter configuration problem
developer_mh replied to ashraf_elawad's topic in PV*SOL
Dear Ashraf Elawad, thank you for reporting this problem. We are currently analyzing the issue, and we will get back to you as soon as we have an answer. Kind regards, Martin -
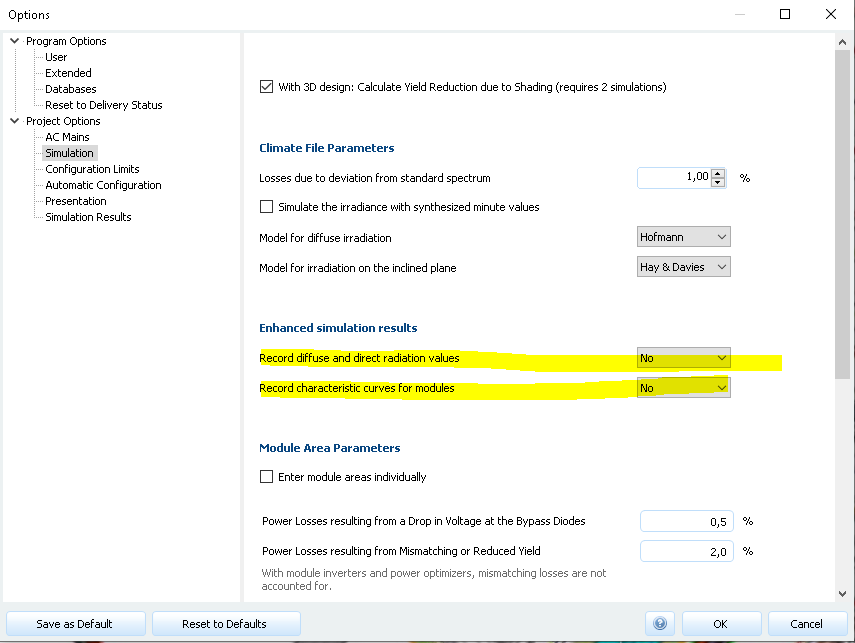
Hi Ricardo, thank you for the file. I just opened it in PV*SOL premium 2020 R8 and it simulates fine, without crash. Perhaps you can check if you have these options set to "no", this saves some memory in some cases: Kind regards, Martin
-
Changing module mounting inclination on existing simulation
developer_mh replied to RicardoM's topic in PV*SOL
Hi Ricardo, yes, we have that on our list, along with other improvements for the usibility of the 3D environment. Kind regards, Martin -
Dear Ricardo, sure we can have a look at your file. Could you send it via private message here, please? Kind regards, Martin
-
Changing module mounting inclination on existing simulation
developer_mh replied to RicardoM's topic in PV*SOL
Dear Ricardo, I fear that I must agree with Timgreen's comment. This is not possible, I am afraid. Kind regards, Martin -
Dear Rob, thank you for letting us know about the Jinko modules. I will forward this request to our database team at database@valentin-software.com. In general, the manufacturers are responsible for putting their products into our database, so it might help as well if you contact them (we do as well). Kind regards, Martin
-
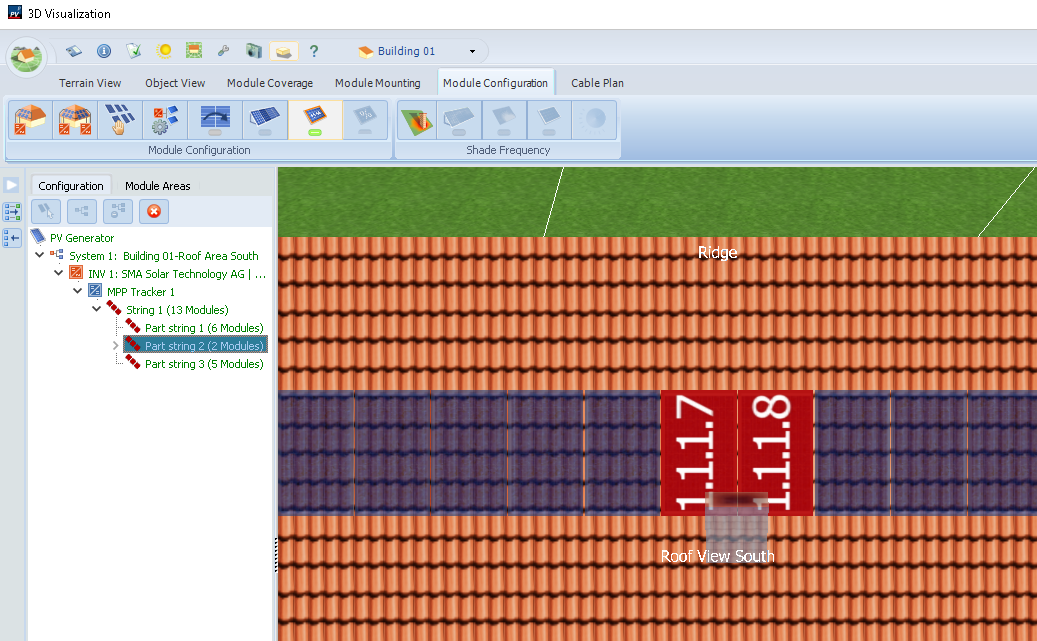
Hi Jon, this is exactly the way to go. You can check if the right modules are equipped with power optimizers if you select the corresponding substring in the tree view on the left (my test project differs a bit from yours): Kind regards, Martin

-
Dear Natheera, the climate data we use in PV*SOL is from Meteonorm, that is correct. The Meteonorm climate data are based on various sources of radiation measurements (ground stations, satellite) , with different time ranges (e.g. 1961 - 1990 or 1991 - 2010 and so on). The availability of climate dataset source varies from location to location. You can find more on that topic here in the manual of Meteonorm in Chapter 3.1: https://meteonorm.com/assets/downloads/mn73_software.pdf This information refers to a another type of product by Meteonorm, historical time series with one hour resolution. These are not climate data files which we normally use for simulation, as they are not representative. Generally it is advised to use the climate datasets with the most recent years that are available, that is correct. The availability of high quality long term measurements however is distributed very unevenly around the globe, however. Hope that helps, kind regards, Martin
- 1 reply
-
- 1
-
-
Hallo Energieumdenker, ja, da ist was dran, die Rolle der Klimaanlagen wird wohl wichtiger werden. Es ist jedoch nicht ganz trivial, an sinnvolle Lastprofile von Klimaanlagen zu kommen, aber wir arbeiten dran. Beste Grüße, Martin
-
Dear guest, thank you for reporting the missing module. I will forward this information to my colleagues at database@valentin-software.com. If you find another missing database product in the future, you can contact them directly. Kind regards, Martin
-
Hi K24, as Vishnu pointed out, the activation of minute values is most of all important if you have sizing factors of above 115 %, or if you have battery systems or electrical appliances that are involved. If your DC/AC ratio is about 1, and you just want to analyse the feed in, you might be well off with hourly values. But I would always recommend to compare the results at least once. Just simulate your PV system with hourly values, save the results somewehre, and then simulate the same system with one-minute values. Then you'll directly see the differences for your specific case. Our recommendation for the diffuse model is Hofmann (disclaimer: that is me), but we don't recommend it just like that, we have scientific evidence that it performs best under nearly all conditions (especially when using one-minute resolution). See more on diffuse irradiation models here: https://help.valentin-software.com/pvsol/2020/calculation/irradiation/diffuse-irradiation/ Kind regards, Martin
-
Hi Vishnu, thank you for your question! Could you describe a little more in detail how the system is set up, what you expected from simulation, and what came out in reality? When I understand the chart from SolarEdge right, it says that 181.66 kWh were generated by the PV system, and there was a consumption of 489.42 kWh. Nearly all of the produced PV energy (181.58 kWh) was self consumed, and the rest (307.84 kWh) had to be imported. Is that correct? I guess I am lacking information on where exactly the problem is, I am sorry. Kind regards, Martin
-
Dear Rob, it is true that row-to-row shading is not calculated in the basic PV*SOL version (without premium). Detailed shading analysis is available only in the premium version. I am sorry that this wasn't clear from the beginning. Kind regards, Martin
-
Hi Ammar, there could be a lot of reasons. Most of the time is has to do with time zones or daylight saving times. Could you provide the data that you imported? Kind regards, Martin