


developer_mh
-
Posts
1,855 -
Joined
-
Last visited
-
Days Won
173
Everything posted by developer_mh
-
 Hallo Alexander, schönes Projekt hast du da! Hoffentlich wird das auch so gebaut Der Grund für den Absturz der Simulation ist mit dem nächsten Release (2020 R10) behoben. Ich hoffe, das es in nicht allzu langer Zeit auf den Markt kommt. Beste Grüße, Martin
 -
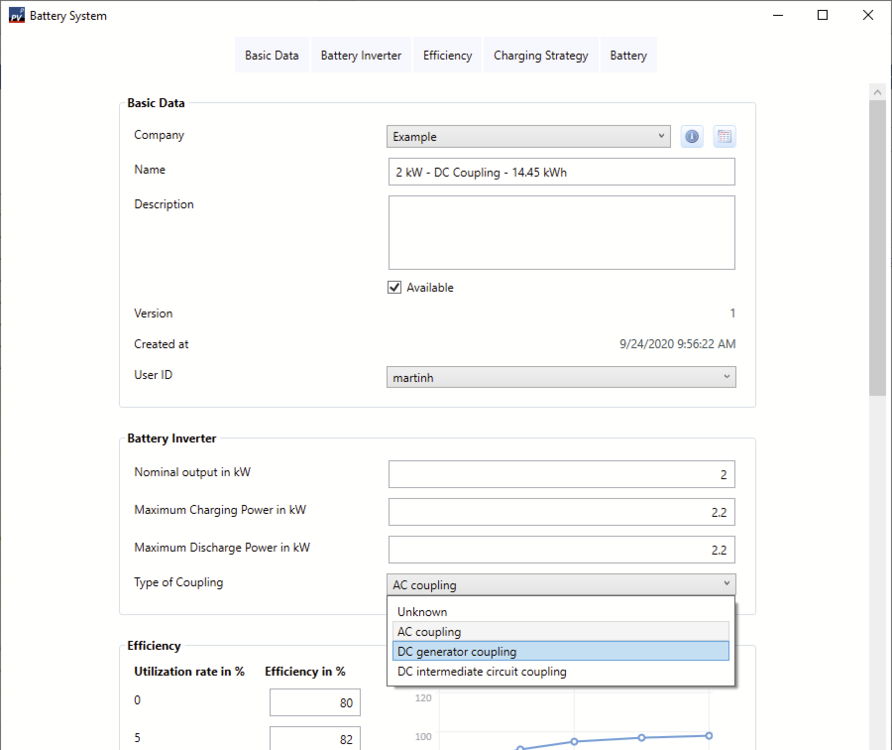
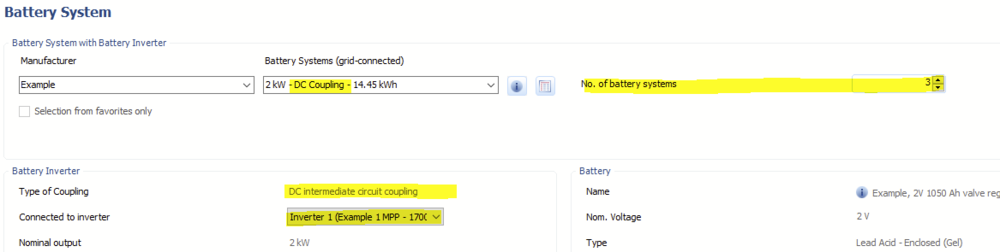
Hi Miguel, you can change the type of coupling in the battery system itself. Note that you can't change system database entries, you'll have to create your own, e.g. by copying an existing one: What I meant with connecting 3 equal DC coupled battery systems to 3 equal inverters is that. On the inverter page you have 3 times the same inverter: And then on the battery system page you'll have the battery system amount set to 3: Hope that clarifies the doubts. If you have questions, please let me know! Kind regards, Martin

-
Anzeige Gestehungskosten mit mehr Nachkommastellen
developer_mh replied to Schäfer's topic in PV*SOL
Hallo Stefan, guter Punkt, wir nehmen das mal auf. Danke und viele Grüße, Martin -
Hallo Alex, könntest du mir das Projekt mal schicken, dann kann ich schauen, woran es liegt und was man evtl. machen könnte. Gerne hier im Forum per privater Nachricht. Danke und viele Grüße, Martin
-
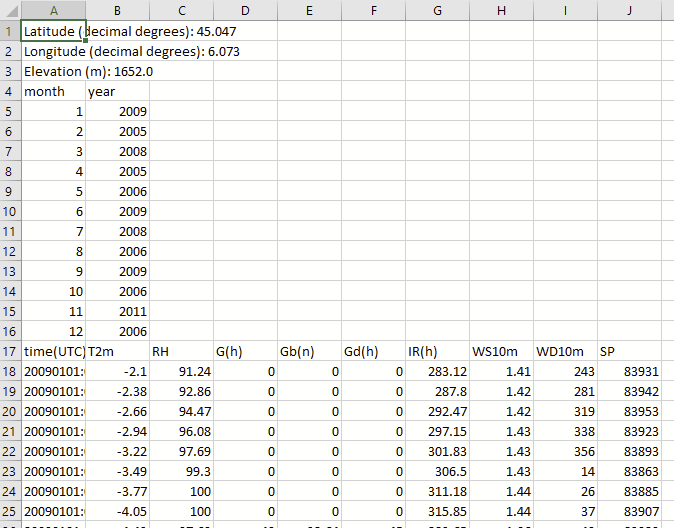
Hi Reint, the easiest way would be to import the comma separated values in Excel so that they appear in their own column. Refer to this short guide here : https://support.microsoft.com/en-us/office/import-or-export-text-txt-or-csv-files-5250ac4c-663c-47ce-937b-339e391393ba The result would look like this: Then it should be easier to eliminate the columns that you don't need and compile the dat file as required. Hope that helps, kind regards, Martin
-
Hi Miguel, that is correct, at the moment the battery systems can only be connected to one inverter if the battery systems are DC coupled. You can change the amount of (equal) battery systems, however, so if your three inverters are the same, you can have 3 x inverter "xy" connected to 3 x dc battery system "abc". Hope that helps, kind regards, Martin
-
Hi Mikecrypto, before I answer: I'd like to repeat that this is a hack and unsupported - and if someone asks: I didn't tell you Take the 3D project file where you want to change the textures make a copy of the file change the file extension from pvprj to zip. Use 7zip to extract all the content in the folder "Visu3D" there is an image file called "FrontTexturPvModul.jpg" replace this file with the texture that you want (must have same dimensions and bitness as the original) re-zip all the content that you previously unzipped change the extension from zip to pvprj open in PVSOL and see your texture on the modules in 3D Disclaimer: I wrote this from my rememberings, I didn't try it today. Hope that helps, kind regards, Martin
-
2 Sungrow Hybrid inverters each with LG Chem Resu 10
developer_mh replied to Vishnu's topic in PV*SOL
Hi Vishnu, if the system is not in the database, you would have to add it yourself, I am afraid. You will have to enter the battery system capabilities of the Sungrow inverter in the battery system section and then add the LG Chem Resu 10 as battery. Right now, the functionalities of the PV inverter and the battery system are always separated in PV*SOL, even if in reality it is the same device. Yes, this is possible, as long as the inverters are the same. Then you can set the number of battery systems to 2. Kind regards, Martin -
Hi Karim, could you provide a project file where that happens, please? You can send it by private message. Which inverters do you have in your selection? Kind regards, Martin
-
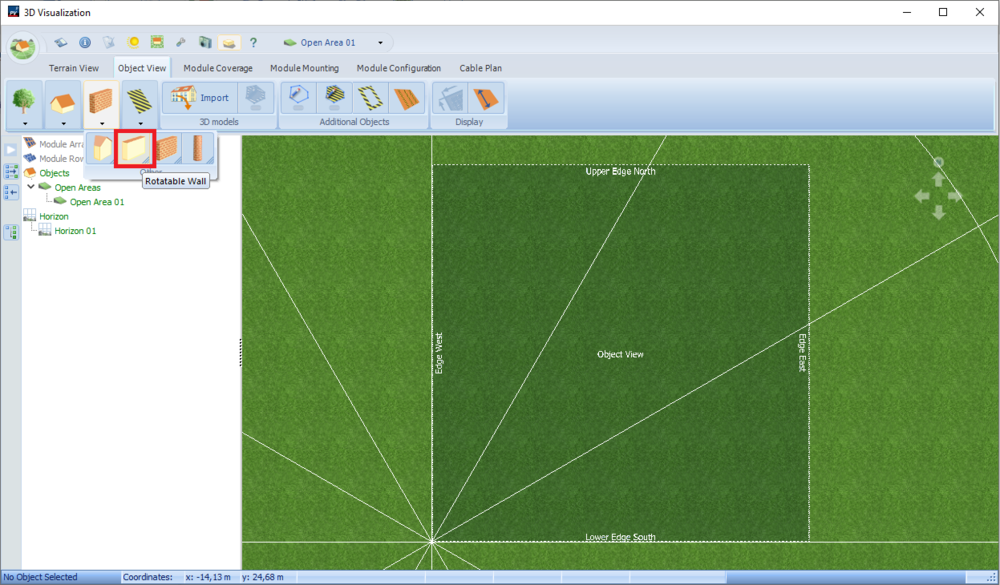
Hi Frido, as James pointed out, there is also a rotatable wall when using open areas: Hope that helps, kind regards, Martin
-
Hi Ricardo, could you provide a project file, please? That would make it easier for us to see what happens. I quickly set up a similar project (PV and consumers, with zero feed in), and it looks like this (disclaimer: I did not enter reasonable economy values): And then in the economy section: Kind regards, Martin
-
Hi Reint, the *.dat file format is the one you can use. Here's a explanation how to prepare the files: https://help.valentin-software.com/pvsol/2020/pages/system-type-climate-and-grid/meteosyn/#options Kind regards, Martin
-
Hallo Christian, ja, klar, das geht. Es sind beliebige Verschaltungen möglich. Im Forum findet sich bereits einiges zum Thema, aber als einfachen Einstieg würde ich dir mal diese Videos empfehlen: https://www.youtube.com/watch?v=q2-L2KEsOI4 https://www.youtube.com/watch?v=I8wMA7p7dbk Wenn du weitere Fragen dazu hast, bitte gerne fragen! Beste Grüße, Martin
-
Hallo Ralf, das kommt ein bisschen darauf an, bei welcher Verbraucher-Art man die Monatswerte eingibt. Beim "Monats/Jahresvberrauch Net-Metering" werden die monatlichen Werte gleichmäßig auf die Stunden verteilt. Bei Net Metering spielt der Zeitfaktor, also die Gleichzeitigkeit ja auch keine Rolle. Bei den Lastprofilen aus Tagesverläufen werden die Monatswerte gemäß der angegebenen Tagesverläufe aufgeteilt. Mehr zu dem Thema findest du auch hier: https://help.valentin-software.com/pvsol/2020/navigationsseiten/verbrauch/ Ich hoffe, das hilft weiter. Viele Grüße, Martin
-
Hallo Ahmed, ich habe deine Frage mal in die deutsche Abteilung hier im Forum verschoben. Du kannst aber in Zukunft natürlich auch gerne auf English schreiben, wenn dir das lieber ist. Die Art des Einspeisemanagements, die du beschreibst, ist mir leider nicht bekannt. In PV*SOL wird mit der vorhandenen PV-Leistung immer zuerst die Last gedeckt und dann der Überschuss eingespeist. Eine feste Einspeise-Regelung auf z.B. mindestens oder höchstens 110 kWp leuchtet mir da nicht so recht ein. Was wäre denn der Anwendungsfall? Viele Grüße, Martin
-
Guten Morgen, in PV*SOL lassen sich solche Strukturen bisher nicht modellieren. Eine Lösung wäre, die Liftaufbauten mitsamt Solar-Tragekonstruktion als Ganzes aus dem Gebäude zu extrudieren. Das sähe zwar nicht so schön aus, und die darunterliegenden Sitzplätze wären nicht sichtbar, aber zumindest was die PV angeht, würde man energetisch keinen Fehler machen. Oder man modelliert das Gebäude in einem anderen 3D-Programm, z.B. Sketchup, und importiert es dann. Beste Grüße und viel Erfolg, Martin
-
Hi Robert, the translation from Polish to English might be a bit rough, but from what I understand you are wondering about the DC cabling visualisation of the inverters with more than one PV module, is that right? As I don't have the project file, I can only refer to the screenshots. The module numbers reveal that there is always just one PV module per string. A string has a + and - minus symbol at its ends, from where the cabling goes to the inverter. So as far as I can see the visualisation is also correct? Sorry if I am getting the question wrong... Kind regards, Martin
-
Hi Reint, this is a frequently asked and discussed topic. See for example here: At the moment, our climate data provider doesn't have data with more recent time spans for the Netherlands. If you want to use more recent data, we would recommend downloading the TMY data from PVGIS (link is also in the post above). Hope that helps, Martin
-
urgent: Down-regulation on the account of the MPP Voltage Range
developer_mh replied to Ragy's topic in PV*SOL
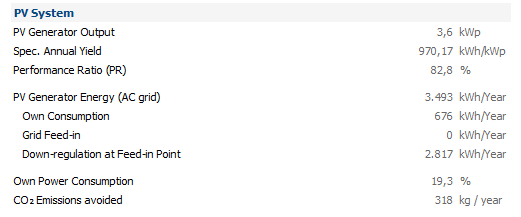
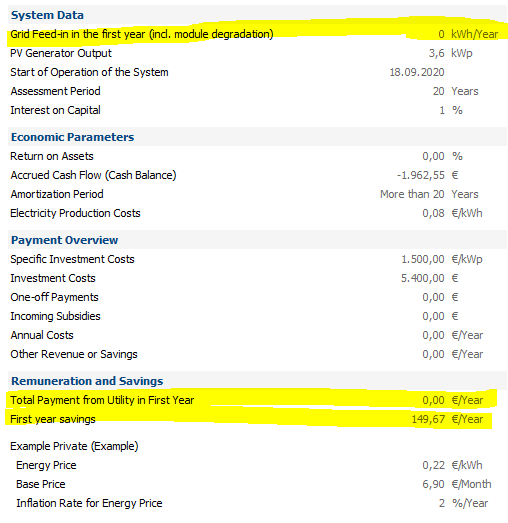
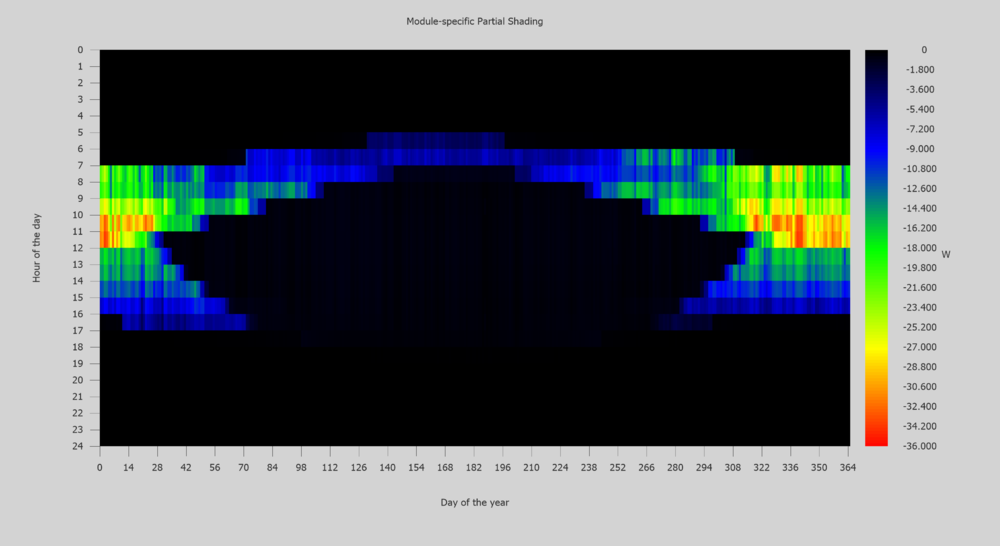
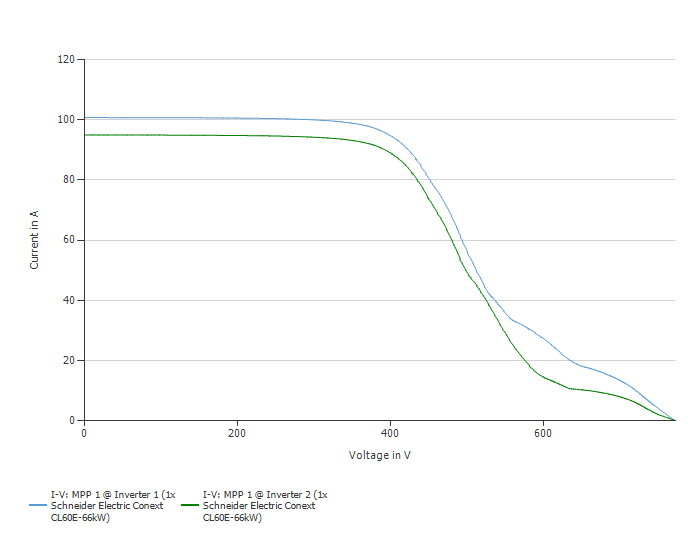
Hi Ragy, the reason for the downregulation losses due to the MPP voltage range is that in winter time the modules are causing a shade on each other: You can see the module-specfic shading losses in the carpet plots very well: The modules are connected 11 in parallel by 17 in series, so the resulting module array characteristics look like this: As you can see there is a pronounced drop of current in the upper voltage range above 400V. In the power-voltage plot it looks like this: So the maximum power point at this specific point in time (01.01. at 11 to 12 am, with these specific shading and irradiance values) would be around 410 - 430 V. But the lower end of the MPP voltage range is at 570 V. Of the available 35 to 40 kW, the inverter can only take 10 to 20 kW. The difference between these points (maximum available power and best point that the inverter can reach) is the loss due to MPP voltage range. Hope that helps, Martin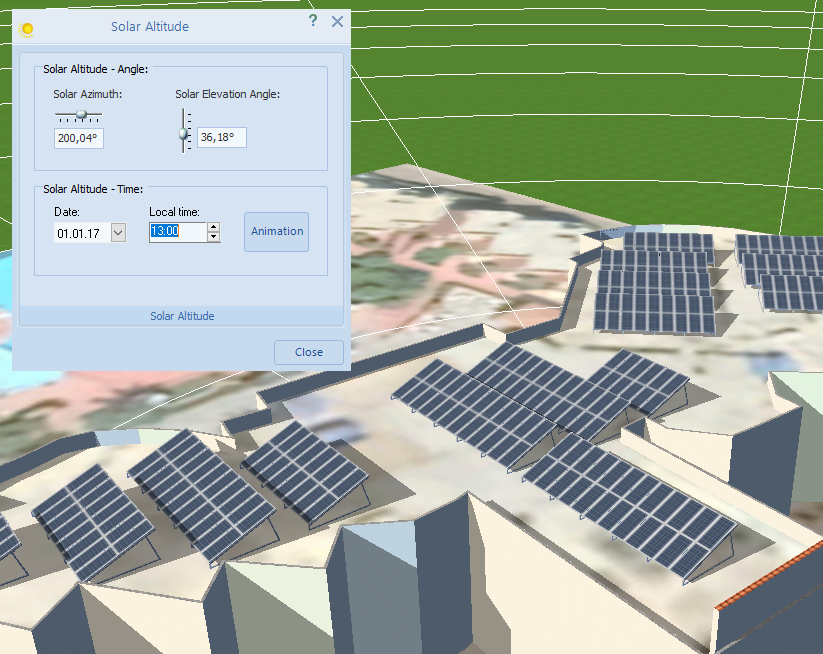

-
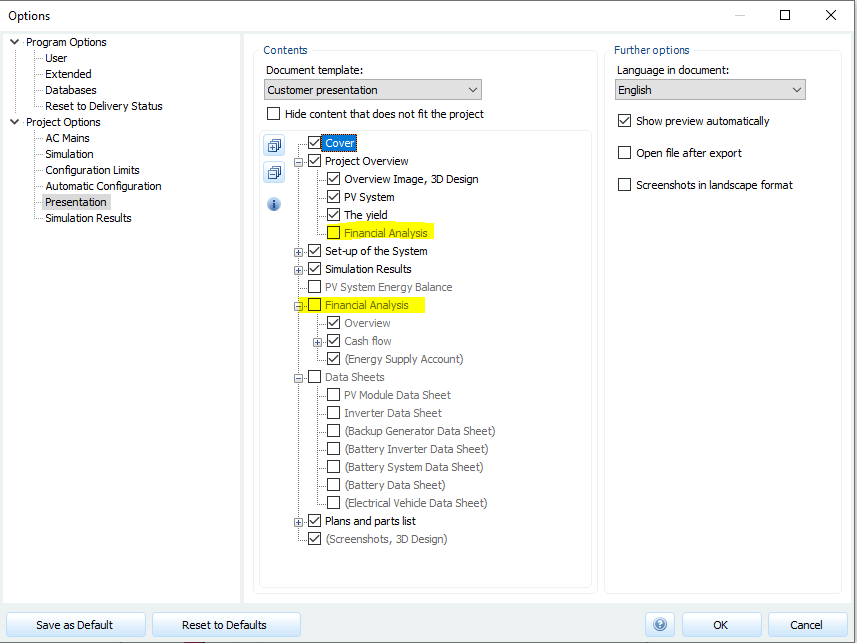
Hi klb, in the options of the presentation, there are two check boxes for the financing. If you uncheck both, both financing sections will be gone: Hope that does it for you, kind regards, Martin
-
Auto in PV-Sol - Verbesserungsbedarf PV Überschussladen
developer_mh replied to RLoos's topic in PV*SOL
Hallo Robert, vielen Dank für die hilfreichen Anmerkungen. Punkt 1 ist sehr interessant, das werden wir uns einmal ansehen. Punkt 2 haben wir auch schon auf der Liste. Der Ladewirkungsgrad ist zwar auch in PV*SOL abhängig von der Ladeleistung, aber wohl tatsächlich ein wenig zu optimistisch angesetzt. Gute Hinweise, danke nochmal! Viele Grüße, Martin -
Verschattungswerte Modul und Ertragsminderung durch Abschattung
developer_mh replied to Ralf's topic in PV*SOL
Hallo Ralf, der prozentuale Wert, der in der 3D-Visualisierung auf den Modulen dargestellt wird, bezieht sich nur auf die Reduktion der Clear-Sky- (oder Schönwetter-) Strahlung. Es fließt damit der standortabhängige Verlauf der Sonne mit ein, aber nicht die tatsächlichen Klimadaten. Die Ertragsminderung durch Abschattung hingegen berücksichtigt wirklich alles, also die tatsächlichen Klimadaten (Direkt- und Diffusstrahlung), Änderung der Modultemperatur durch die Abschattung, Mismatch-Verluste dadurch, dass die Module ungleich abgeschattet werden etc. Die Prozent-Werte in der Planung sind somit nur ein schnell verfügbarer Hinweis für den Planer, bei welchen Modulen eine höhere Abschattung zu erwarten ist. Wie hoch die tatsächlichen energetischen Verluste sind, kann nur die Zeitschritt-Simulation am Ende der Planung zeigen. Viele Grüße, Martin -
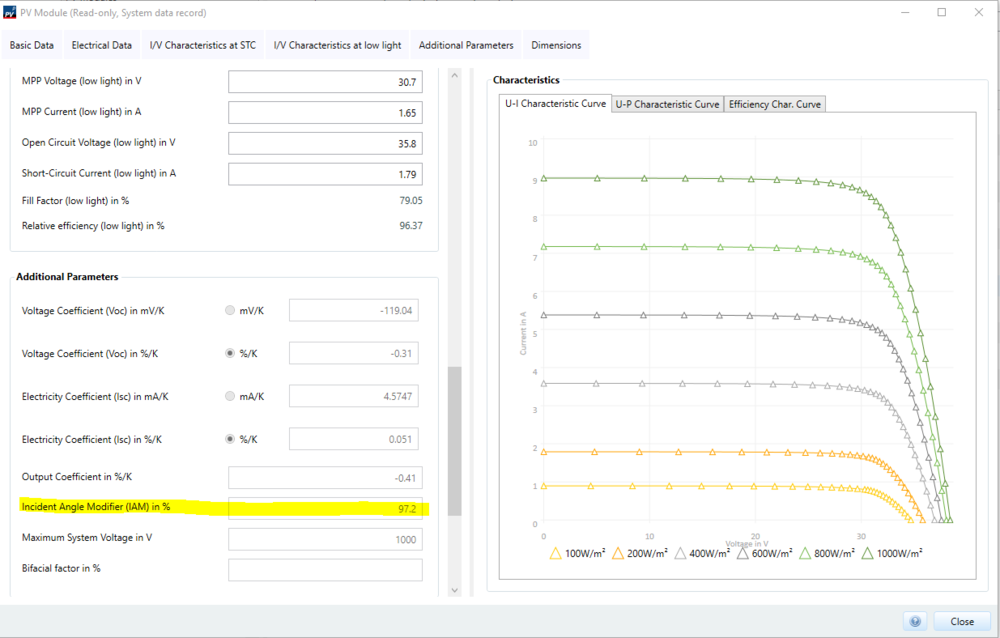
Hi Ricardo, you can find the IAM under "Additional parameters": Kind regards, Martin
-
Gerne
-
Hi Nicolaas, I will inform the database team that this inverter is missing. You can also do so by writing them an e-mail (database@valentin-software.com), if you encounter another missing inverter or module in the future. In the meanwhile you can duplicate an existing inverter from Schneider and update the electrical properties according to the data sheet: https://solar.schneider-electric.com/wp-content/uploads/2020/08/DS20200812_CL36.pdf You can use it then in your simulations. Kind regards, Martin


