-
Posts
1,855 -
Joined
-
Last visited
-
Days Won
173
Everything posted by developer_mh
-
Hallo mlo, ja, die Ertragsverluste unterscheiden sich schon je nach Montage und Einbausituation. Könntest du uns die vergleichenden Projektdateien zur Verfügung stellen, dann können wir das besser nachvollziehen. Gerne als private Nachricht hier im Forum. Danke und viele Grüße, Martin
-
Hi Holm, I am glad you found out! If you need further assistance, please let us know! See also our help pages here: https://help.valentin-software.com/pvsol/en/ Best wishes, kind regards, Martin
-
Hi Paul, thank you for the schematics! Are the electrical loads connected to the grid directly, that is, after the voltage stabilizer? I see that the MPPTs are connected directly to the batteries? Is it possible with this setup, that the PV is directly covering the loads? And, last question: Do you primarily intend to analyse the grid connected case or the offgrid case? Kind regards, Martin
- 7 replies
-
- pvsol
- add to database
-
(and 1 more)
Tagged with:
-

Base de donné PV sol Solar Carport & virtual storage
developer_mh replied to Photovoltaique83's topic in PV*SOL
Hi Photovoltaique83, thank you for the input. Do you have special solar carports in mind? Can you give examples of manufacturers? The idea of virtual storage tariffs is great, we also have some providers here in Germany. We definetely have that on our list, as this topic will be increasingly important in the future. Thank you for pointing us out on the providers in France! Kind regards, Martin -
Hi Rick, there is no out-of-the-box solution for designing DC-only systems in PV*SOL right now, I am afraid. One possible solution would be to interpret the AC mains as your DC bus, set the voltage to your DC voltage (12 or 24 or 48 V or so), and interpret the PV inverters as DC/DC converters. It will work, and energetically the errors that you'll make are small. It is not the nicest solution, I know, but it will work. If you are not connected to the grid, you will have to choose a stand-alone (offgrid) system type in PV*SOL: https://help.valentin-software.com/pvsol/2020/pages/system-type-climate-and-grid/ Hope that helps, kind regards, Martin
-
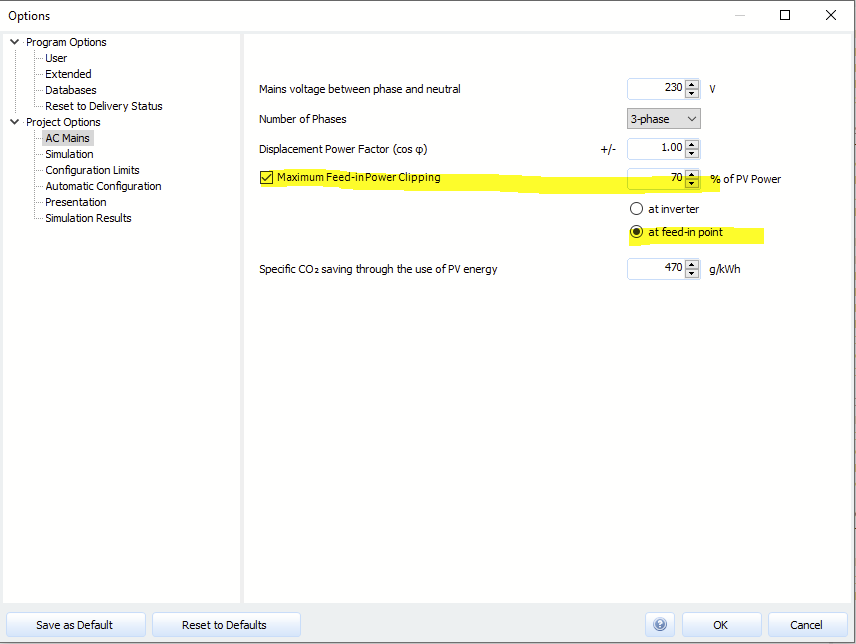
Hi SPS, there is a feature called maximum power clipping, in the "AC mains" dialog on the page "System type, climate and grid". The value is given in percent. You want to limit the power to 24 kW AC and you have 39,68 kWp installed on the DC side, so your value will be 60 %. Hope that helps, kind regards, Martin
-
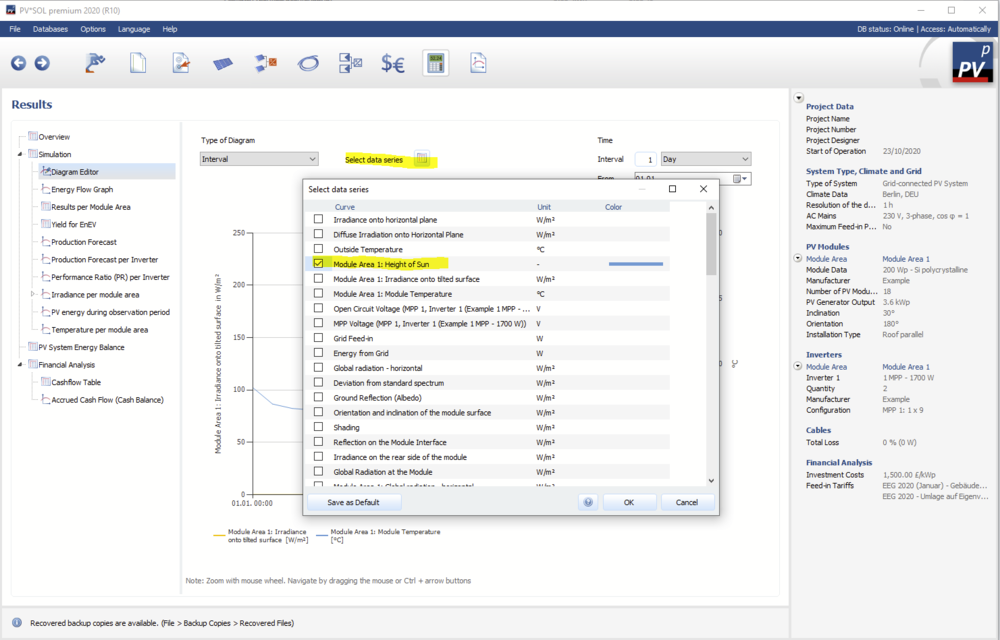
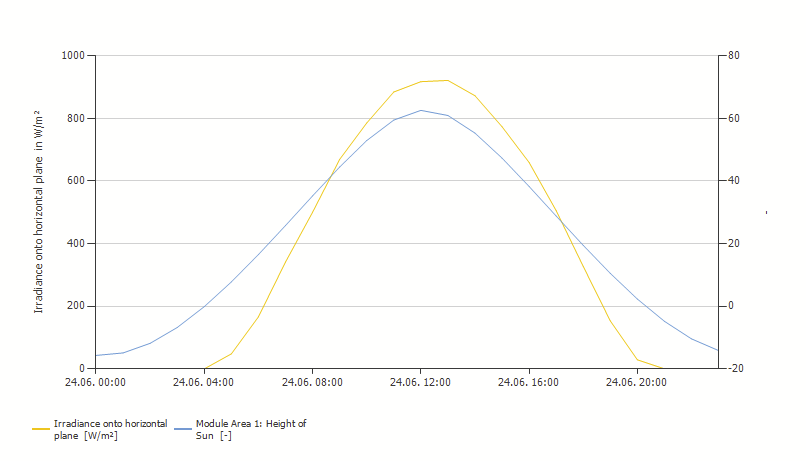
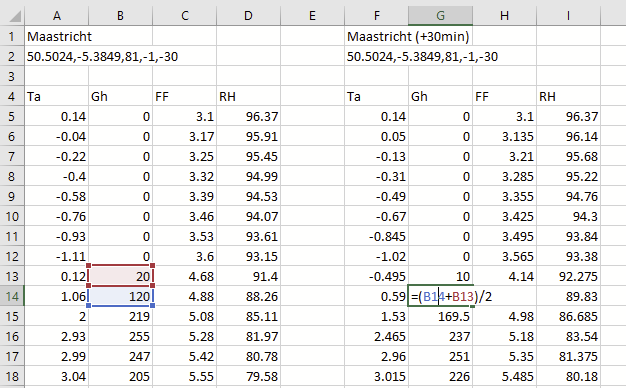
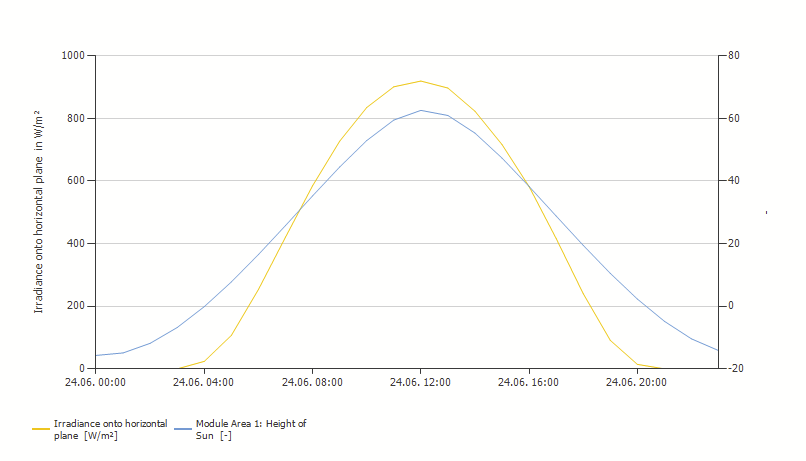
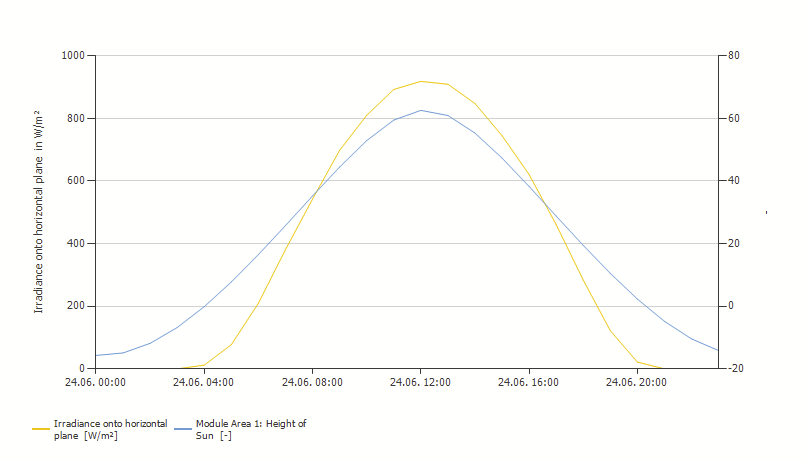
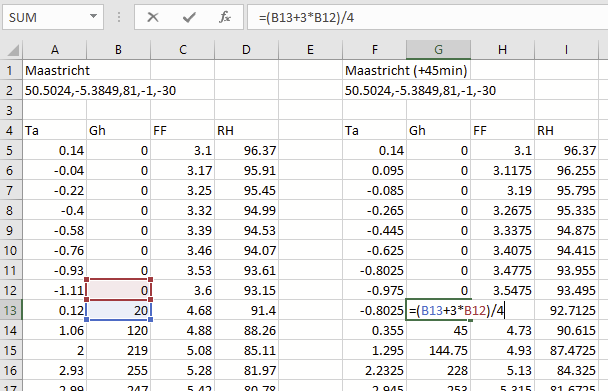
Hi Reint, thanks for the data. I imported the data as is into PV*SOL, simulated and then had a look in the diagram editor at the series "irradiance onto horizontal plane" and "height of sun". These must be synchronous. So I searched for a clear sky day, like 24.06.: As you can see, the two series are out of sync. This means the timestamp of the PVGIS has to be changed prior to the import in PV*SOL. Here, the solar irradiance seems to be araound one hour earlier than the height of sun, so we have to shift all PVGIS values one hour behind. In order to achieve that, I cut the last line of the PVGIS data and pasted it before the first line. Maastricht p1 50.5024,-5.3849,81,-1,-30 Ta Gh FF RH 0.32 0.0 3.03 96.82 //this was the last line before 0.14 0.0 3.1 96.37 -0.04 0.0 3.17 95.91 -0.22 0.0 3.25 95.45 -0.4 0.0 3.32 94.99 -0.58 0.0 3.39 94.53 -0.76 0.0 3.46 94.07 -0.93 0.0 3.53 93.61 -1.11 0.0 3.6 93.15 0.12 20.0 4.68 91.4 1.06 120.0 4.88 88.26 ... Imported and simulated, it looks like this: So, now the irradiance seems to be slightly too late. Let us revert these changes and try with a 30 min shift. If you want to shift the data by 30min, you'll have to use excel to calculate the new values: Imported and simulated the new data give this picture: That is closer, but still there is a clear offset. So let's try to shift the values by 45min. Here we go: There is still as small offset, I would say, but it is ok now. Unfortunately I couldn't find any information on the timestamp on the PVGIS website. In PV*SOL we use the same time stamp as in Meteonorm (where we get most of our climate data from). That is, January 01, 14:00 refers to the time range between 13:01 and 14:00. I attached the new climate data file, so you can import it yourself and see how the results look. Hope that helps, kind regards, Martin Maastricht 2007-2016 45min.dat
-

How is relative humidity values used in PV*SOL premium?
developer_mh replied to Bengt Stridh's topic in PV*SOL
Hi Bengt, we are excited to hear that you are working on a report comparing different software solutions for PV! We hope that you can share your findings afterwards The relative humidity is currently not used in our models for the module temperature. If you have any further questions on the modelling or other parts of the software, please don't hesitate to ask! Kind regards, Martin -
Hi Paul, in PV*SOL we have PV inverters (that cover roughly the functionality of MPP tracking and DC/AC conversion), ongrid battery systems (that cover the functionality of charging and discharging batteries and can be coupled to the system by AC coupling, DC intermediate coupling or DC generator coupling), and offgrid battery systems. So, in the case of Victron, we would have to choose if we want to analyse the ongrid or the offgrid case (both is not possible at the moment). In the ongrid case, we would enter the MPPT 250/100 as PV inverter and the Victron Quattro 15 kVA as battery system, although I am not sure how the connection of these devices is handled. Where do you connect the MPPT to the Quattro? Can you draw a circuit with both devices and PV, batteries and grid? Kind regards, Martin
- 7 replies
-
- pvsol
- add to database
-
(and 1 more)
Tagged with:
-
Hi Lukasz, the AC mains options can be changed on the page "System type, climate and grid", see our help pages for reference: https://help.valentin-software.com/pvsol/2020/pages/system-type-climate-and-grid/#ac-mains If you want to change a one-phase inverter to a three-phase inverter, you would have to create a copy of the inverter in the database and edit it accordingly. https://help.valentin-software.com/pvsol/2020/databases/components/inverters/ Hope that helps, kind regards, Martin
-
Hi patrik, thank you for your feedback. We have this feature on our list already. We understand that it would really be helpful to be able to save the mounting systems for the next project. Kind regards, Martin
-
Hi Habibullah, yes, this is correct. Kind regards, Martin
-
Hallo TomA und Tobias, könntet ihr mal einen Screenshot schicken, wo genau ihr die Wechselrichterbezeichnungen ändern möchtet? Was momentan schon geht, ist jedenfalls die Modulflächen- bzw. Verschaltungsbezeichnung zu ändern. Viele Grüße, Martin
-
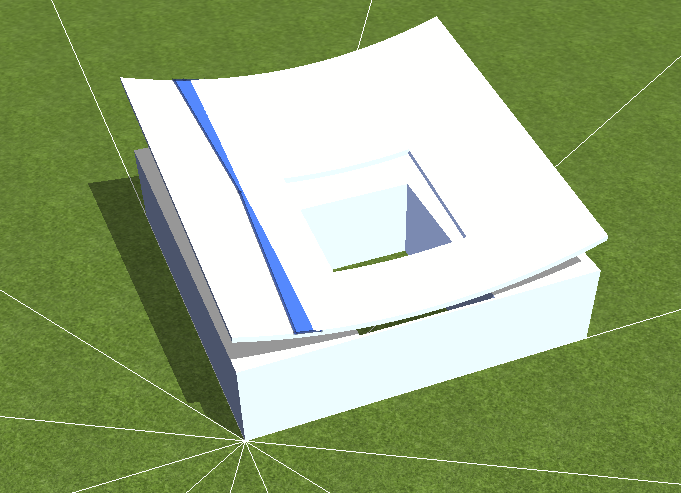
Hi Abhinav, are you participating in the Solar Decathlon Europe? Nice to see that this competition is still running. I was also participating, in the SDE 2010 edition, with Team Berlin. What a unique time! We wish you and your team all the best! ? Regarding the curved roof: It is not possible, unfortunately, to place modules on curved roofs as yours. The reason is that PV*SOL is scanning the surface for flat planes, and it only finds small sections on your roof, see for example the blue highlighted area: This is too small to place a module there. You could redesign your model in Sketchup so that the roof consists of five segments only, so that they are large enough to host a module row. Hope that helps, kind regards, Martin
-
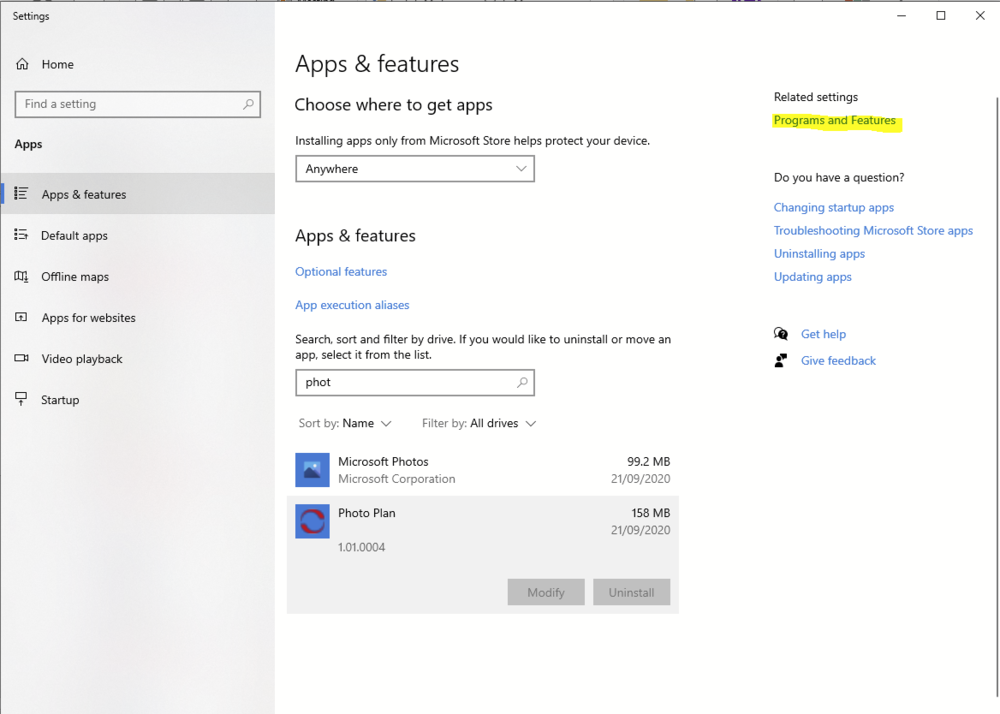
Hi Math, sorry for the late answer - I was a bit irritated as well, as the usual uninstall option seemed to have disappeared.. but then a colleague pointed me to the solution: You have to use the "old" version of the WIndows system settings feature to remove or change programs: Click on "Programs and features", search for PhotoPlan in the list, right click and select "Change". Dialogs will appear that let you uninstall PhotoPlan. Good luck, and kind regards, Martin
-
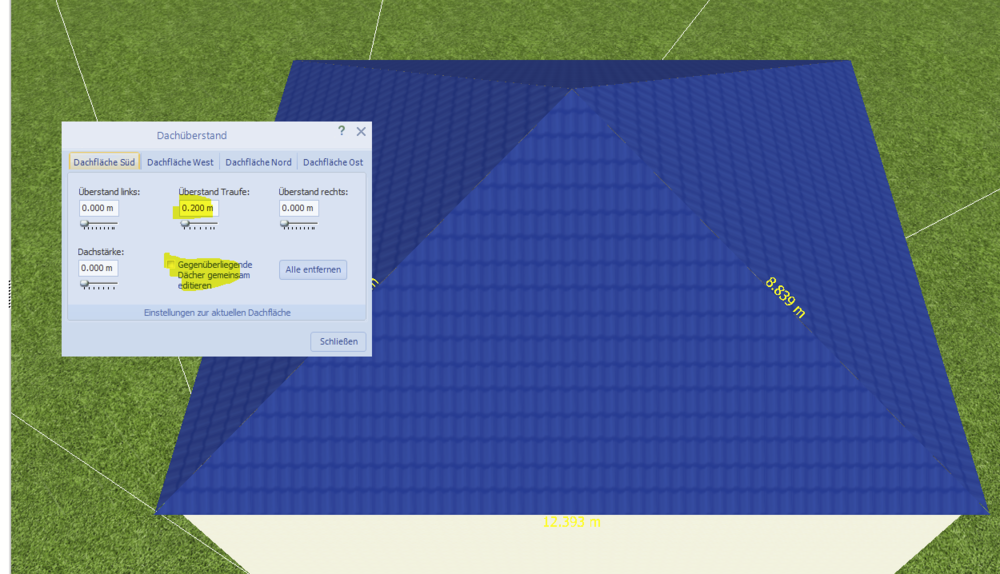
Hallo Simon, sorry für die späte Antwort - deine Frage ist irgendwie untergegangen. Den Dachüberstand kann man ganz gut für alle vier Seiten einstellen, indem man den Haken "Gegenüberliegende Dachflächen gemeinsam editieren" rausnimmt, und dann für jede Dachfläche nur den Wert für die Trauf-Überstände eingibt: Beste Grüße, Martin
-
Hi Burak, 2 MWp is really already a very large system, with about 6000 to 10000 modules depending on their power. If you use the 3D environment to design the system, PV*SOL might bring your computer to the edge of its power. Also note that PV*SOL is (still) a 32bit application, so there is a RAM limit of about 1.2 to 1.3 GB set by the operating system (Windows). This is - amongst other things - what limits PV*SOL in its capabilities. But good news is that we optimized RAM usage especially for roof top or open area mounting systems in the next release of PV*SOL premium (2020 R10), which will be released in the next days or so. If your system wasn't planned in 3D mode and you experience this kind of error, there must be some other problem. In this case I would like to ask you to send me the project file (by private message here in the forum). Kind regards, Martin
-
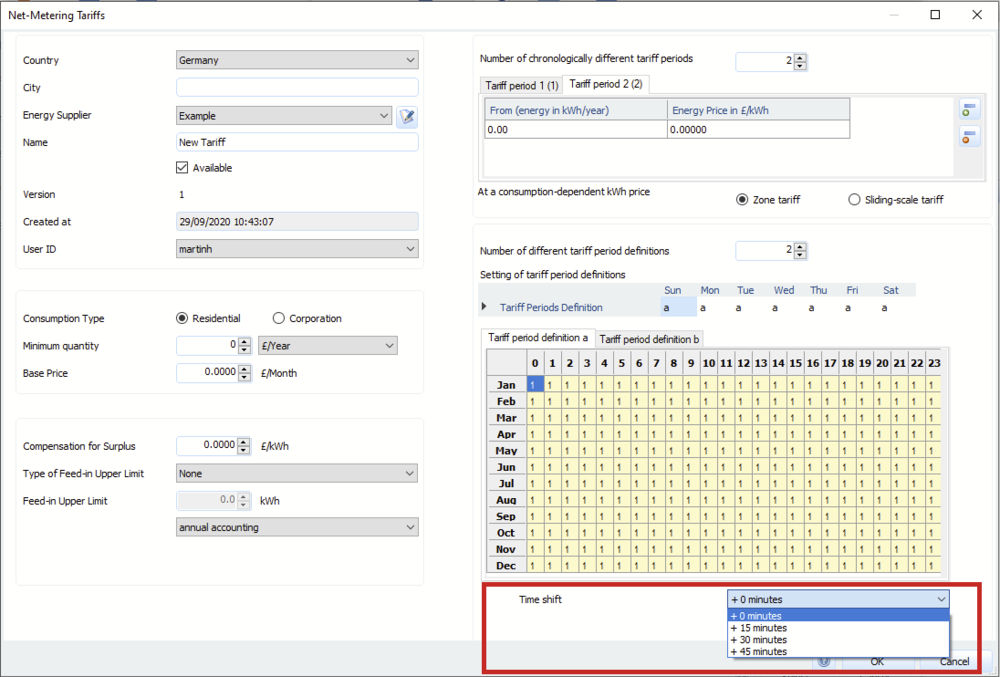
Dear Hugo, thank you for the input. We already have this feature request on our list. For very regular time shifts by 15 minutes you could use this feature here: But we know that this doesn't cover every tariff design (like yours for example). In order to estimate the cost effects of the 15 time shift, you could simulate it once with 0 minutes shift, and once again with 15 minutes. This should give you an idea of how the economics will behave. Kind regards, Martin
-
Hey Miguel, the lifetime of the batteres is influenced by two effects: cycle loads and time. So there are the "cyclic lifetime" and the "calendar lifetime", the first of which we can calculate, and the second is more a number that is given by the manufacturer (determined by tests). The calculation of the cyclic lifetime is described here (at the end of that page, applies also for li ion batteries: https://help.valentin-software.com/pvsol/2020/calculation/battery-systems/lead-acid-batteries/ According the standards, we consider a battery as "dead" when it has reached 80% of its initial capacity. It is then replaced by a fresh one. Hope that helps, kind regards, Martin
-
Hi Joao, that is correct, our simulation core doesn't support simultaneous DC and AC coupling modes. We have it on our list but we can't give a scheduled date for that feature, I am afraid. In fact, there are a plenty of device topologies and most of all energy management algorithms implemented in battery systems available on the market that we are not able to reproduce in our simulation core. As you pointed out, the topology of a system, but also the management algorithms can heavily influence the energy flow through the system. We are aware of that and as I mentioned, we have that topic already on our list. But at least we hope that the user interface of the software and the help files are always clear about what we are calculating, so that there should be misunderstandings. Kind regards, Martin
- 1 reply
-
- fronius
- ac/dc battery coupling
- (and 5 more)
-
ps: die Quellenangaben zu den anderen Lastprofilen werden wir demnächst in der Hilfe beschreiben, danke fürs Drauf-Aufmerksam-Machen, dass da was fehlt. Viele Grüße, Martin
-
Hallo Leman, in diesem Fall würden wir stark zur Nutzung der Lastprofile in der ersten Kategorie raten - Lastprofile aus Messwerten. Dort gibt es auch Lastprofile von der HTW Berlin und dem BDEW, die bestens dokumentiert sind: https://pvspeicher.htw-berlin.de/veroeffentlichungen/daten/lastprofile/ https://www.bdew.de/energie/standardlastprofile-strom/ Diese sind auch von der Auflösung her qualitativ höherwertig. Viele Grüße, Martin
-
Hi Alexander, es handelt sich bei dem Absturz nicht um ein Performance-Problem, sondern um einen (zum Glück seltenen) Fehler bei der Zuordnung von Modulen und deren Schatten in 3D zu den Wechselrichtern. Für neue Fragen gerne einen neuen Thread erstellen, so bleiben sie auch für andere besser auffindbar. Danke! Viele Grüße, Martin


