developer_mh
-
Posts
1,860 -
Joined
-
Last visited
-
Days Won
173
Everything posted by developer_mh
-
Hi Tobias, try deleting the tab space before DEU, then it should work. Kind regards, Martin
-
Hi Esteban, yes, when you use your own climate data, the ambient temperature (or environment temperature) must be included. In the simulation we then model the cell temperature based on the irradiance values and the environment temperature, depending on the installation type. The module temperature is then used as input for the electrical modelling of the PV devices which is of course also calculating the open circuit and MPP voltages. Actually, we are calculating the complete IV curve for every time step of the simulation, and that is always dependet on the actual irradiance that is incident on the module's surface and the module temperature. If you want to know about the IV modelling, our help document would be a further source of information. Kind regards, Martin
-

Vorgehen zur schnellen Simulation einer aufgeständerte Ost-West-Anlage
developer_mh replied to e4plus's topic in PV*SOL
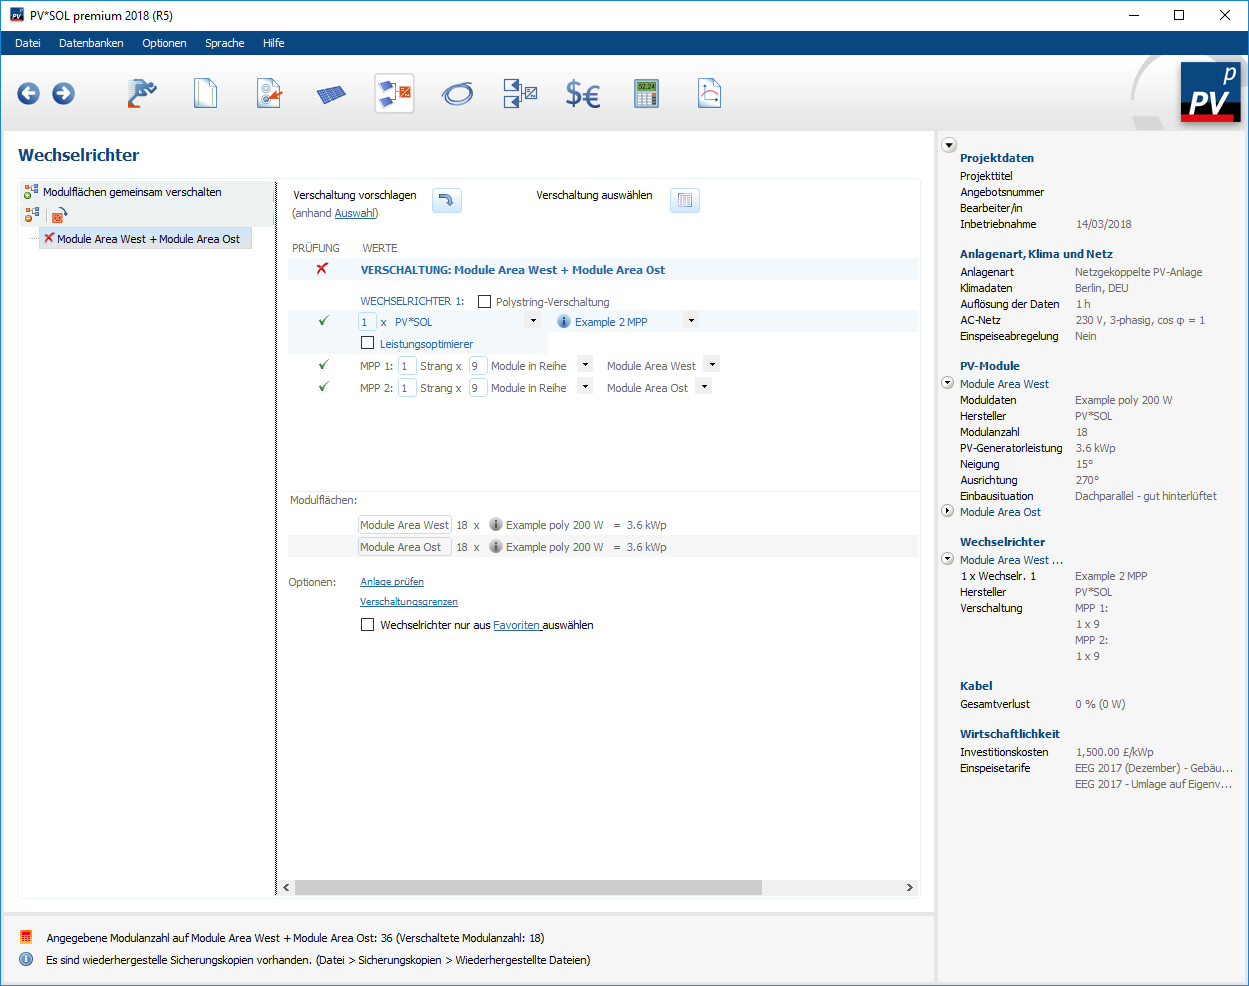
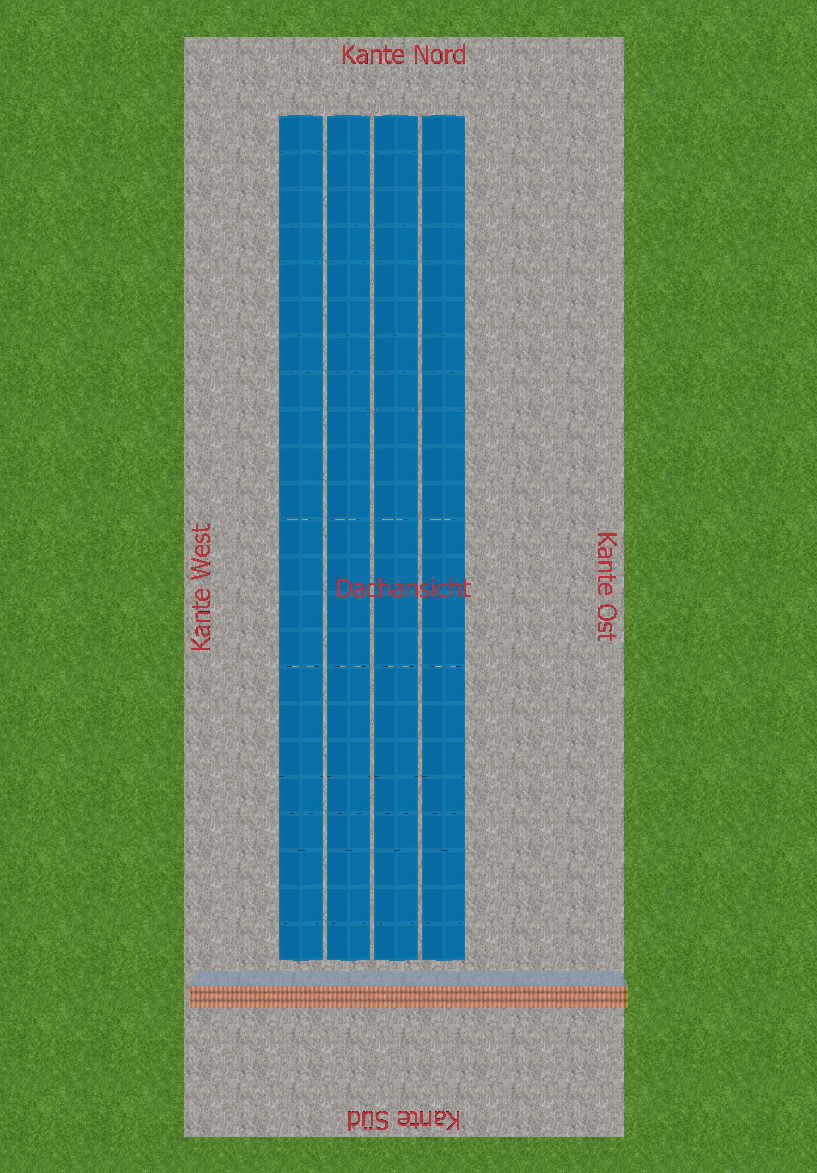
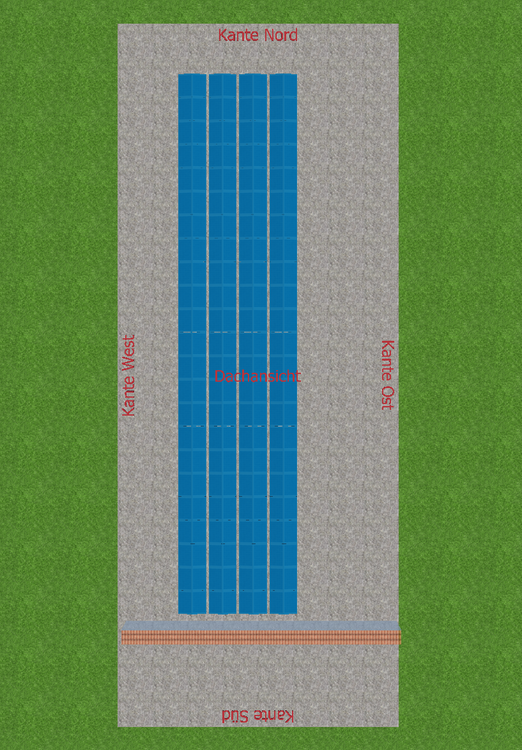
Hallo dag, ja, das geht auch in PV*SOL, also ohne 3D. Einfach zwei Modulflächen definieren, von denen die eine nach Westen und die andere nach Osten orientiert ist: Dann auf der Seite Wechselrichter beide Modulflächen selektieren und auf "Modulflächen gemeinsam verschalten" klicken: Dann kann manuell oder mit "Verschaltung vorschlagen" eine gültige Verschaltung erstellt werden: Hoffe, dass das weiterhilft! Beste Grüße, Martin


-
Hi Stuart, you will have to draw outline of the building yourself and then you can extrude it. There is also a small youtube tutorial: Kind regards, Martin
-
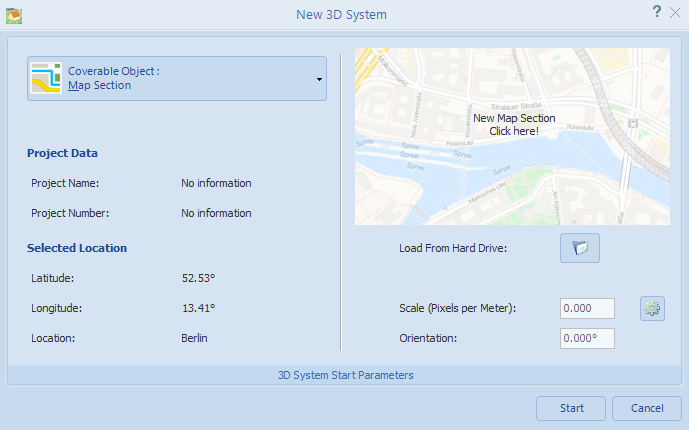
Hi Stuart, yes, it is possible, but you would have to convert the pdf to an image before that. Jpg, bmp and png are accepted in the map section in 3D, use the option "Load from Hard Drive": Kind regards, Martin
-
Hi Josephine, you should be able to find it in the list of climate data locations on the page "System type, climate and grid": But I think you have already looked for it there. Sometimes it can happen that a custom climate data set is assigned to the wrong country, since we use the location coordinates (latitude and longitude) for that. So first you'll have to check that your coordinates are right, i.e. corresponding to this post - and mind the negative longitude: Then, if you are sure that the coordinates are correct, and the software is still not assigning the country correctly, you can add the three-letter country code with a semicolon after the location name: Skjetlein; SWE 63.2027,-10.1802,512,-1,-30 Ta Gh FF RH 4.2 0.0 2.0 69.0 2.9 0.0 1.7 77.4 1.7 0.0 0.2 84.4 1.4 0.0 0.0 87.8 1.3 0.0 0.2 91.0 1.0 0.0 1.4 92.7 ... Hope that helps, kind regards, Martin

-
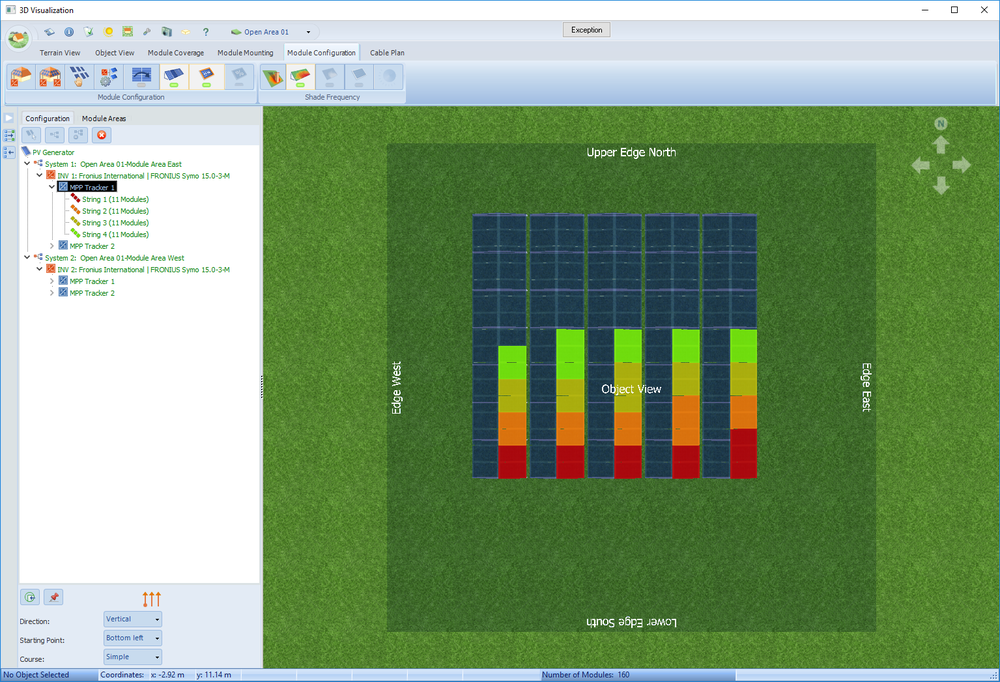
Hi Dajana, I am not sure if I understand your question correctly, but yes, when you have east-west systems, you can choose to (and you should) have all your modules facing east in one string and all modules facing west in the other. See this example: Here, I just connected all modules facing east to one inverter with 2 MPPT, and all modules facing west to another. Does that answer your question? If not, please don't hesitate to ask again. Kind regards, Martin
-
Hi linqyueqing, I think you should ask your question to experts from Cypress directly, we are no experts in powerline communication devices. For the noise of battery banks in the 100kHz range you should contact the manufacturer of the battery inverter, I guess. Good luck with your project, Martin
-
Ja, das ist wirklich eine spannende Frage. Die Kosten für die Leistungsoptimierer lägen bei 800 € (16 St. * 50 €), während die höhere Vergütung über 20 Jahre etwa 937 € ausmachen würde (mit einer Vergütung von 0,122 €/kWh gerechnet). denke ich auch. Was noch für Leistungsoptimierer sprechen könnte, wäre, dass wenn die Module mit der Zeit unterschiedlich stark degradieren, sie dann diese eventuellen späteren Mismatch-Verluste auffangen könnten. Was wiederum gegen die Leistungsoptimierer spricht, ist, dass ja auch sie ein Ausfallrisiko haben und evtl im Lauf der Zeit ersetzt werden müssen. Ich fürchte, es sind noch keine Anlagen mit modernen Leistungsoptimierern 20 Jahre am Netz, so dass man belastbare Aussagen machen könnte. Immerhin sind wir jetzt schon mal soweit, dass wir die Effekte der Leistungsoptimierer mit ihren Potenzialen und ihren Nachteilen darstellen können. Viele Grüße, Martin
-
Hallo JLA, interessante Frage, die leider nicht so pauschal zu beantworten ist. Es gibt prinzipiell erstmal zwei Dinge zu beachten: Die Darstellung der Schattenhäufigkeit in 3D ist keine Angabe über den Ertragsverlust am Ende des Jahres. Natürlich gibt es einen Zusammenhang zwischen beiden Größen, aber für den Ertragsverlust ist eben auch wichtig, wo hoch zum Zeitpunkt der Verschattung die gesamte Einstrahlung (Globalstrahlung) und der diffuse Anteil ist. Ist zum Beispiel ein Modul morgens voll verschattet, aber zu diesem Zeitpunkt die Globalstrahlung nur gering, wird das für den Ertrag übers Jahr nicht viel ausmachen. In diesem Fall würde sich auch ein Leistungsoptimierer nicht lohnen. Um das herauszufinden, ist es hilfreich, sich in der 3D Umgebung mit Hilfe des Sonnentools die Schatten zur Mittagszeit zwischen Frühjahr und Herbst anzuschauen. Die Module, die in diesen Zeiten von Schatten betroffen sind, können in der Regel von Leistungsoptimierern profitieren. Dabei profitieren teilverschattete Module natürlich mehr als vollverschattete, aus denen auch Leistungsoptimierer nichts mehr rausholen können. Auch Leistungsoptimierer haben Verluste Ist banal, wird aber trotzdem oft vergessen. Leistungsoptimierer sind wie MPP-Tracker und DC/DC-Wandler und haben ihrerseits Wandlerverluste. Wenn also eine unverschattete Anlage mit Leistungsoptimierern ausgestattet wird, bringt sie weniger Ertrag übers Jahr als eine Anlage ohne. Wann sich jetzt ein Leistungsoptimierer energetisch rechnet, das heißt, ab wann er mehr Energie aus den Modulen holt als er selbst verbraucht, kann man leider so pauschal nicht sagen. Deswegen muss ja simuliert werden Aber man muss eben in der Jahresbilanz vor Augen haben, dass Leistungsoptimierer den Ertrag auch nach unten schrauben können. Das heißt, das Vorgehen, das du scheinbar bei deinem Projekt angewendet hast, ist sehr sinnvoll. Einmal die Anlage ohne Leistungsoptimierer rechnen, dann die eindeutigen Module mit Leistungsoptimierern versehen, und dann nach und nach probieren, wo weitere Leistungsoptimierer etwas bringen. Viele Grüße, Martin
-
Ok. We could try the following. Clean your temporary project folder again C:\Users\USERNAME\AppData\Local\Temp\Valentin EnergieSoftware\PVSOL premium 2018\ Then save the project under a different name. Then please go to the most recent folder in the folder indicated above, and zip it. But not the folder with an "T" in the end. Then send both the freshly saved project file and the zip file to me (private message). There must be something corrupt somewhere. Kind regards, Martin
-
Hi Dajana, this is difficult to understand what is going on there. There must be something that prevents PV*SOL from writing simulation results to the hard drive. Perhaps there is an antivirus program installed that is doing this? Could you try to temporarily disable your antivirus program and try again? Or, better, just allow the path given above and the exe under C:\Program Files (x86)\Valentin EnergieSoftware\PVSOL premium 2018\ Another possibility would be that the disk is full, but since your colleague is experiencing the same, this is unlikely. Kind regards, Martin
-
Hallo Jarn, ja, es sind mit der Zeit viele praktische neue Features dazu gekommen. Evtl kommst du in der alten Version auch zurecht mit dem automatischen Verschalten, wenn du ein bisschen mit der Sortierungs-Reihenfolge spielst (siehe unten). Ansonsten würde ich dir wirklich ein Update ans Herz legen. Kannst ja auch mal in die Release Notes schauen, was seitdem alles dazugekommen ist: https://www.valentin-software.com/support-service/kundenservice/release-notes/pvsol-premium
-
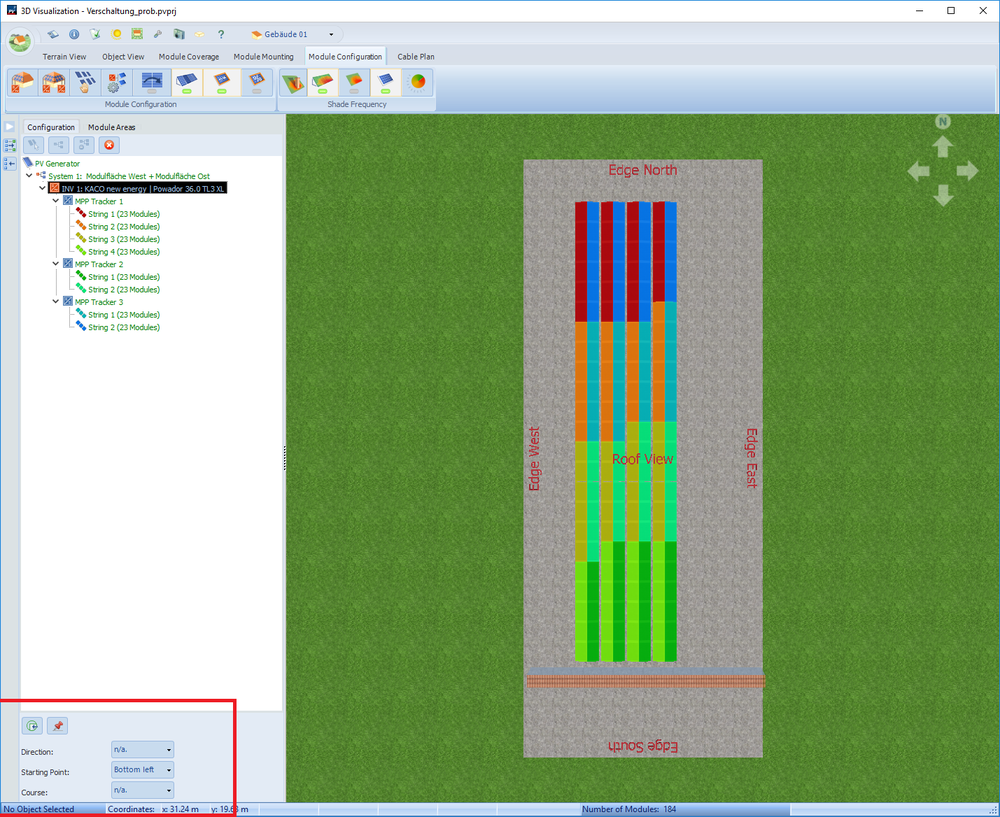
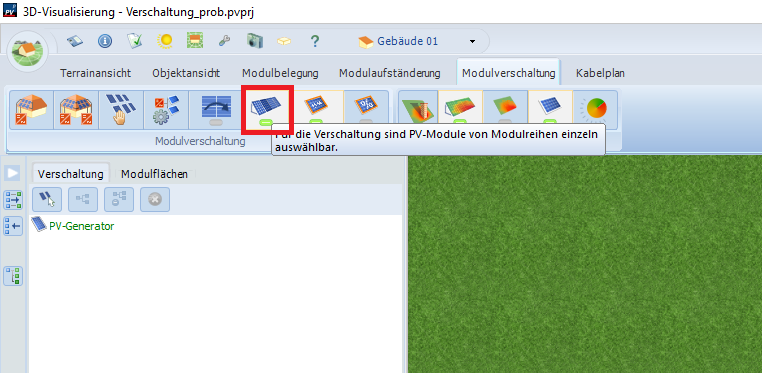
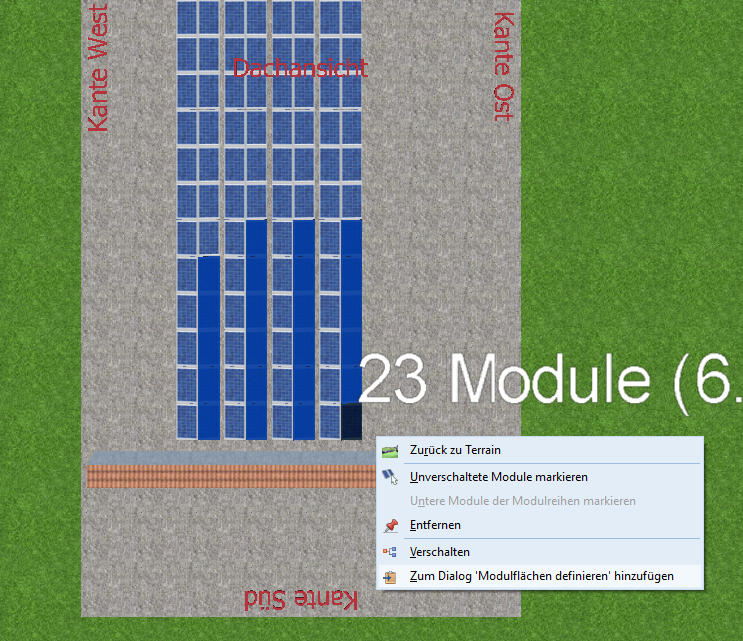
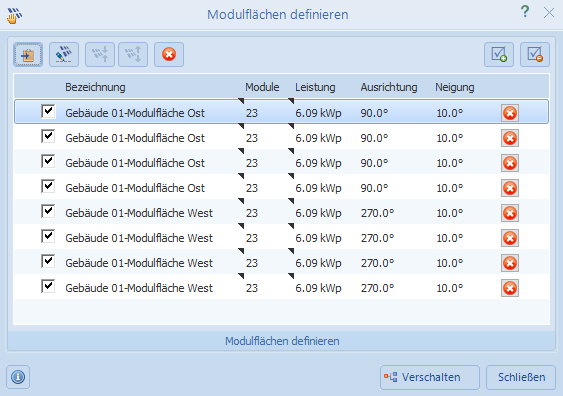
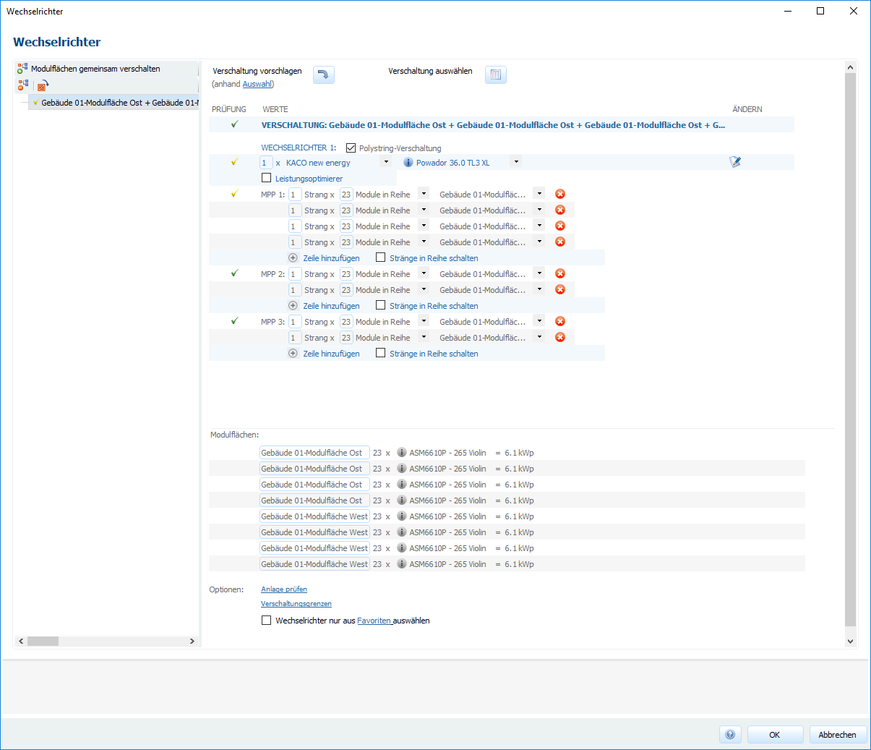
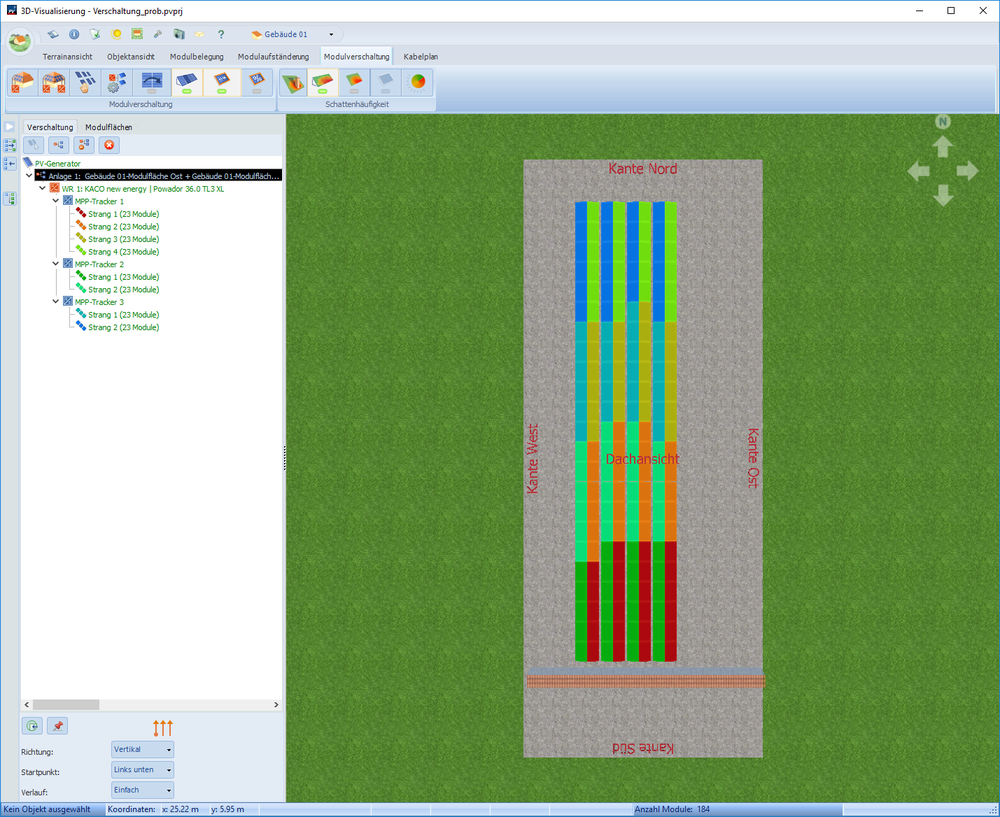
Hallo Jarn, danke für das Projekt. Ich glaube, dass das, was du machen willst, sehr viel einfacher geht, wenn du nicht vorher automatisch belegst und dann die Zuordnung tauschst, sondern direkt die Modulflächen manuell verschaltest (das war ja auch Teil deiner Frage in der privaten Nachricht). Ich antworte dir auf Basis von PVSOL premium 2018 R4, ich hoffe, das ist in Ordnung. 2016 R4 ist zu lange her Also, wenn noch nichts verschaltet ist, gehst du auf die Seite Modulverschaltung und aktivierst die Auswahl einzelner Module: Dann markierst du die Module, die an einen Tracker sollen, und wählst über einen Rechtsklick "Zum Dialog 'Modulflächen definieren hinzufügen'" Das wiederholst du für alle Module, ich hab jetzt mal immer 23 genommen, wie in deinem Beispiel. Dann sollten alle Module hellblau erscheinen: Dann öffnest du den Dialog "Modulflächen für die Verschaltung definieren", wo du eine Übersicht über alle manuell hinzugefügten Modulflächen bekommst: Dann auf "Verschalten" gehen, alle Modulflächen selektieren und dann auf "Gemeinsam verschalten". Hinweis: Bei dieser Anzahl an Modulflächen wirst du zuerst die Option Polystring aktivieren müssen, da der Kaco Powador 36.0 TL3 XL nur 4 MPP Tracker hat. Die Polystring-Option ist sehr komfortabel, aber erst seit Version 2018 R1 in P*VSOL premium. Das heißt, du müsstest entweder updaten (was sowieso empfehlenswert ist, es gibt auch eine 30 Tage Testversion), oder du selektierst nicht immer nur 23 Module auf einmal, sondern entsprechend größere Gruppen. Also, wenn du dann alle Module in deiner Verschaltung hast, wählst du den Wechselrichter und weist die Modulflächen den MPP-Trackern zu: In der Verschaltungs-Übersicht sieht das dann so aus: Wunderbar einfach und schön aufgeräumt Hilft das so weiter? Viele Grüße, Martin
-
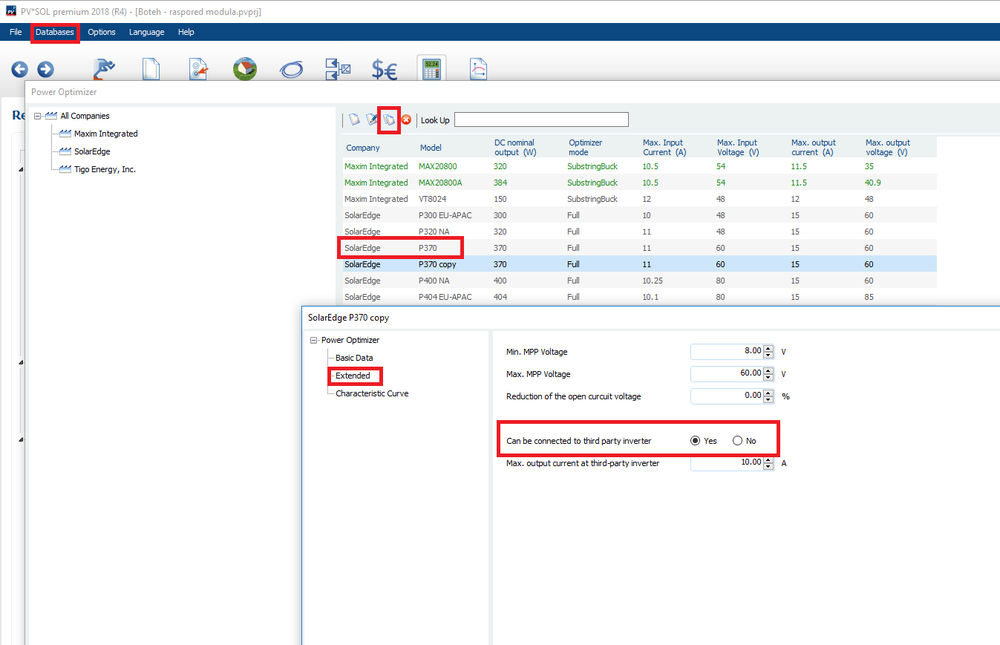
Hi Dirk, this message does not affect the simulation results, no. But SolarEdge recommends to use P350I optimizers (as you pointed out) that feature the IndOP technology. However, they seem to have removed them from our database, for marketing reasons I guess. But you can easily create the P350I yourself. Just go to Databases > Power Optimizers, select SolarEdge and choose a similar PO, let's say the P370. Then click on "Copy Selection" and adjust the values as needed. There is an option on the page "Extended", called "Can be connected to third party inverter". This you need to check. Then you can use this PO with E3DC inverters. Hope that helps, kind regards, Martin
-
Hallo Jarn, freut mich, dass das mit den Schatten jetzt geklappt hat. Ich hab das Thema jetzt mal in das deutsche Forum verschoben, danke für den Hinweis. Wenn du möchtest, kannst du den zweiten Teil deiner Frage auch in ein neues Thema verschieben, muss aber nicht sein. Das Projekt bleibt ja das gleiche. Um deine Frage mit der Verschaltung nachzuvollziehen, wäre es einfacher für mich, wenn ich das Projekt hätte. Könntest du es mir schicken (gerne auch als private Nachricht). Beste Grüße, Martin
-
Hi dajana, this is strange. When I simulate your project, I can see all results, diagrams and everything. So this means there is nothing wrong with your project. Perhaps you should try to empty this folder: C:\Users\USERNAME\AppData\Local\Temp\Valentin EnergieSoftware\PVSOL premium 2018\ Check, if you have enough space free on your hard disk and perhaps try to reinstall PV*SOL premium 2018 R4. Let me know if this helped, Martin
-
Hmmm, this is odd.. could you send me your project file?
-
Hallo Jarn, genau solche Anlagen sind eine Stärke von PV*SOL, du kannst solche Anlagen bestens damit abbilden. Um deinen Effekt möglichst gut in den Ergebnissen zu sehen, solltest du sicherstellen, dass der Schatten überhaupt zu relevanten Uhrzeiten (mittags im Sommer) deine Module trifft. Wenn du also die Mauer ein wenig näher an die Module schiebst, sodass tatsächlich Schatten auftritt, kannst du in den Ergebnissen mit Sicherheit auch den Unterschied sehen. Die Ströme und Spannungen werden in PVSOL bis auf die Substring-Ebene betrachtet, es wird also für jedes Modul eine eigene Kennlinie berechnet und diese werden dann je nach Verschaltung überlagert. Hier dazu mehr: Beste Grüße und bei Fragen immer fragen! Martin
-
If nothing happens when you click the "simulation" button, you could edit the project temporarily, e.g. change the cabling losses percentage, then simulate and then change the cabling losses back to the original value. But normally you should be able to just click this button. Could you tell me which version of PV*SOL you are running? Kind regards, Martin
-
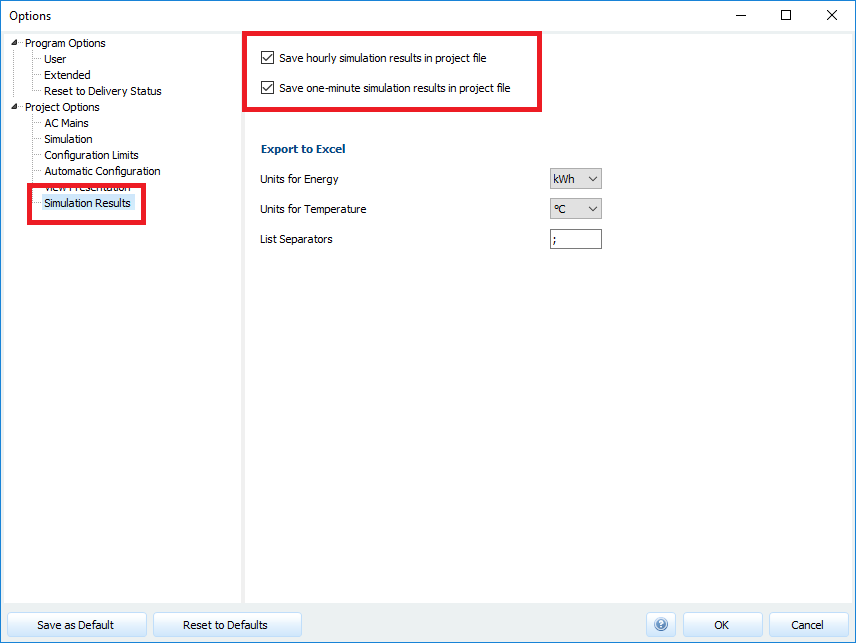
Hi Dajana, you can choose wether you want to save the hourly or one-minute simulation results in your project files or not. If you choose not to save them, the overall results like yearly and monthly values will be saved anyway, so that the results page can be displayed also on the computer of your colleagues. If they want to see the hourly results then, they have to re-run the simulation on their computers. The option can be found at the menu bar -> Options -> Project Options (or Ctrl + P). Then go to "Simulation Results" and check these boxes: Concerning your other question: If you choose to simulate your PV system with one-minute irradiance values, they will be synthesized from hourly values. The sum of the 60 one-minute irradiance values per hour is exactly equal to the hourly value, so there can't be any difference in the input data for the simulation, that is for the global horizontal irradiance. What can happen, however, is that the resulting irradiance on the tilted module plane is different in the end compared to the simulation with hourly values. But the one-minute irradiance values are more precise, so you should not be worried. Hope that helps, kind regards, Martin
-
Hi Alberto, thank you for your understanding. In the meanwhile we will try to make this process easier for our customers. I think chances are that in future it will be possible to have different inverter configurations on combined module areas. Thanks for your feedback! Martin
-
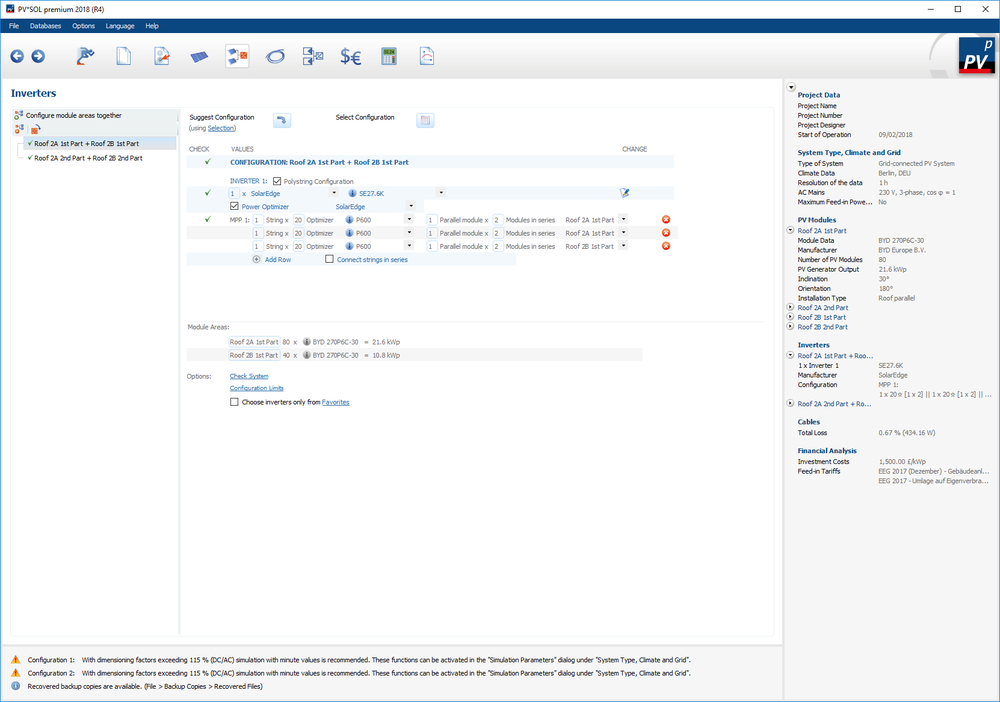
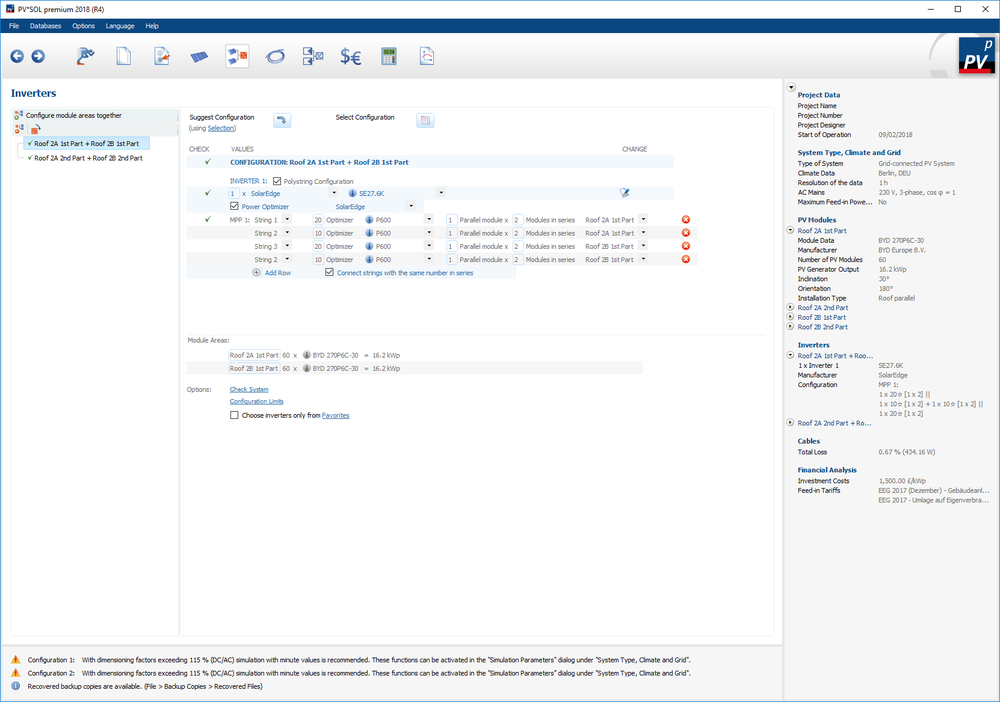
Hi Alberto, I understand the problem. When you configure two module areas together, you can connect them to one inverter, no problem. You could also increase the amount of the inverters, but then all will have the same string configuration. You can't, however, have two different inverter setups directly on two module areas that you configure together. I know that this is possible in reality, but right now our configuration manager is not capable to doing this. But you can do it manually with a little preparation: You would need to split your module areas 2A and 2B before connecting them. Let's say you want to connect one part of 2A and one part of 2B together to one inverter, and then the other parts to another inverter. You could solve it like this: Here, my module areas 2A and 2B had 120 modules each. I separated them on the page "PV Field" into four module areas: "2A 1st part" with 80 modules "2A 2nd part" with 40 modules "2B 1st part" with 40 modules "2B 2nd part" with 80 modules Then I go to the page "Inverter" and select "2A 1st part" and "2B 1st part" and "Configure module areas together". The same for "2A 2nd part" and "2B 2nd part". Then you can configure each pair of module areas with their respective inverter. Of course you could also split the module areas in parts with 60 modules each and connect them as follows, using the "Connect strings with the same number in series" feature: Does that help? Please let me know if that enables you to design your system. Kind regards, Martin
-
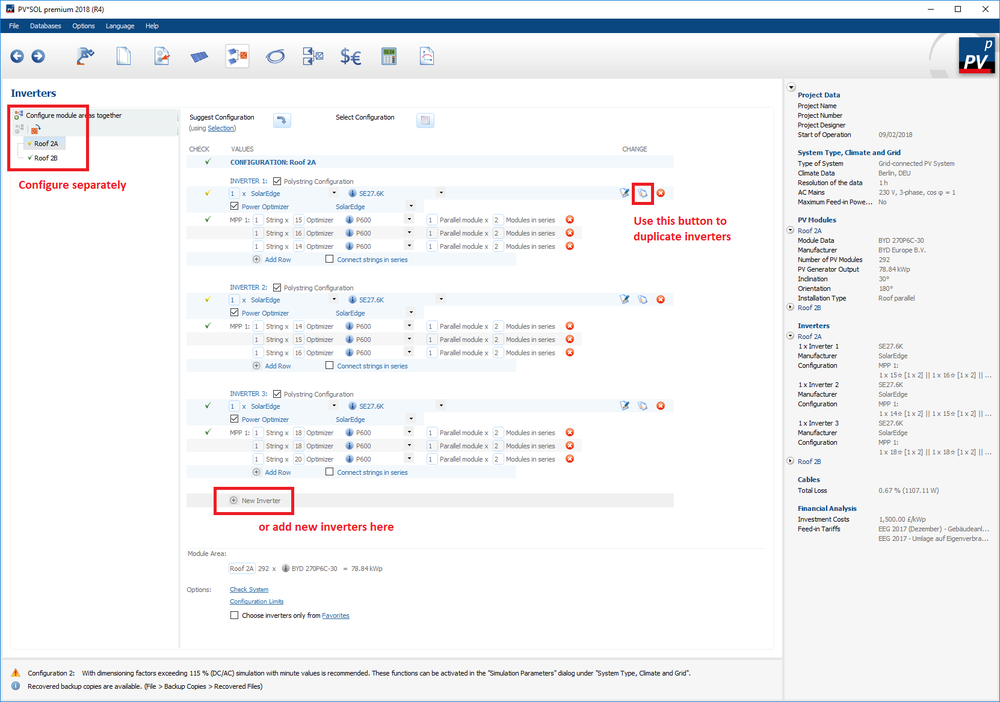
Hi Alberto, when you configure two module areas together, the option to have multiple configurations is disabled and the icon to duplicate the inverter configuration is hidden. If you want to have multiple configurations with varying string length, you can do so if you configure the module areas separately: Hope that helps. If you have any further questions, please let me know. Kind regards, Martin
-
Hi Ralph, thanks a lot for your input, we will check those modules. In general, our colleagues at database@valentin-software.com are always a good contact for those topics. The normal procedure is as follows: They will identify the missing or erroneous modules and contact Trina to have them input or correct their module data. When new module data are available, we will publish a database update that every user can run (you will be notified). For part 2) of your question: The part load (or weak-light) data is also entered by the manufacturers. Often they have more measurement points than just STC, so they can easily provide these values. If they don't have them, we will use default values which are more on the conservative side, and will thus result in lower annual yields. Hope that helps, kind regards, Martin