developer_mh
-
Posts
1,860 -
Joined
-
Last visited
-
Days Won
173
Everything posted by developer_mh
-
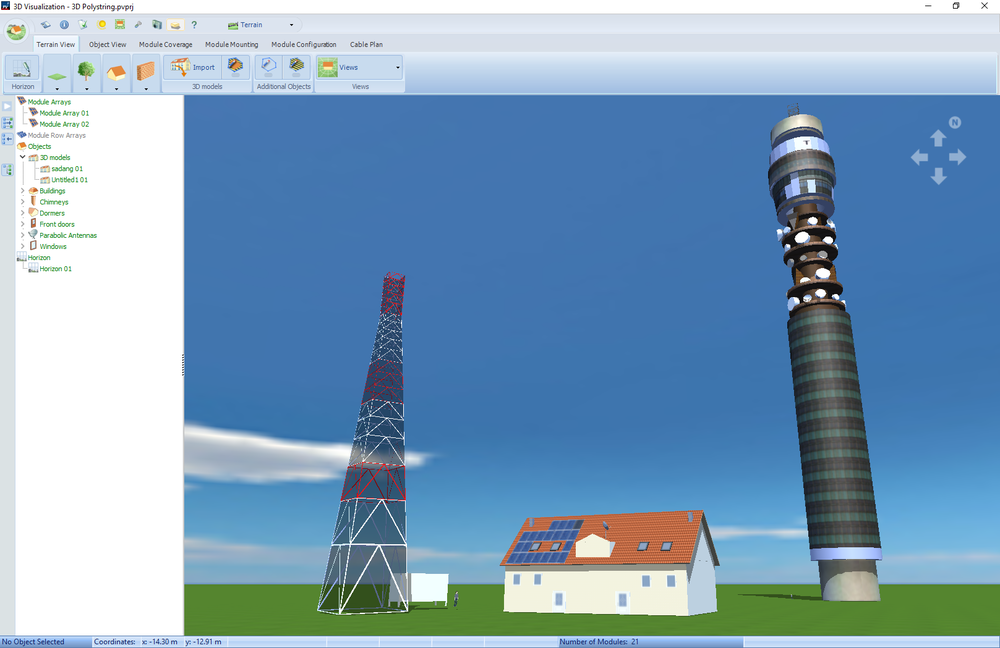
Hi, just a short update: In the meanwhile it is possible to import a number of 3D model formats directly in PV*SOL premium (from version 2018 on): https://www.valentin-software.com/en/news/product-news/new-pvsol-premium-2018-import-3d-models So, you can also search for BTS towers on the net and import them in PV*SOL premium 2018, like this (two examples from the Sketchup Warehouse): Martin
-
Hi, just a short update: In the meanwhile we fully overhauled the design and simulation of PV plants with power optimizers, both module integrated (like Maxim) and external (like SolarEdge or Tigo). It is available in PV*SOL premium 2018. https://www.valentin-software.com/en/news/product-news/new-pvsol-premium-2018-import-3d-models Martin
-
Hi, just a short update: In the meanwhile we fully overhauled the design and simulation of PV plants with varying module areas. You can now build any configuration you want with the new 'Polystring feature'. For example: Two module areas on one MPP tracker Different module types in one string Parallel connection of strings with different number of modules etc etc It is available in PV*SOL premium 2018. https://www.valentin-software.com/en/news/product-news/new-pvsol-premium-2018-import-3d-models Martin
-
Hi, just a short update: In the meanwhile it is possible to import a number of 3D model formats directly in PV*SOL premium (from version 2018 on): https://www.valentin-software.com/en/news/product-news/new-pvsol-premium-2018-import-3d-models Martin
-

Connection Of Two Diffrent Roofs (Inverter Connction)
developer_mh replied to emre kaynak's topic in PV*SOL
Hi, just a short update: In the meanwhile we fully overhauled the design and simulation of PV plants with varying module areas. You can now build any configuration you want with the new 'Polystring feature'. For example: Two module areas on one MPP tracker Different module types in one string Parallel connection of strings with different number of modules etc etc It is available in PV*SOL premium 2018. https://www.valentin-software.com/en/news/product-news/new-pvsol-premium-2018-import-3d-models Martin -
Hi, just a short update: In the meanwhile we fully overhauled the design and simulation of PV plants with varying module areas. You can now build any configuration you want with the new 'Polystring feature'. For example: Two module areas on one MPP tracker Different module types in one string Parallel connection of strings with different number of modules etc etc It is available in PV*SOL premium 2018. https://www.valentin-software.com/en/news/product-news/new-pvsol-premium-2018-import-3d-models Martin
-
Hi, just a short update: In the meanwhile we fully overhauled the design and simulation of PV plants with power optimizers, both module integrated (like Maxim) and external (like SolarEdge or Tigo). It is available in PV*SOL premium 2018. https://www.valentin-software.com/en/news/product-news/new-pvsol-premium-2018-import-3d-models Martin
-
Hi Craig, thanks for your screen shots. This looks like a problem with you printer drivers. The tool we use for creating pdf and docx relies on them. Do you have the possibility to try this on a machine that doesn't have printer issues? Kind regards, Martin
-
Hi Mr. G, do you have some screenshots for us perhaps? And some information on the software version you use (PV*SOL premium 2018 R1, R2, R3 or R4?), with which version the project was created and if the project simulates before you go to the presentation page. Thanks a lot in advance, Martin
-
Hi Kamal, yes, sorry, I forgot to mention that these features are only available in the new version of the software, PV*SOL premium 2018. If you don't have this version but only 2017, I would highly recommend to update it, since there are a lot of useful new features now. And if you update via a software maintenance contract, it is really not expensive: https://www.valentin-software.com/en/sales-service/customer-service/software-maintenance Kind regards, Martin
-
Hi Kamal, this is a very nice demonstration project you sent there - it is perfect for polystring configuration and the use of power optimizers. Here is how you do it: In the 3D environment, you have to go the page "module configuration". There you click on the second button from the left, "Configure all unconfigured modules". In the "inverter" dialog, select all module areas on the left (hold ctrl down while selecting, so you can select them all together) Click on "Configure module areas together" above the module area list In the configuration view on the right, check "polystring configuration" next to Inverter 1 Choose the inverter you want from the list (first the company "E3DC", then the model "S10 Mini All in One") You want power optimizers as well, so you check the "Power optimizer" option underneath the inverter selection Then you see the two MPP trackers, on which you can connect your module areas. You will want to connect the two areas facing south west together on one MPP tracker, and the other two areas, facing south east, to the other To do so, you add a row to each of the trackers (by clicking "Add row" underneath the string list of the respectuve tracker) Then, in MPP 1, in the first line, type in 8 power optimizers since you have 8 modules on module area 1. Select module area 1 at the end of the line In MPP 1, second line, type in 6 power optimizers since you have 6 modules on module area 4 (the other south east facing area). Select module area 4 at the end of the line In MPP 2, in the first line, type in 5 power optimizers since you have 5 modules on module area 2. Select module area 2 at the end of the line In MPP 2, second line, type in 6 power optimizers since you have 6 modules on module area 3 (the other south west facing area). Select module area 3 at the end of the line So, now you have a valid polystring configuration with power optimizers! In your case I would recommend to connect the strings in series to reach higher voltage values and to avoid too small currents. So check the option "connect strings in series" for both MPP trackers. Then click OK and it is done I also made a short video for that, you can see it here (it is not publicly available right now): Edit: We made another video tutorial for polystring connection and power optimizers, based on your project (thanks a lot!): Since it is really a nice tutorial case, we wanted to ask you if we can use your project for making a publicly available tutorial video of it? Thanks a lot in advance and good luck with your project! Martin ps: and sorry for the late answer, somehow I have not received the notification for your post, so I did not see it earlier..
-
New PV*Sol 2018 is excellent, some small problems.
developer_mh replied to jamesbm's topic in PV*SOL
Hi all! We have compiled a short information sheet for importing 3d models in PV*SOL: https://www.valentin-software.com/sites/default/files/downloads/sonstiges/en/3d-recherche-rev-01-en.pdf For Sketchup the following applies: We found out that the import and the shading calculation in PV*SOL works best when the objects in Sketchup are defined as volume objects (this is the case when you see a volume in the object properties in Sketchup). Hope that helps, if you encounter any problems, please let us know! Kind regards, Martin -
pv*sol Does this program have ESS Schedule Function ?
developer_mh replied to YJ Jeong's topic in PV*SOL
Hi YJ Jeong, right now a scheduling function for the battery (energy) storage systems (ESS) is not implemented. The battery systems will be charged with PV power when it is available, that means when loads are covered and there is still energy left. When the batteries are full or the connection power is not sufficient, the rest of PV power will be fed in into the grid. For future releases we will implement a scheduling function, since the demand is growing on the side of our customers. Kind regards, Martin -
Hi Diogo, no, unfortunately it is not possible to import the diffuse irradiance as well. But we have it on our list for the future. In the new version of PVSOL premium (2018 R1) that will be released in the next days, there will be new models for the diffuse irradiance, so that you can choose which one fits your measurements best: Hofmann (developed by us, the new standard model) Hofmann, M., & Seckmeyer, G. (2017). A New Model for Estimating the Diffuse Fraction of Solar Irradiance for Photovoltaic System Simulations. Energies, 10(2), 248. https://doi.org/10.3390/en10020248 Reindl with reduced correlation (only this model was available in previous versions PV*SOL®) Reindl, D.T.; Beckmann, W. A.; Duffie, J.A.: Diffuse fraction correlations; Solar Energy; Vol. 45; No. 1, S.1.7; Pergamon Press; 1990, http://dx.doi.org/10.1016/0038-092X(90)90060-P Orgill & Hollands Orgill, J. F., & Hollands, K. G. T. (1977). Correlation equation for hourly diffuse radiation on a horizontal surface. Solar Energy, 19(4), 357–359. https://doi.org/10.1016/0038-092X(77)90006-8 Erbs, Klein & Duffie Erbs, D. G., Klein, S. A., & Duffie, J. A. (1982). Estimation of the diffuse radiation fraction for hourly, daily and monthly-average global radiation. Solar Energy, 28(4), 293–302. https://doi.org/10.1016/0038-092X(82)90302-4 Boland, Ridley & Laurent Ridley, B., Boland, J., & Lauret, P. (2010). Modelling of diffuse solar fraction with multiple predictors. Renewable Energy, 35(2), 478–483. https://doi.org/10.1016/j.renene.2009.07.018 Boland, Ridley & Laurent (2010) Ridley, B., Boland, J., & Lauret, P. (2010). Modelling of diffuse solar fraction with multiple predictors. Renewable Energy, 35(2), 478–483. https://doi.org/10.1016/j.renene.2009.07.018 Perez & Ineichen Perez, R. R., Ineichen, P., Maxwell, E. L., Seals, R. D., & Zelenka, A. (1992). Dynamic global-to-direct irradiance conversion models. In ASHRAE Transactions (Vol. 98, pp. 354–369). https://doi.org/citeulike-article-id:10576695 Skartveit Skartveit, A., Olseth, J. A., & Tuft, M. E. (1998). An hourly diffuse fraction model with correction for variability and surface albedo. Solar Energy, 63(3), 173–183. https://doi.org/10.1016/S0038-092X(98)00067-X Kind regards, Martin
-
Hi Diogo, the numbers after the coordinates are height in m above sea level, negative time zone (for UTC+2 write -2) and an internal flag we used in the past, but don't use it anymore. So you will just have to adjust the height and the timezone. Kind regards, Martin
-
Dear Noé, the polymorphic interconnection will be available in our next release, along with a very sophisticated calculation of power optimizers (module integrated like Tigo or maxim, or external like SolarEdge). Then you will be able to connect everything to everything, with or without power optimizers. Right now we are working hard to get the new version released this week (PVSOL premium 2018 R1). Kind regards, Martin
-
Hi Kamal, you can easily do so in the 3D environment, if the modules have the same measures (width and height). If not, this will not be possible. To swap modules of an existing configuration, do the following: Select the "Module Coverage" dialog In the section "Define Reference Module" click on your module and choose "Select/Edit Reference Module" Click on the button "Replace" in the upper left corner (or right click on the module) Select the new module If the two modules do not have the same measures, you will see a message box telling you so Hope that helps! Kind regards, Martin
-
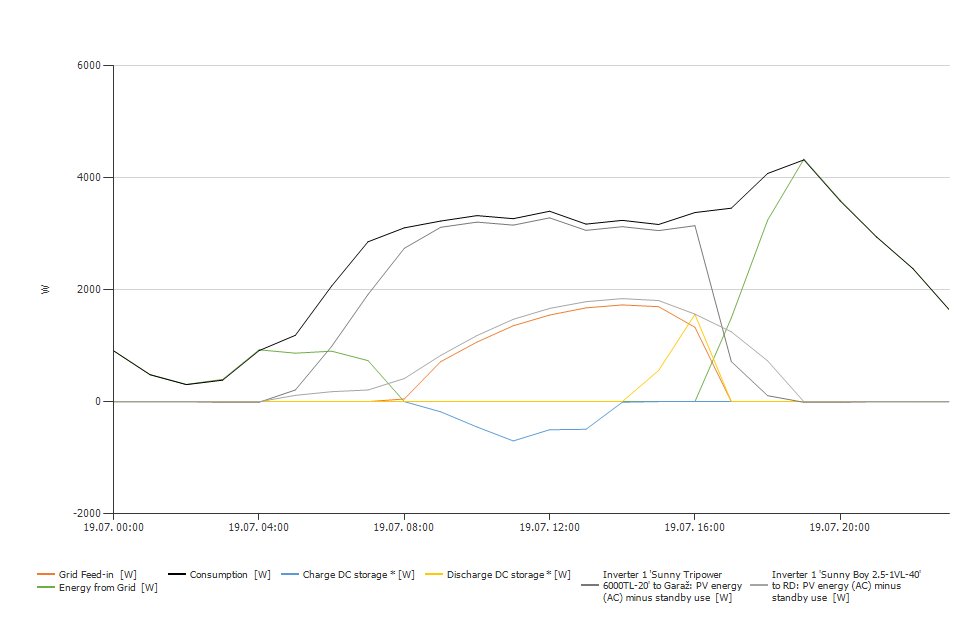
Hi Patrik, I understand your doubts. There are two differences of DC coupled systems that you should have in mind when you compare AC and DC coupled systems: The DC coupled storage is only connected to one of the PV inverters. That implies that the other inverters are never participating in charging the batteries and all PV energy of the other inverters is fed into the grid if it cannot be used to cover the load in that moment The charging power of DC coupled systems is subject to the available PV power of the inverter. Only if the PV power of that inverter is higher than the load, the excessive PV power is used to charge the batteries. In your case the systems behaves like in the graph below very often: During the day, between 08:00 and 16:00, the PV power of inverter 1 (dark grey) is sufficient to cover the load (black) Please note that the dark grey line is PV and battery power together (as it is DC coupled) Only the (little) excessive energy of inverter 1 is used to charge the batteries (blue) The energy of inverter 2 (light grey) is nearly completely fed into the grid (red) between 09:00 and 17:00, as the load is already covered by inverter 1 In the evening, the batteries are discharged to help cover the load (yellow), but as there is only a small amount of stored energy in them, they are rapidly empty - also compare the SOC of the batteries (purple): This leads to a very small amount of battery energy used over the year. Hope that clarifies the matter a bit. If you have further questions, please don't hesitate to ask! Kind regards, Martin

-
Hi Patrik, thanks a lot for your question and for providing the project file, that always helps a lot. In your case there is actually no error, the battery is working well. It is just that in die diagrams the yellow bars are representing PV energy AND battery energy together (see the text in the legend). For DC coupled systems, the PV and battery energy are fed into the system on one common point, so the energies are displayed together. In the table view for the simulation results, you can see, how much energy is stored into and taken from the batteries: Hope that helps, kind regards, Martin

-
Hi Boris, please contact our technical support team with your customer and license number, they should be able to track down the problem and fix it, no worries. contact: hotline@valentin-software.com https://www.valentin-software.com/en/sales-service/customer-service/technical-support Kind regards, Martin
-
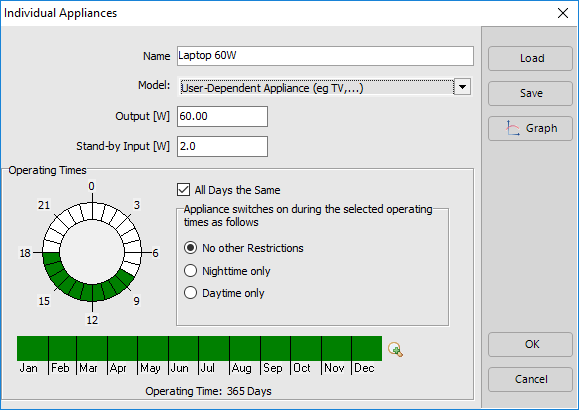
Hi Damon, you can define your own individual appliances in the respective dialogue and then save it as vbi. User-independent appliances (the fan) User-dependent appliances (the laptop) If you click on "Save" on the right side, you can save and reuse it later. Kind regards, Martin

-
Hey Ahmad, thank you for your interesting question. While we cannot speak for EBRD or IFC, we have not heard of a project being rejected because it was designed in PV*SOL. What we experienced is that in Europe there is no difficulty in getting support from banks when producing PV*SOL reports. But in the end it all depends on the specific bank, the employee and of course on the project size (in EUR or USD). The bigger your project is, the higher will be the requirements for the project report. In general, you should be able to prove to the bank that you follow state-of-the-art design rules and use certified components. The IFC e.g. has a report where they point out what is important when designing PV projects in their eyes. And then, there is the bible or quran of PV system design, with (really) everything you need to know when you want to build PV plants: http://www.dgs-berlin.de/en/publications/internationalmanuals.html I would really recommend this to anyone associated with designing or constructing PV plants. Kind regards, Martin
-
Hallo Sebastian, da es sich bei deiner Anfrage um ein Offgrid (netzautarkes) System handelt, erlaube ich mir mal, deine Frage in ein neues Thema zu verschieben. Was die Offgrid-Auslegung angeht, stehen leider derzeit keine DC-gekoppelten Systeme zur Verfügung. Auch reine Laderegler sind nicht implementiert. In der neuen Version von PV*SOL premium, die gerade in der beta-Phase ist, ist es dann aber möglich, beliebige Batterie-Wechselrichter anzulegen, sodass man auch kleinere Laderegler damit nachbilden kann. Auch 12V oder 24V Systeme sind dann (rechnerisch) möglich. Beste Grüße, Martin
-
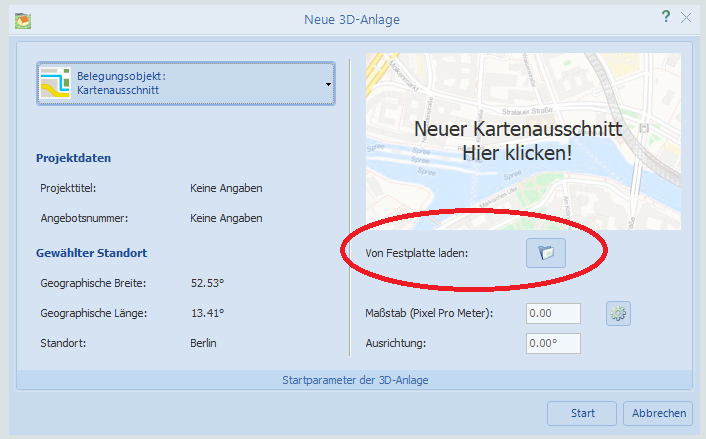
Hallo Leman, man kann im Kartenimport auch beliebige eigene Bilder als jpg, bmp oder png laden: Also einfach einen Screenshot der Google Maps Karte auf der Festplatte speichern und hier reinladen. Der Maßstab aus dem Google-Screenshot sollte dann verwendet werden, um die Pixel/Meter einzutragen. Gutes Gelingen! Martin