developer_mh
-
Posts
1,860 -
Joined
-
Last visited
-
Days Won
173
Everything posted by developer_mh
-
Hi Damon, yes, the details on the solar roof of Tesla are very limited, in contrast to their marketing. On their website you can even order them already, without having seen any details/datasheets or whatever. I wonder who does this... but if you find out something, I think everyone here would be happy if you could share it. Thanks and kind regards, Martin
-
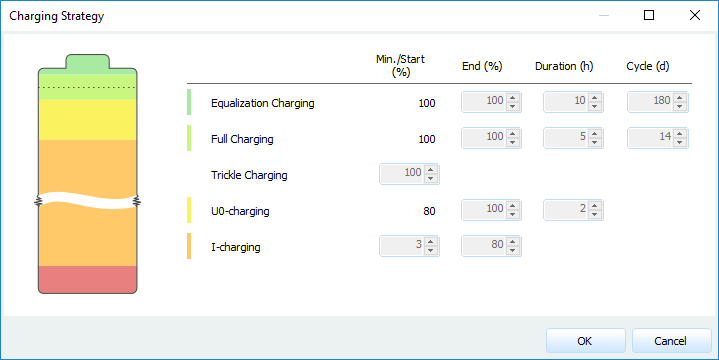
Hi Damon, thank you for your question! Indeed, you cannot enter the number of battery systems right now, this feature will be available in the next version. What you could do for now is to copy the battery system in the database and adjust the power and capacity values accordingly. If you want to go with three Tesla Powerwall systems, you would have to triple the charging power values and the battery capacity, for example. The message that the maximum charging power is insufficient refers to the boost charging mode (U0-charging), which depends on the SOC thresholds of the charging strategy setup and the capacity of your battery. For example, the Tesla Powerwall 2.0 AC from the database has a start SOC of 80% and an end SOC of 100% for the boost mode, which has to finish in 2 hours. The C10 battery capacity is 270 Ah, the batteries run on 50.1 V, so the rated energy would be 270 Ah * 50.1 V = 13.5 kWh. So the power electronics have to charge 20% of 13.5 kWh in 2 hours, which equals to 2.7 kWh in 2 hours. If the charging would run with constant power, one would need 1.35 kW to accomplish that. But the U0 charging modes run with constant voltage while the current decreases exponentially, and because P=U*I, the charging power also decreases exponentially. This is done because batteries need to be charged very carefully when they are nearly full in order to avoid over charging. But this also means that the initial power that is necessary for U0-charging is much higher than 1.35 kW. To calculate the necessary power you'll need to solve the integral of the exponential power curve. In this case the initial power would be around 3.1 kW (where of course the charging voltage is higher than the 50.1 V nominal voltage). I hope this answers your question. If you have any further questions, please don't hesitate to ask! Kind regards, Martin
-
Hi Martin, you will have to convert the data into the format that you can see at the top of this thread. FF is the wind speed and RH is the relative humidity. From what I understand, this would be UM and FF2 from the AgroMetBase, my Norwegian is relatively limited though The important thing is that you can only import one year of data, and it must be a complete year, with one value per hour. 8760 values in total, otherwise the import will fail. 2013 seems to be complete for example. The name of the location and the coordinates have to go in the header, like so: Skjetlein 63.2027,-10.1802,512,-1,-30 Ta Gh FF RH 4.2 0.0 2.0 69.0 2.9 0.0 1.7 77.4 1.7 0.0 0.2 84.4 1.4 0.0 0.0 87.8 1.3 0.0 0.2 91.0 1.0 0.0 1.4 92.7 ... Notice the coordinates are in degrees and minutes, not decimal, although one might think so from the formatting. The decimal coordinates of Skjetlein are 63.34085° North and 10.3005839° East, which gives 63°20'27'' North and 10°18'02'' East in Degrees, minutes and seconds. So you'll have to put 63.2027 and -10.1802. Mind the negative longitude, as the dat file requires longitudes in Western direction. Also note the negative time zone. Another important thing is that you have only valid numbers in your text file. The AgroMetBase exports NULL if values are missing, which is happening for the temperature in 2013 for example. These missing values have to be filled up. I attached a *.dat file for you that you should be able to import in MeteoSyn. Skjetlein.dat Hope that helps! If you have any further question, please don't hesitate to ask. Kind regards, Martin
-
Ja, die neue, große Version von PV*SOL premium kommt im Herbst 2017 und wird den Namen PV*SOL premium 2018 R1 tragen, wir ziehen das Jahr immer etwas vor Wenn man zu diesem Zeitpunkt einen gültigen Wartungsvertrag besitzt, bekommt man auch das Update.
-
Hallo REN, tut mir leid, dass die Antwort etwas auf sich hat warten lassen, ich musste dafür ein wenig recherchieren. Es scheint so zu sein, dass der Skalierungsfaktor, den wir in die dxf schreiben, von den mittlerweile gängigen Programmen nicht mehr richtig interpretiert wird. Ich habe hier das gleiche Problem nachstellen können, in meinem Fall mit AutoDWG. Ich habe das Problem nun beheben können, es wird dann in der neuen Version behoben sein. Solange könnte ein Workaround sein, die richtige Dimensionierung im Programm selbst einzustellen. Bei AutoDWG DWGsee geht das unter Options -> Dimension Settings. Wahrscheinlich gibt es etwas vergleichbares in AutoCad LT. Der richtige Dimension factor wäre hier 1,64 / 9.89 = 0,1658. Ich hoffe, das hilft erstmal so weiter. Wie gesagt, richtig behoben wird das Problem dann in der nächsten Version (PVSOL premium 2018 R1), die kommt im Herbst. Beste Grüße, Martin
-

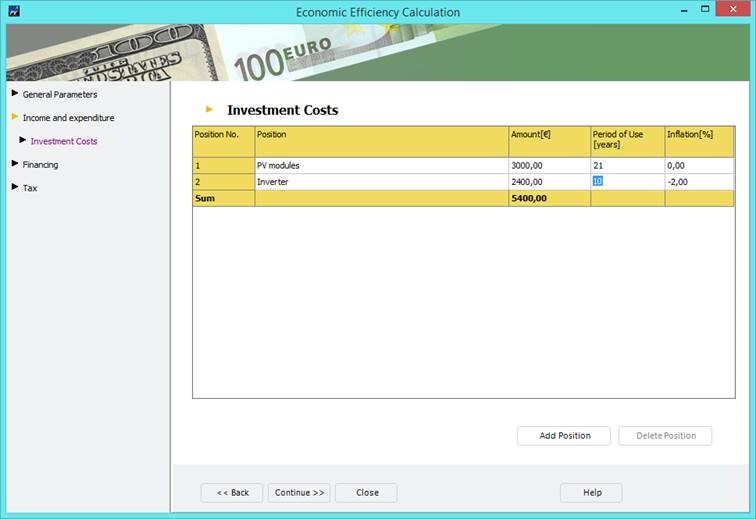
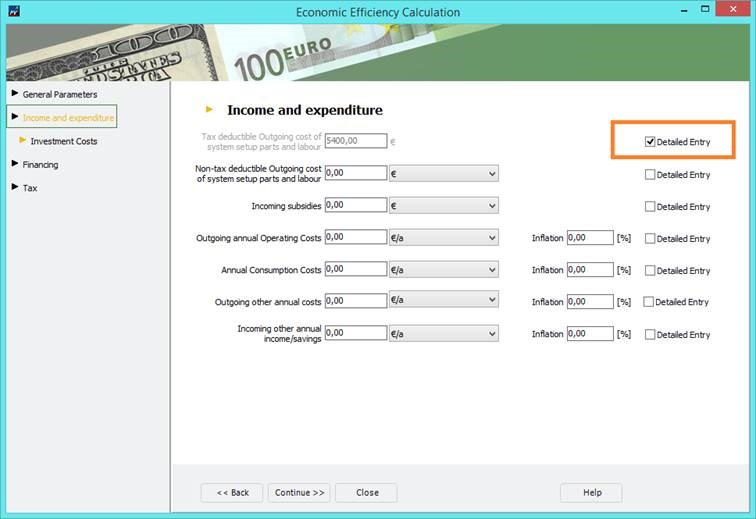
Including an extra cost on the middle of the project
developer_mh replied to Diego's topic in PV*SOL
Hey Diego, it is possible, you just have to go to the detailed input of the investments, where you can enter a product lifetime / period of use. See the following screenshots for an example: Hope that helps, Martin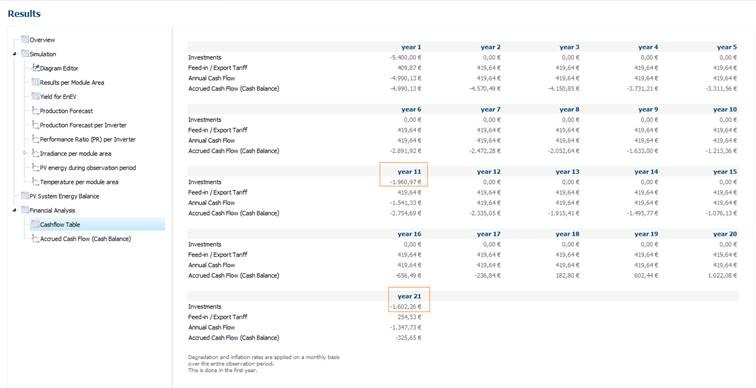
-
Hola leo, which version of PV*SOL do you have installed? The 3D map feature was introduced in PV*SOL premium 2016 Release 1 (November 23rd, 2015). Check if you have the most recent version installed, which is PV*SOL premium 2017 R9. Un saludo Martin
-
Hallo Michael, welche Version hast du denn installiert? Hast du das neuste Datenbank-Update eingespielt? Testweise mal unter "Hilfe -> Auf Updates prüfen" schauen, ob Updates da sind und wenn ja, installieren. Tritt der Fehler bei allen Projekten auf oder nur bei einem speziellen? Kriegen wir schon hin Das Update bei Goofy war ein Datenbank-Update, wir gehen also davon aus, dass das Problem bei seinen Symptomen mit einem kaputten Datenbank-Eintrag zu tun hatte. Beste Grüße, Martin
-
Hi leoramirezm, when you start into the 3D environment (or start a new project from within the 3D environment), you can select the map section from the drop down: That is, you can't add a map section to an existing project, you'll always have to start with a map and add your objects afterwards. Does this answer your question? Kind regards, Martin

-
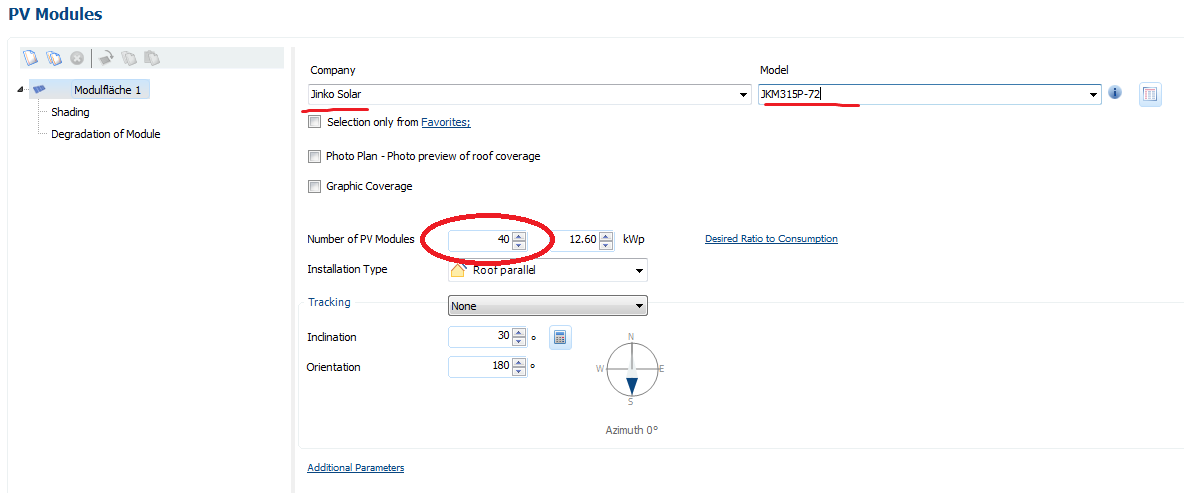
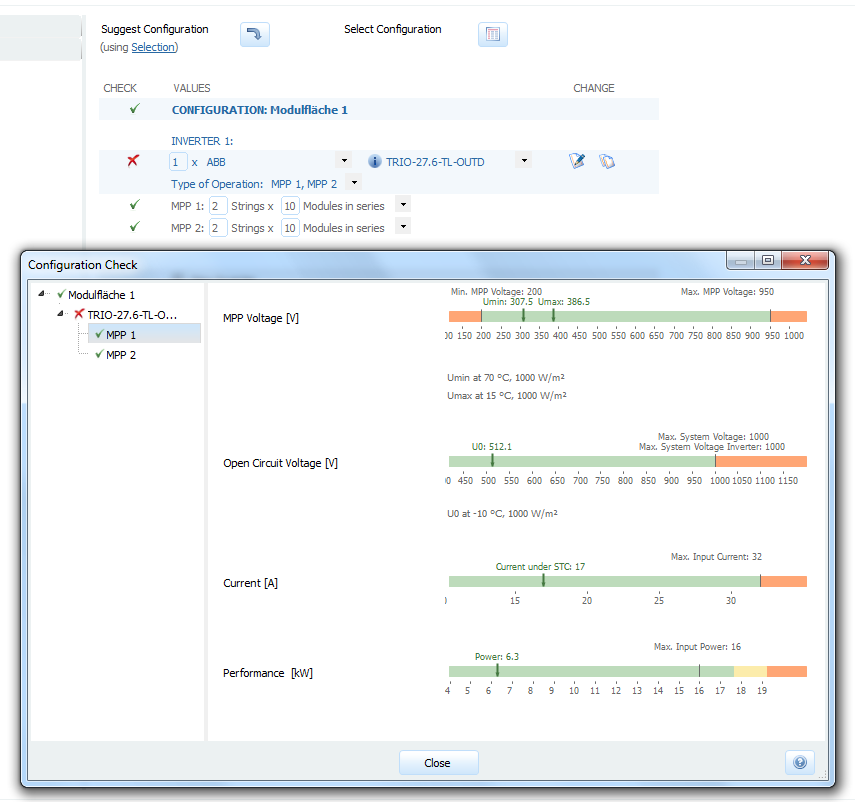
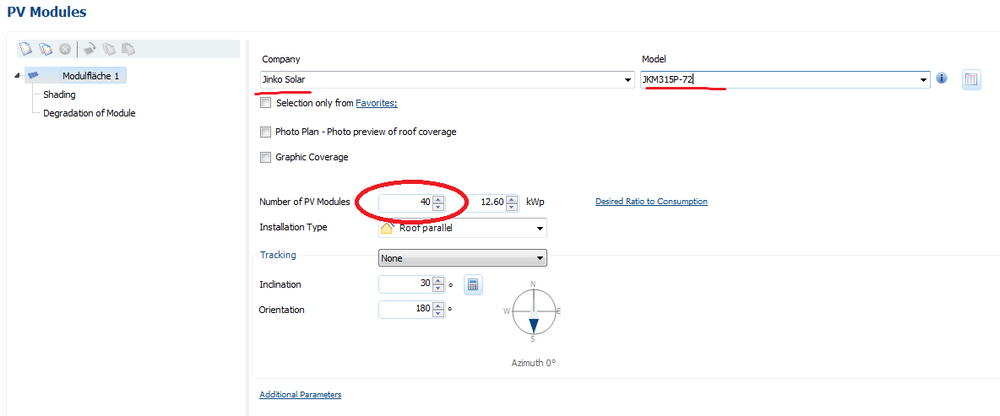
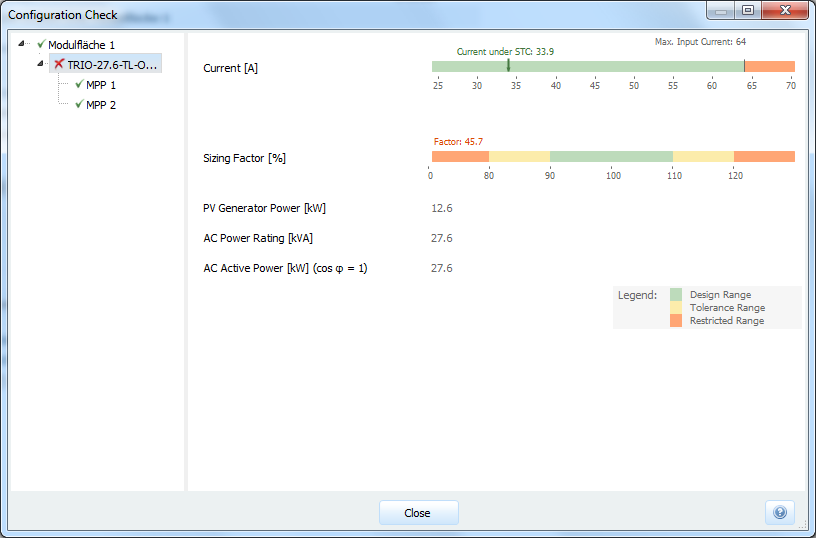
Hi Abraham, thanks a lot for your question. The thing is that the ABB Trio 27.6 kW inverter has to MPP trackers. If you connect 20 Jinko PV modules with 315 Wp on each of them, you will have a DC side power of only 2 * 20 * 315 Wp = 12,6 kWp, whereas the inverter has a rated power of 27.6 kW. The inverter will be underdimensionened by more than 50%, which one try to avoid because of the relatively high inverter losses. But anyways, you can configure the system as you wanted: Just choose the Jinko modules on the PV module page and enter a total number of 40 modules there. Then switch to the inverter page and enter your inverter manually. When you click on the red cross or green ticks left to the configuration table, you'll see the configuration check in order to verify what is wrong with your system: You see that for the MPP voltage and current limits everything is fine, but when you look at the inverter level (marked with a red cross in the tree view), you'll see that the dimensioning factor is only 45 %, while it should be around 100 %: I hope that helps, kind regards, Martin

-
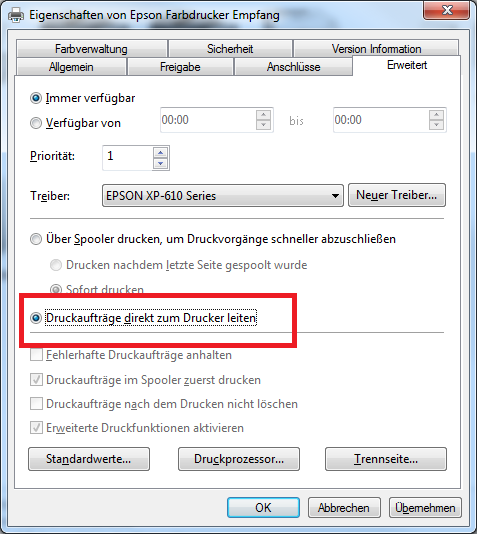
Hallo nochmal, also, unsere Hotliner meinen folgendes: Jetzt hattest du gesagt, dass du keine Drucker installiert hast, aber vielleicht hast du ja einen pdf-Drucker oder den Windows XPS-Dokumentendrucker? Ansonsten würde ich dich bitten, dich dann mit deiner Kundennummer bei unserer Hotline zu melden (hotline@valentin-software.com), die wissen dann schon Bescheid und werden ihr Bestes tun, um den Fehler zu reproduzieren und Abhilfe zu schaffen. Beste Grüße, Martin
-
Hello, the problem is due to an old version of PV*SOL, where our zipper had problems with special characters (in the names of module areas) like á or the like. If you send me the project file I can fix it for you. You should then use PV*SOL (premium) R9 to avoid that error. Kind regards, Martin
-
Das scheint etwas komplizierter zu sein... hast du probiert, PV*SOL nochmal zu installieren, nachdem du die Updates von Windows deinstalliert hattest? Findest du heraus, welche Nr das Update hatte? Dann könnten wir versuchen, das hier nachzuspielen (aber wohl erst wieder am Montag).
-
Ja, das scheint mir wahrscheinlich. Im Rahmen der Präsentation war uns bisher vor allen Dingen das Problem mit dem RAM bewusst, aber der scheint bei dir ja wirklich kein Problem zu sein, zumal es vorher ja auch ging. Kannst du herausfinden, welche Updates gemacht wurden? Welche Windows-Version nutzt du? Ist es möglich, die Updates testweise rückgängig zu machen?
-
Hallo Goofy, ok, 450 MB wirken nicht so schlimm. Wieviel RAM ist denn insgesamt noch frei auf deinem Rechner? Und nimm mal testweise alles raus außer dem Titelblatt und probiers dann nochmal mit der Präsentation. Und am besten vor jedem Versuch PV*SOL beenden und neu starten, damit wir sicher sein können, dass nichts Störendes mehr im Speicher ist. Und noch eine Frage: Tritt das bei allen Projekten auf oder nur bei einem speziellen? Beste Grüße, Martin
-
Hallo Goofy, das ist eine Fehlermeldung des Tools, das wir zur Erzeugung des Berichts verwenden. Um genauer einzugrenzen, woran das liegen könnte, wäre es hilfreich zu wissen, ob es vielleicht am Arbeitsspeicher liegen könnte. Könntest du folgendes probieren, bitte? Alle Programme schließen, auch PV*SOL PV*SOL öffnen, Projekt laden, simulieren Dann den Task Manager öffnen (Strg+Shift+Esc) und schauen, wieviel RAM PV*SOL benötigt (und bitte aufschreiben) Dann die Präsentation starten und dabei den RAM im Auge behalten. Bitte auch den Höchststand notieren, bevor die Fehlermeldung kommt. Dazu wäre noch hilfreich zu wissen, mit welcher Version von PV*SOL du arbeitest und wie deine Berichtseinstellungen aussehen (welche Berichts-Elemente, hochauflösende Bilder?). Beste Grüße, Martin
-
idealer Aufständerungswinkel für verschiedene Breitengrade ermitteln
developer_mh replied to Goofy's topic in PV*SOL
Hallo Goofy, ja, das geht auf der Seite PV-Module mit dem kleinen Taschenrechner-Button neben dem Feld für die Modulneigung: Damit wird in Abhängigkeit des Standorts, der Ausrichtung und falls vorhanden der Horizont-Verschattung die optimale Neigung für die Module ermittelt. Das funktioniert auch für die einachsig nachgeführten Systeme. Beste Grüße und viel Spaß beim Optimieren! Martin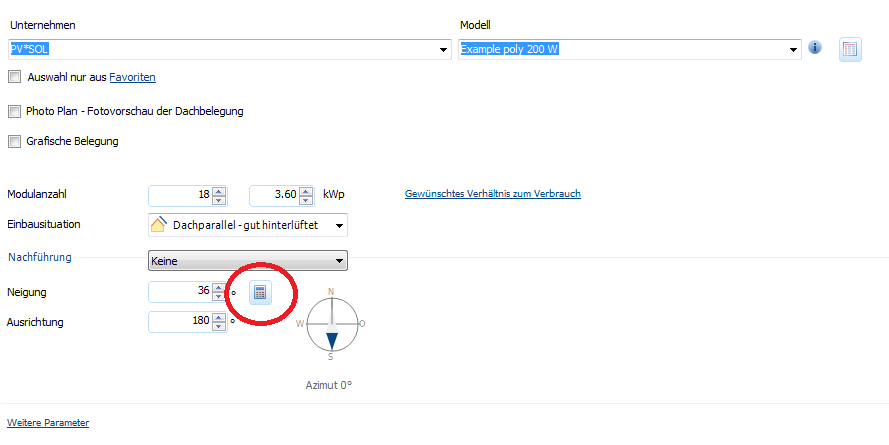
-
Hallo Fabio, die nachgeführten Systeme sind derzeit nur in der "2D" Variante von PV*SOL möglich. Das bedeutet, dass die gegenseitige Verschattung der Tracker nicht mit berücksichtigt werden kann. Was wiederum erklärt, warum die Option "Backtracking" nicht abwählbar ist. Die Tracker werden in unserer Berechnung automatisch so ausgerichtet, dass sie sich nicht gegenseitig verschatten. Ab wann sie sich gegenseitig verschatten, ist dann vom Flächennutzungsfaktor abhängig, der ja unabhängig von der Breite bzw. Höhe der Tracker ist. Bei einachsig nachgeführten Systemen, die sich von Osten nach Westen drehen (wir nennen sie 1-achsig Nord-Süd, da die Rotationsachse in der Nord-Süd-Ebene liegt), ist dabei dann also die Breite der Tracker entscheidend für den Flächennutzungsfaktor. Wenn euer System 20m breit ist und ein FNF von 0,4 eingestellt wird, würden die Tracker also 50m auseinander stehen. Wie breit der Tracker dabei wirklich ist, oder wieviele Module darauf montiert sind, ist bei dieser Herangehensweise dann egal. Insofern ist eine Analyse der Ertragseinbußen durch Verschattung für verschiedene FNF leider nicht möglich. Man könnte nur untersuchen, inwefern sich der Ertrag aufgrund des früher oder später einsetzenden Backtrackings verändert. Hilft das weiter? Beste Grüße, Martin

-
Dear Energy1, for these kinds of problems, please contact our sales team. Kindly send a message with your details (serial number, customer number, name of company etc and perhaps a link to your post here) to our sales team, sales@valentin-software.com. Kind regards, Martin
-
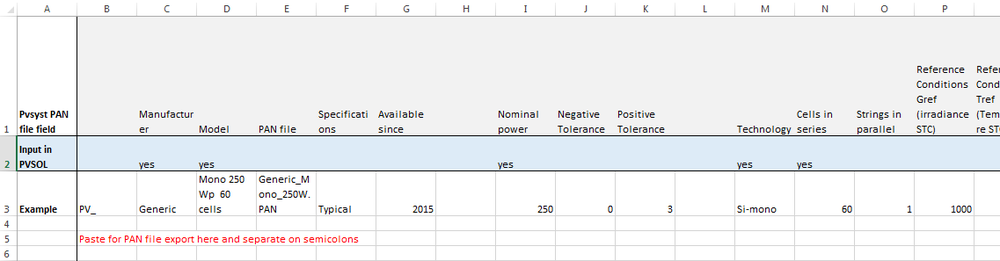
Dear Willy, I am afraid that the PAN format is a proprietary (and binary) format from PVsyst which you cannot open in PV*SOL. You could import your PAN file in PVsyst and then export it to clipboard. Then you can paste the module data to an Excel sheet (separating the entries on semicolon). Using PVsyst 6.4.1, I prepared an Excel sheet where you can paste your data and you'll already have the correct column description for to know which value must be entered in PVSOL: You can download the Excel file here: PAN files for PVSOL.xlsx You would then open the PV module database of PV*SOL, then choose "New module" and enter the data accordingly. For this example I entered the data and saved a project for you (just to see where to enter which data): Project with module from PAN file.pvprj Hope that helps! I'd be glad if you could give me a short feedback if you succeded. Kind regards, Martin Project with module from PAN file.pvprj
-
Hallo Thomas, an sich hätte ich ja gesagt: Einfach die Wärmepumpe in GeoT*SOL simulieren und das elektrische Profil exportieren. Aber WP zur Kühlung werden leider nicht unterstützt. Ansonsten ist es leider relativ schwierig, an hochaufgelöste Lastprofile von modernen Klimaanlagen/Wärmepumpen heranzukommen. Nach ein wenig Recherche bin ich auf dieses Paper gestoßen, in dem auf Seite 745 (Fig 6) ein Lastprofil einer Klimaanlage gezeigt wird. Allerdings handelt es sich hier um eine Split-AC, also ist dieses elektrische Verhalten nicht wirklich übertragbar auf WP-Kühlungen (ganz abgesehen natürlich von den Raumtemperaturen, die das Lastprofil ja wesentlich beeinflussen): http://www.saifurrahman.org/wp-content/uploads/2014/12/Load-Profiles-of-Selected-Household-Appliances-2.pdf Weiter hätte ich hier eine Studie aus der Schweiz: http://www.hetag.ch/download/SB_HuKeWP.pdf Zwar ohne Verweis auf die Daten, aber wenn man die höflich anschreibt, erreicht man vielleicht was. Und zum dritten eine Studie unserer Freunde der HTW Berlin: https://pvspeicher.htw-berlin.de/wp-content/uploads/2015/04/TJADEN-2015-Einsatz-von-PV-Systemen-mit-Wärmepumpen-und-Batteriespeichern-zur-Erhöhung-des-Autarkiegrades-in-Einfamilienhaushalten.pdf Die haben bestimmt auch Daten zu Wärmepumpen, einfach mal anschreiben mit Gruß von uns Und zu guter Letzt der Lastprofil-Generator der TU Chemnitz: http://www.loadprofilegenerator.de/download/ Damit kann man einiges machen, es gibt auch Klimaanlagen in der Auswahl. Ein wenig Einarbeitung ist aber nötig. Beste Grüße, Martin
-
Hallo, danke auch hier für die Rückmeldung! Dass die automatisch erzeugte 3D-Abbildung bei komplexen Gebäuden nicht das ganze Gebäude zeigt, tut uns leid. Ich werde das testen und dann als Fehler eintragen. Ja. Im Screenshot-Manager einfach einen Rechtsklick auf den gewünschten Screenshot machen, und "Als Übersichtsbild verwenden" wählen. Beste Grüße, Martin

-
Hallo M.Zander, da hast du leider keine Möglichkeit übersehen - derzeit ist es nicht möglich, mehrere E-Fahrzeuge in einem Fuhrpark zu definieren. Aber auch das steht auf unserer Liste für die neue Version (2018 R1, die im Herbst erscheinen wird). Momentan arbeiten wir mit Hochdruck an den neuen Features - hoffentlich schaffen wir das mit den Autos auch noch. Danke für die Rückmeldung! Beste Grüße, Martin
-
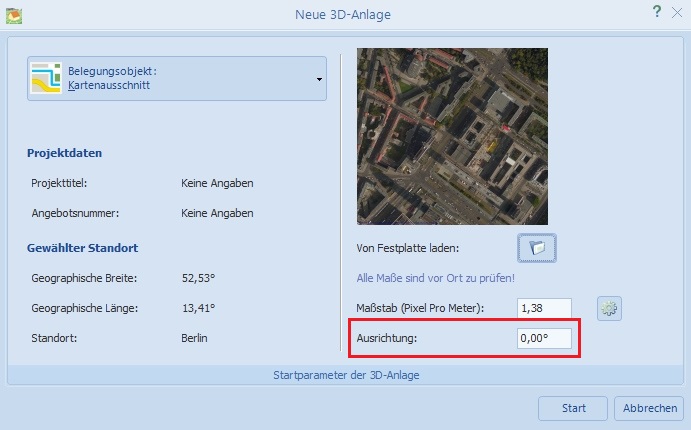
Hallo M. Zander, vielen, vielen Dank für die konstruktiven Anregungen, die wir sehr gerne annehmen werden. Der Feature-Wunsch ist durchaus nachvollziehbar (und, um ehrlich zu sein, auch schon länger auf unserer Todo-Liste). Ob es für die nächste große Version noch was wird, können wir zwar nicht versprechen, aber hoffen wir mal das beste Vielleicht hat unser 3D-Entwicklungsteam ja noch Zeit vor der Veröffentlichung. Danke in jedem Fall für die Rückmeldung! Das geht jetzt schon, ja. Beim Karten-Import gibt es die Möglichkeit, einen Drehwinkel anzugeben: Grüße, Martin
-
Hi Florencia, if the automatic configuration does not find a suitable combination of your PV modules and the selected inverters, the reason is most likely because the inverters you selected do not have the features that would permit a proper configuration. For example, if you have 10 kWp of PV modules but you only selected inverters with a rated power of 20 kW and above, the automatic configuration is not able to find a good solution for you. Also, if you have more than one module area and you want to connect them to one inverter, but you have only inverters with one MPP tracker in your selection, there will be no configuration possible. Just try to add other inverters to your selection, perhaps choose models with different AC power ratings, voltage ranges and MPP trackers and the like, and try again. If you need further assistance, please let me know, kind regards, Martin