developer_mm
Administrators
-
Joined
-
Last visited
Everything posted by developer_mm
-
Hallo Dominik, leider ist es zur Zeit nicht möglich aufgeständerte PV-Anlagen zu verkabeln. Das Feature steht schon eine Weile auf unserem Zettel, wobei bisher die Zeit gefehlt hat, dies zu implementieren. Viele Grüße, Marcel
-
Hallo Jonathan, zur Zeit ist es nicht möglich mehr als 7.500 Module für eine aufgeständerte PV-Anlage zu verwenden, sofern die 3D-Planung verwendet wird. Wenn eine 3D-Planung erwünscht ist, müsste das Projekt in mehrere Projekte aufgeteilt werden. Alternativ müsste die Planung ohne 3D durchgeführt werden, in diesem Fall gäbe es keine Modulbeschränkung. Viele Grüße, Marcel
-
Hello HPJ, to import your own load profile, simply place each consumption value in a row and nothing else with the starting point you mentioned. Further information can be found here: https://help.valentin-software.com/pvsol/2019/pages/consumption/#import-load-profile. Kind regards, Marcel
-
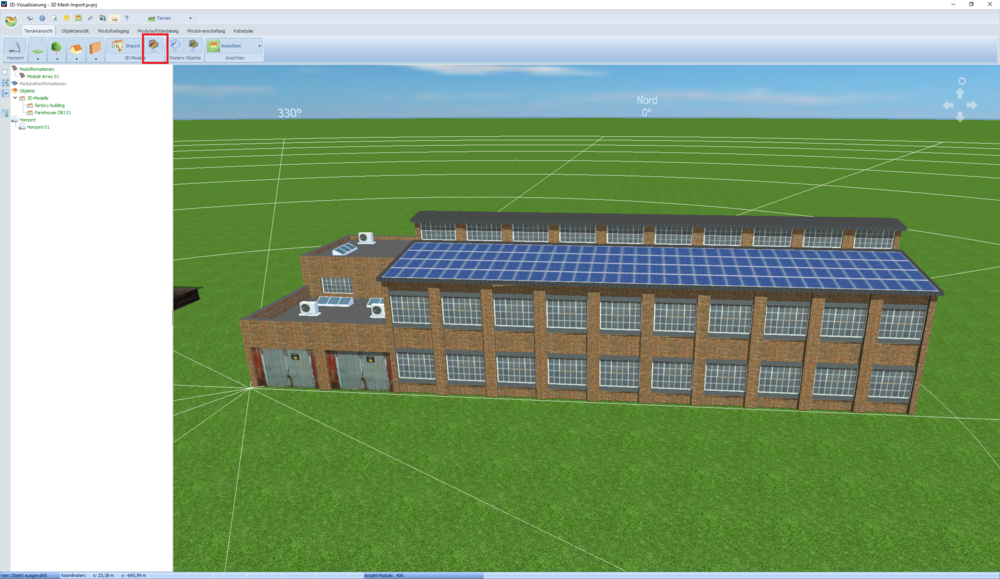
Hallo Anton, in diesem Fall würde ich empfehlen die Belegungsflächen selbst einzuzeichnen. Ich habe die passende Stelle im Programm auf dem Screenshot mal rot umrahmt. Viele Grüße, Marcel
-
Hallo Vondersingold, die Tarife einzelnen Lastprofilen zuzuordnen ist zur Zeit leider nicht möglich. Diese Rechnung muss man Anhand der Simulationsergebnisse selbst machen (siehe auch https://help.valentin-software.com/pvsol/2019/navigationsseiten/praesentation/#simulationsergebnisse). Dort gibt es die Spalte "PV-Energie (AC) abzgl. Standby-Verbrauch", mit dieser Info kann man die Erparnisse dann selbst bestimmen. Das Feature steht schon auf unserer Wunschliste, ich kann aber nicht abschätzen, wann dies Implementiert sein wird. Viele Grüße, Marcel
-
Hallo PV-Flow, um dies zu simulieren, muss eine Polystringverschaltung gewählt werden (siehe hier https://help.valentin-software.com/pvsol/2019/navigationsseiten/wechselrichter/polystring-verschaltung/). So können verschiedenste Modultypen und Modulausrichtungen simuliert werden. Viele Grüße, Marcel
-
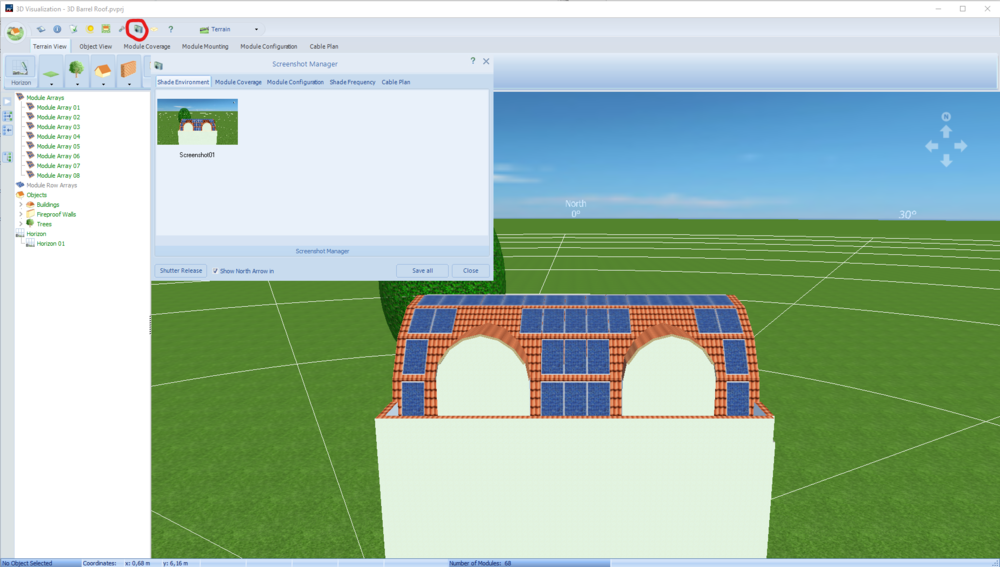
Hello RChidwick, You can take individual screenshots of your PV system and save them as *.jpg. An export as *.pdf isn't possible. Kind regards, Marcel
-
-
Hello Gustav, the easiest way, as you mentioned before, is to export the results. However, you cannot change the data you want to export. The PV energy is already included. Look for the column "PV Energy (DC)". There is no plan to show the maximum peak production, but it's a good idea. Kind regards, Marcel
-
Hello Jonas, Unfortunately, I can't see a picture. But you can also upload the picture here. Kind regards, Marcel
-
Hallo Moritz, eine Überschlagsrechnung zur maximal anliegenden Leistung gibt es nicht. Um die maximale Leistung am jeweiligen MPP-Tracker zu bestimmen, würde ich empfehlen mit einem halbwegs passenden Wechselrichter zunächst einmal zu simulieren. Anschließend können in den Simulationsergebnissen (https://help.valentin-software.com/pvsol/2019/navigationsseiten/praesentation/#simulationsergebnisse) genauere Informationen entnommen werden. Alternativ können ja auch verschiedenste Wechselrichter bzw. Verschaltungskonfigurationen ausprobiert werden. Dafür ist ja PV*SOL da Viele Grüße, Marcel
-
-
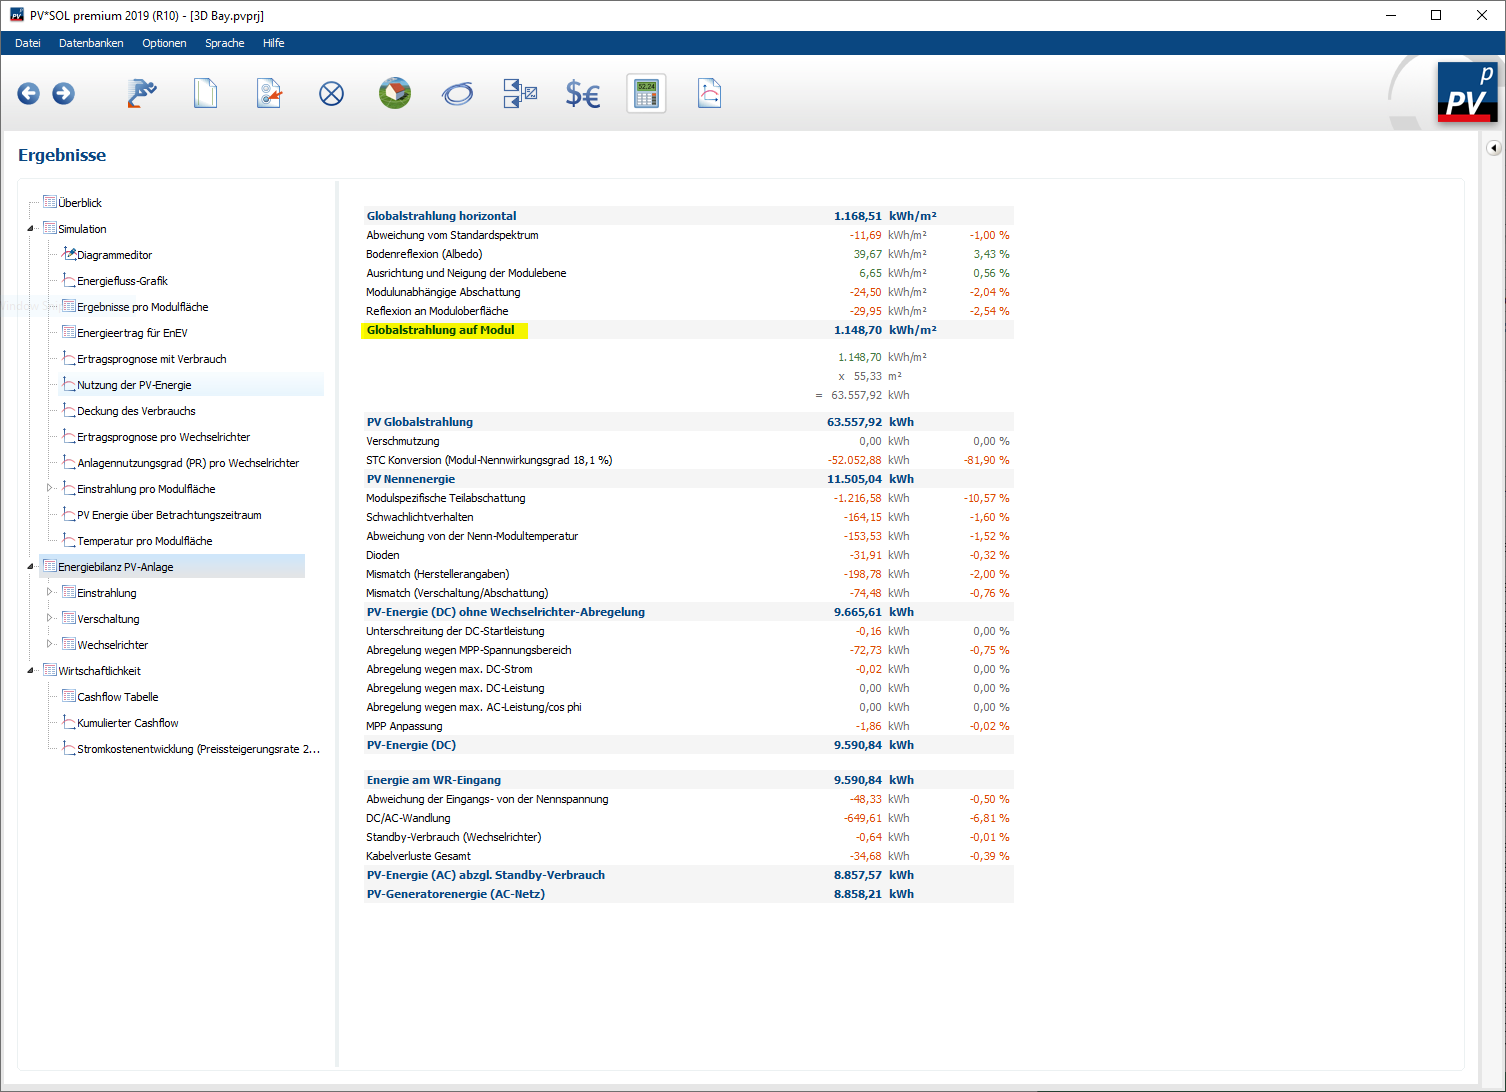
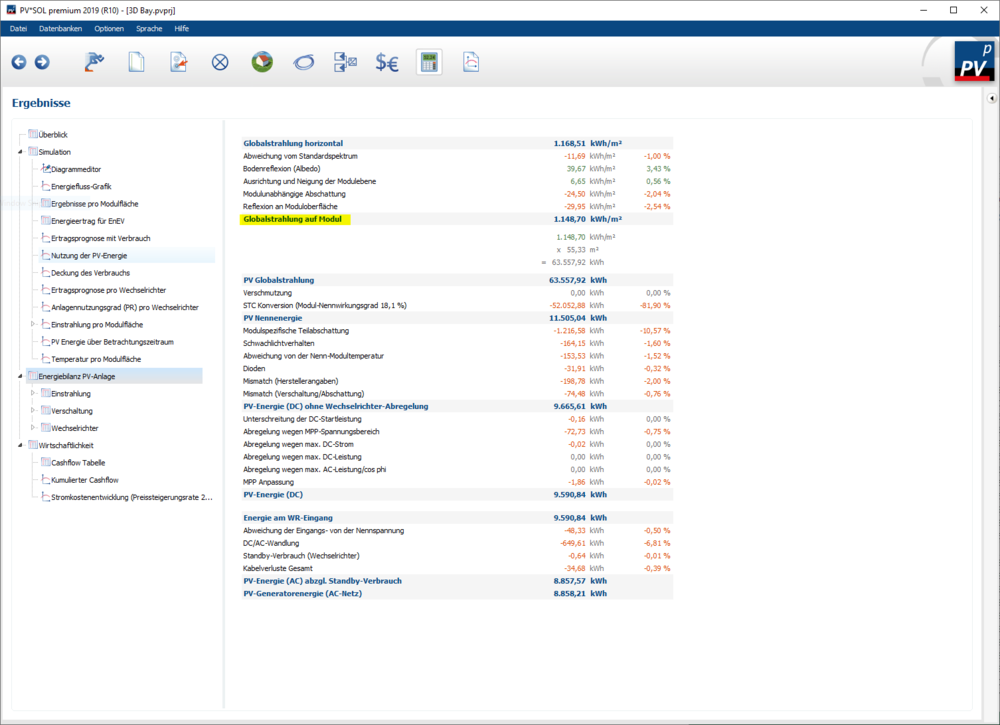
Hallo Solar, die Spaltenüberschriften in den exportierten Simulationsergebnissen sind die gleichen wie auf der Ergebnisseite. So kann man gut erkennen, welche Größen bereits inkludiert sind. Bei der "Globalstrahlung auf Modul" ist bereits die "Modulunabhängige Verschattung" inkludiert. Modulunabhängige Verschattung (nur in 3D) Der Anteil der Solarstrahlung, der für alle Module gleichermaßen durch Verschattung verloren geht. Dies kann zum Beispiel bei einer eingestellten Horizont-Verschattung der Fall sein oder bei identisch platzierten nahen Verschattungsobjekten. Anschließend wird die "Modulspezifische Teilabschattung" inkludiert. Modulspezifische Teilabschattung (nur in 3D) Hier werden alle Verluste zusammengefasst, die durch die individuelle Verschattung der PV-Module entstehen. Es werden die elektrischen Verluste betrachtet, die je nach Verschattungssituation und Modulaufbau teilweise erheblich höher ausfallen können als die reinen Verluste an Solarstrahlung. Viele Grüße, Marcel
-
Hallo Solar, um möglichst realitätsnah zu simulieren, verwendet PV*SOL meist "typical meteorological year" (TMY) Klimadatensätze. Diese Klimadaten beinhalten natürlich auch verschiedenste Bewölkungssituationen. Eine Simulation ohne Bewölkung (mit ausschließlicher "Clear Sky" Strahlung) , würde bezogen auf den zu erwartenden Ertrag einer PV-Anlage, kein realistisches Ergebnis liefern. Ist dennoch eine Simulation mit reiner Clear Sky Strahlung erwünscht, müssen eigene Klimadatensätz verwendet werden (siehe hier https://help.valentin-software.com/pvsol/2019/navigationsseiten/anlagenartklimaundnetz/meteosyn/#optionen). Die detaillierten Simulationsergebnisse können nach erfolgter Simulation auch eingesehen bzw. heruntergeladen werden (siehe hier: https://help.valentin-software.com/pvsol/2019/navigationsseiten/praesentation/#simulationsergebnisse). Ich hoffe das Hilft weiter Marcel
-
Hello Dajana, there was a bug in the climate data in older PV*SOL versions. I would recommend a PV*SOL update for your colleague. Kind regards, Marcel
-
Hello Remu, We know that this is a very demanded feature. Unfortunately, it will not be implemented in the near future. Kind regards, Marcel
-
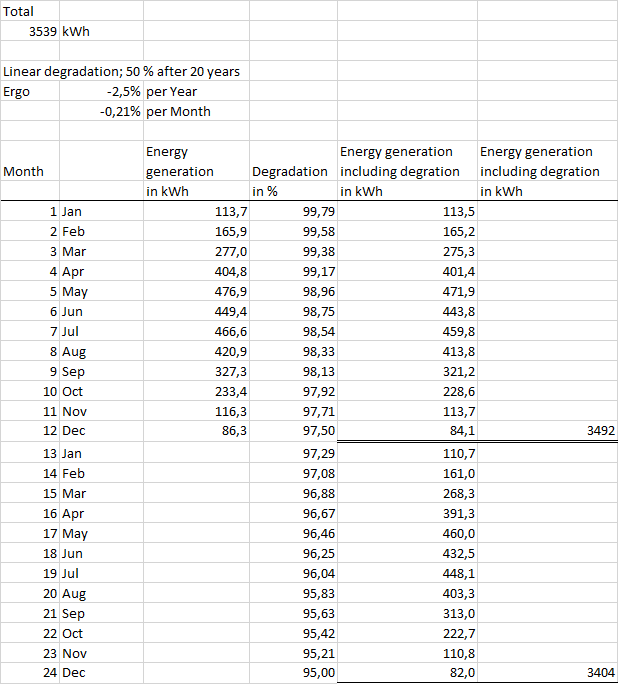
Hello Vishnu, No, you can only access the data for the first year. But the most important data for the cash flow are the monthly data for the first year. The energy production of the other years depends only on the first year and on the degradation of the PV modules. For the sake of clarity, the annual value is then output in PV*SOL. Ergo, you would need the monthly data including the degradtion to do some calculation yourself. I did a little example in excel to get these monthly data. My total energy generation was 3539 kWh in the first year. My degration of the pv modules was linear and 50 % after 20 year. That means -0.21% per month. The monthly data I have extracted out of the detailled simulation results. With these litte excel sheet I was able to calculate the energy generation for each month. The annual values can also be found in PV*SOL under "Results" and then "Simulation". Grid Feed-in 3.538 kWh/year Grid Feed-in in the first year (incl. module degradation) 3.492 kWh/year I hope that helps, Marcel data.csv example.xlsx
-
Hello RicardoM, In general, the manufacturers themselves are responsible for updating their products in our database. If you are missing a product, you can contact our database team at database@valentin-software.com . They will take care of it. Nevertheless, I have reported the Trina module as missing Kind regards, Marcel
-
Hello Michal Bursik, We do not support automatic inverter configuration with SolarEdge inverters. Our automatic configuration does not support configurations with power optimizers, and since SolarEdge inverters are generally used in combination with power optimizers, we do not automatically configure these inverters. Kind regards, Marcel
-
Hallo Dominik, ja das stimmt, vielen Dank für den Hinweise. Nach UBA (https://www.umweltbundesamt.de/publikationen/entwicklung-der-spezifischen-kohlendioxid-5) ist der Wert mit 470 - 480 g/kWh zwar etwas höher als beim BDEW, nichtsdestotrotz geben ich dir recht, für deutsche Standorte müsste der Standardwert angepasst werden. Ich schätze wir werden dann den Standardwert mit dem nächsten großen Release aktualisieren. Viele Grüße, Marcel
-
Yes, you're right, the default FIT should be the latest. There is no way to change the default FIT at this time, but the default tariff will be changed with the next major release. Kind regards, Marcel
-
Hello Ozdemir Genc, if you want to use the SMA Sunny Island, this is unfortunately not possible. One possibility could be to use only one cluster with 3 suitable battery inverters. However, the battery inverters would have to have a very high output power. Kind regards, Marcel
-
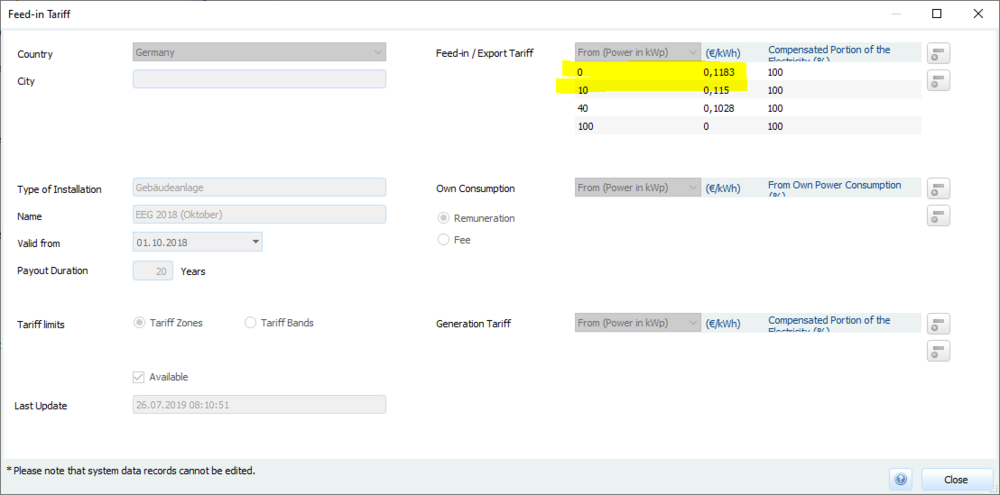
Hello Vishnu, The fit price is not fixed and depends on the installed PV power. (https://help.valentin-software.com/pvsol/2019/databases/components/feed-in-tariffs/) For your system "süd-west" you have a pv generator output of 12.5 kWp. FIT = (10 kWp / 12.5 kWp * 0.1183 EUR / kWh) + (2.5 kWP / 12.5 kWp * 0.115 EUR / kWh) = 0.11764 EUR / kWh For your system "süd-ost" you have a pv generator output of 11.9 kWp. FIT = (10 kWp / 11.9 kWp * 0.1183 EUR / kWh) + (1.9 kWP / 11.9 kWp * 0.115 EUR / kWh) = 0.117773 EUR / kWh Kind regards, Marcel
-
Hello Dennis, In general, the climate data in PV*SOL are provided by meteorm (https://meteonorm.com). They have not yet updated their data periods. If you like you can also import your own climate data (https://help.valentin-software.com/pvsol/2019/pages/system-type-climate-and-grid/meteosyn/#options) Kind regards, Marcel
-
Hello Mario, Sorry for the late reply I don't quite understand your question. Which performance do you mean? Kind regards, Marcel