developer_mm
-
Posts
227 -
Joined
-
Last visited
-
Days Won
8
Everything posted by developer_mm
-
Hello Stuart, this problem should be solved with the upcoming PV*SOL R5. Kind regards, Marcel
-
Hello Achmed, welcome to our forum! Unfortunately AC combiners are not implemented yet, but it is a good point. We will consider this as a new feature for future PV*SOL versions. Kind Regards, Marcel
-
Oh, I guess this is one of the most wanted features for PV*SOL that hasn't been implemented yet.....
-
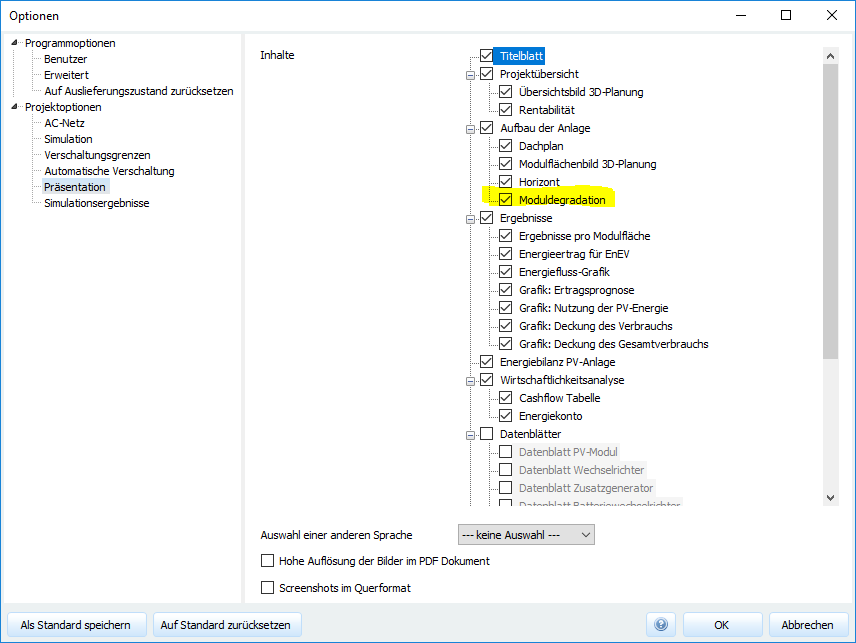
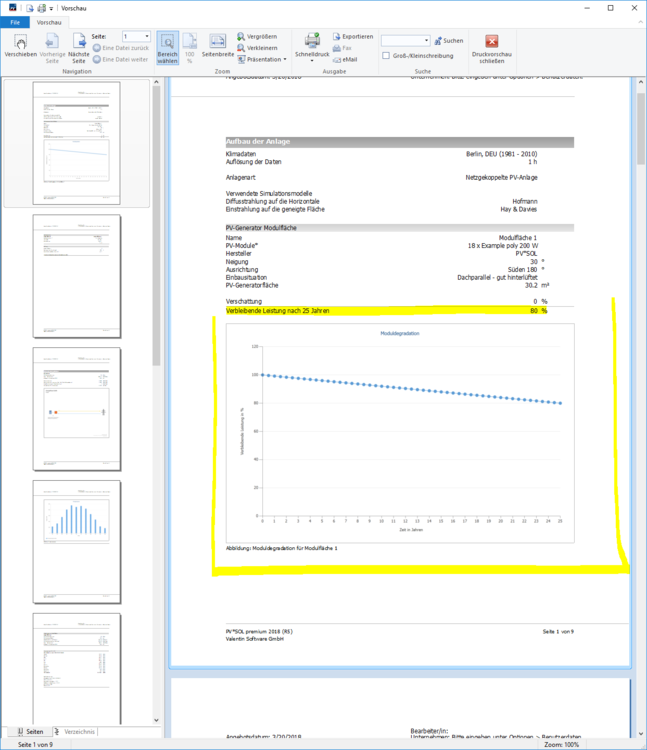
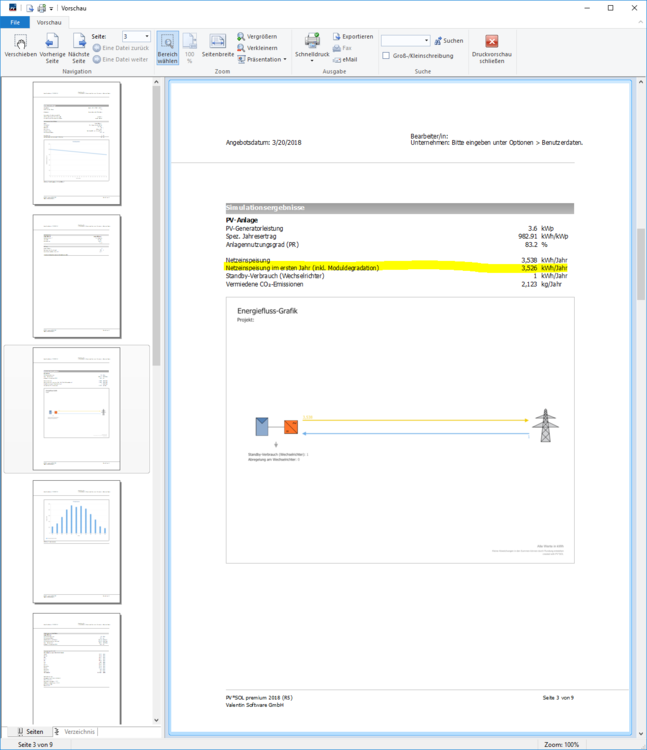
Hallo dag, um die Grafik der Moduldegradation im Bericht anzeigen zu lassen, muss in den Optionen "Moduldegradation" ausgewählt sein. Das Optionsmenü kann über die Menüleiste "Optionen > Programmoptionen" aufgerufen werden. Der entsprechende Auswahlpunkt befindet sich unter "Projektoptionen > Präsentation". Alternativ kann das entsprechende Optionsmenü auch direkt über die Navigationsseite über "Konfiguration" (direkt unter der Sprachauswahl des Projektberichtes) geöffnet werden. Nach dem aktivieren der Moduldegradation, erscheint die Grafik und die Information der verbleibenden Leistung nach x Jahren im Projektbericht unter "Aufbau der Anlage": Der Ertrag in kWh vom 1. Jahr inklusive Moduldegradation befindet sich unter dem Punkt "Simulationsergebnisse". Der Ertrag vom letzten Jahr in kWh wird meines Wissens nach nicht direkt ausgewiesen, sondern wie schon erwähnt in Prozent. Viele Grüße, Marcel
-
Hallo Bene, solange die Modulabmaße gleich sind, kann das Modul auch nachträglich geändert werden. Dazu muss das entsprechende Referenzmodul geändert werden. -> Dazu in der 3D-Visualisierung unter Modulbelegung "Referenzmodul auswählen/bearbeiten" auswählen -> Im anschließend geöffneten Dialog auf das gekennzeichnete Symbol klicken. Dann kann das neue Modul ausgewählt werden, welches das alte ersetzen soll. Viele Grüße, Marcel


-
Hello, Julienmen, Bifacial modules cannot currently be simulated directly. We are aware of and working on this necessary function, but I do not know when it will be implemented. Indirectly, bifacial modules can be simulated like normal modules, which have a higher electrical characteristic than the non-bifacial variant. For this purpose Solarworld provides various module versions on its homepage (https://www.solarworld.de/fileadmin/swi_downloads/produkte/sunmodule/datenblaetter/de/swi_db_sunmodule_bisun_protect_290_en.pdf). The different module versions of the "Sunmodule Bisun protect 290" module contain different values for "Energy boost": 0%, 6%, 10%, 20% and 25%. This means that a higher "Energy boost" version of the module is used for a higher reflected irradiance on the rear of the module. We have already implemented different versions for the Bisun 270 and 280. Simply open the attached project and the modules are in your database, then simply select the appropriate module with the corresponding "Energy boost" from the database. To use a variant of the Bisun 290, simply create a new pv module in the database and transfer the corresponding electrical parameters from the data sheet. Which variant or which "Energy Boost" you need I unfortunately cannot estimate and the corresponding selection is up to you. I hope this helps, Marcel Solarworld_Bisun_SW_270_duo.pvprj Solarworld_Bisun_SW_280_duo.pvprj
-
Oh, I'm sorry, I misunderstood your question. Unfortunately this is not possible in PV*SOL at the moment, we are aware of this problem and are considering how best to solve it. Kind regards, Marcel
-
Hello Piotr, the PPD is the generator connection box / generator junction box , that is, the box in which all DC cables from an mpp tracker are connected. Kind regards, Marcel
-
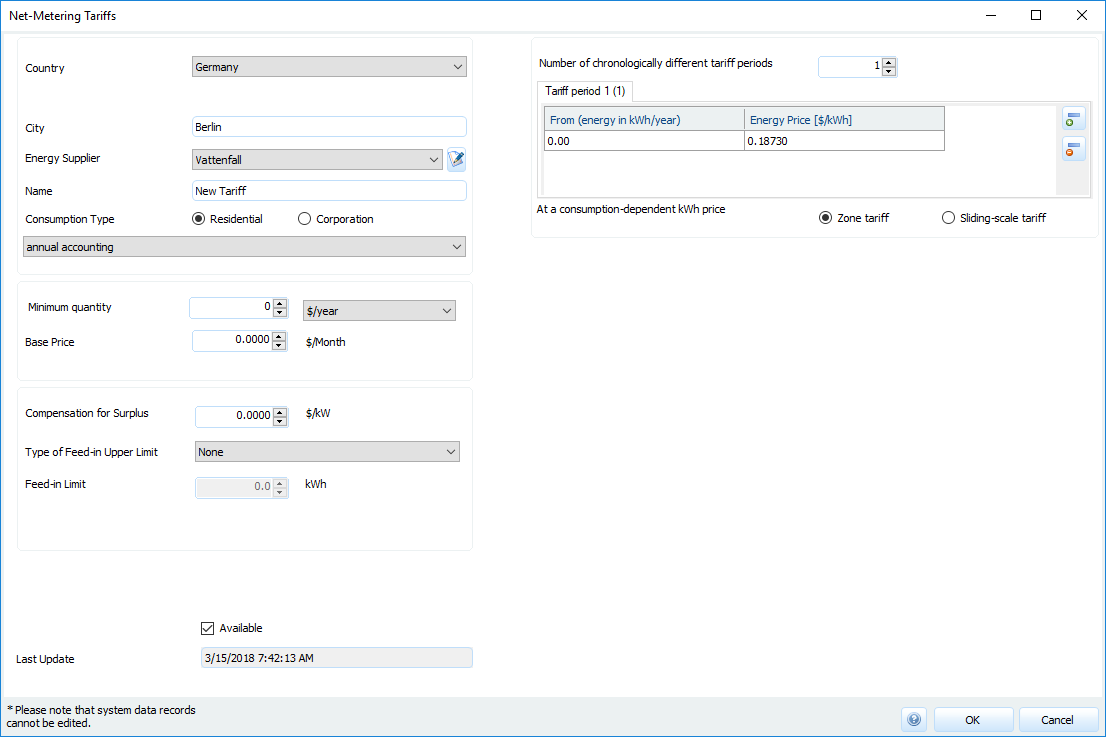
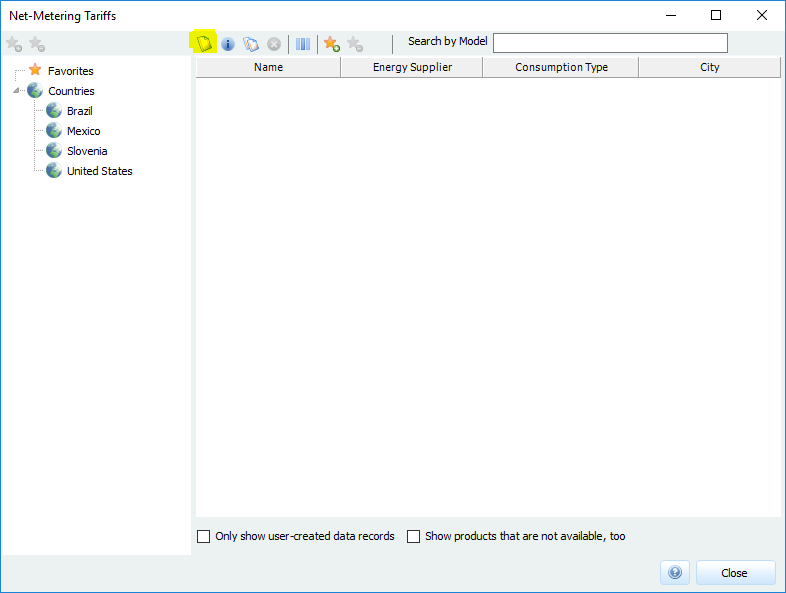
For Poland, PV*SOL does not have standard tariffs for net-metering tariffs, so you have to create your own tariffs. Go to Databases > Net-Metering Tariffs abd create a new net-metering tariff A new dialog opens in which you can set up your own tariff. Kind regards, Marcel

-
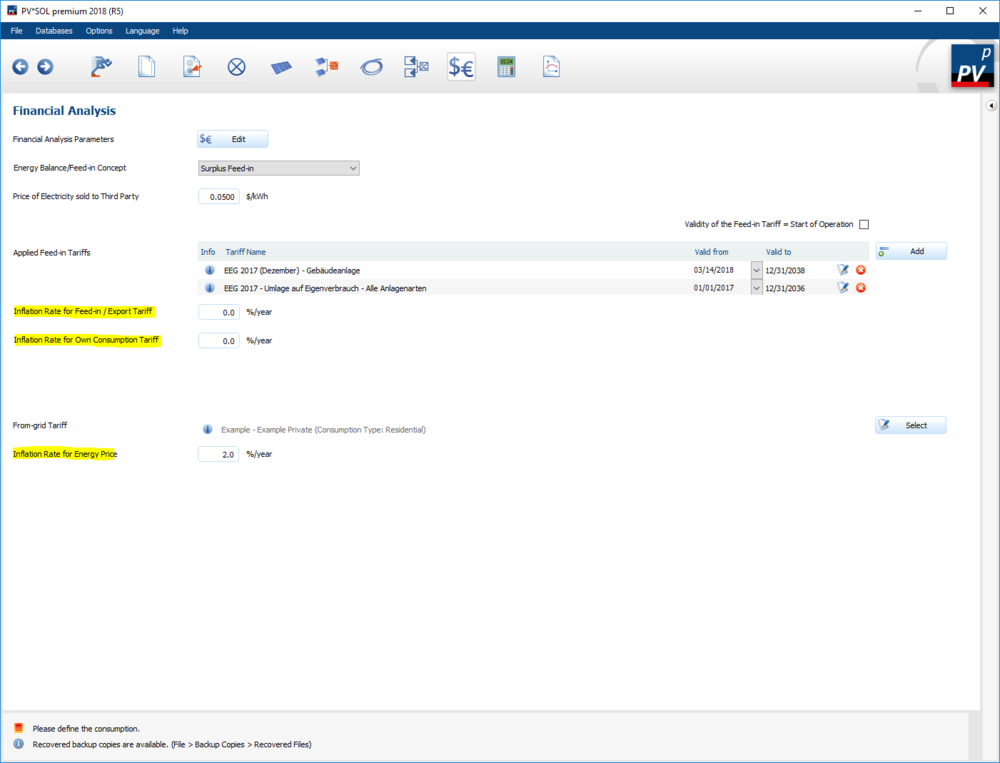
Hello Jakub, welcome to our forum! To take the rise in energy prices into account, select an appropriate inflation rate from the "Financial Analysis" page: Inflation Rate for Energy Price Inflation Rate for Own Consumption ... The changeable inflation rates depend on the feed-in concept (e. g. full-feed, net metering...). Kind regards, Marcel
-
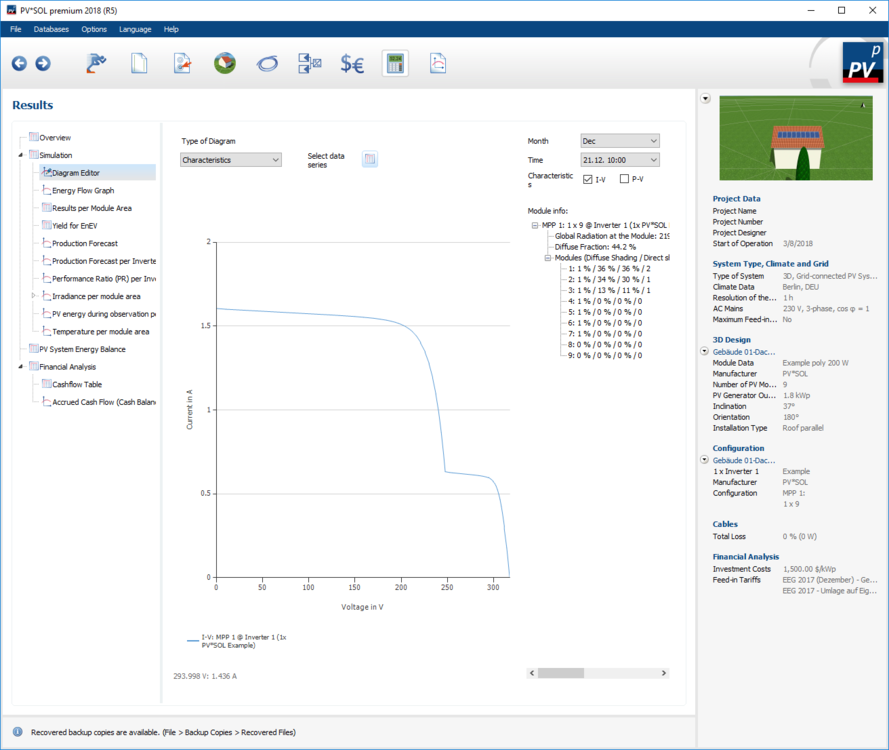
Oh, yeah, sorry I forgot to mention it.The i-v curves are one of the new features in PV*SOL 2018, such as the import of different 3D models or polystring configuration. Details can be found in our Release Notes. https://www.valentin-software.com/en/support-service/customer-service/release-notes/pvsol-premium Kind regards, Marcel
-
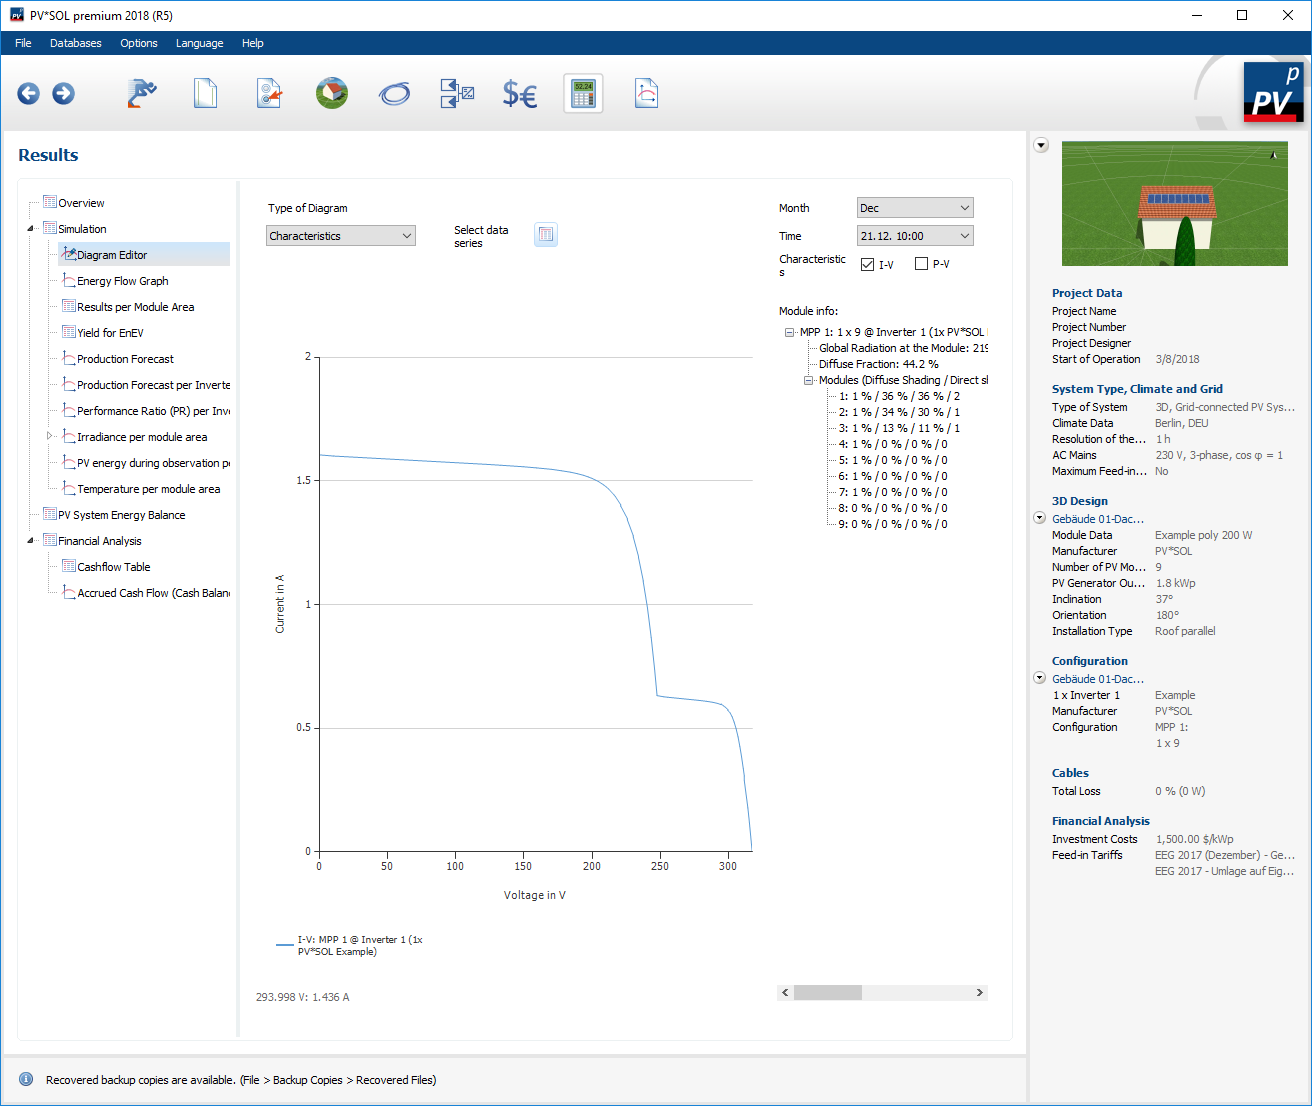
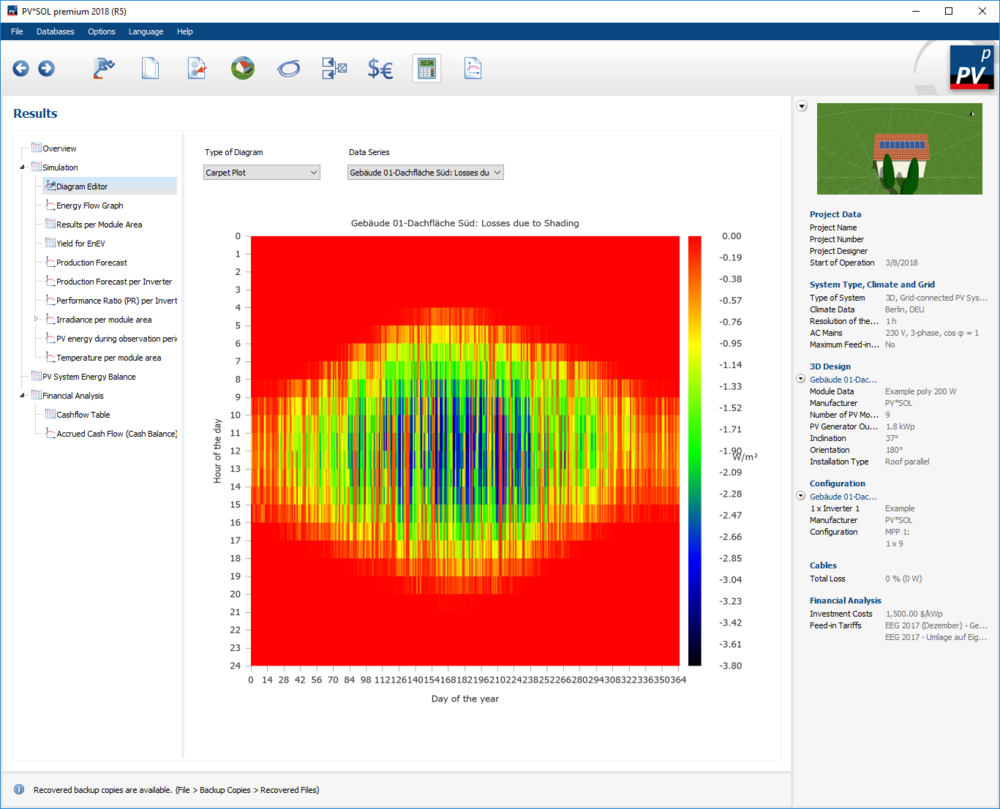
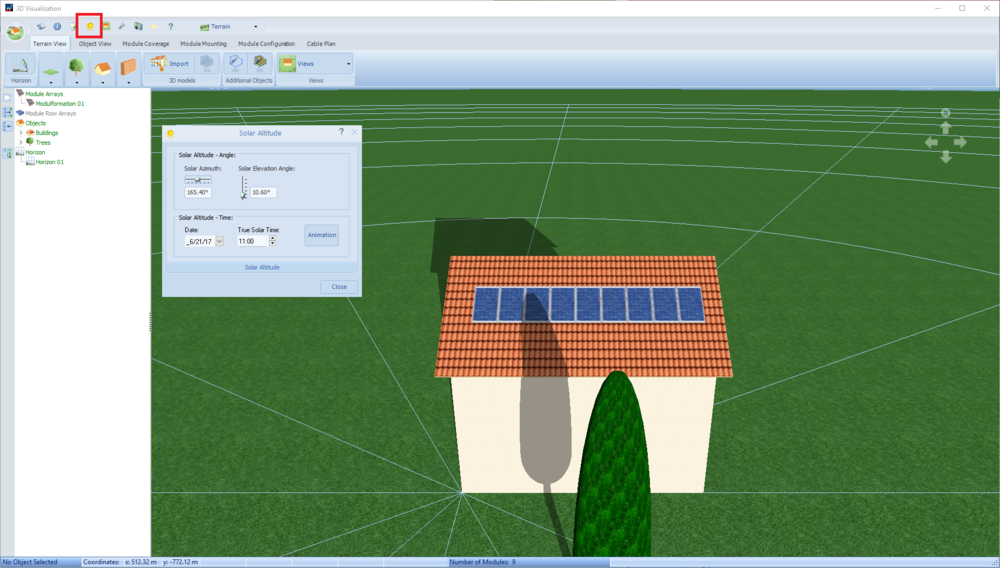
Hello Ahmad Elghobashy, the "Module-specific Partial Shading" are the losses due to shading on the specific module. This means that these are shadow losses due to trees, other buildings, etc., which have a negative effect on the i-v-curve of the respective module. To illustrate the negative effects on the i-v-curve, simply activate the "Record characteristic curves fo r MPP tracker modules" simulation option under Options > Project Options > Simulation. i-v-curve with shading. To see the losses in a graph you could use the "Carpet Plot". Simply select the data series "Module Area Name: Losses due to shading". In addition, you can display the position of the sun (solar altitude) in our 3D-visualization. To do so, click on the sun at the top of the program (red frame in the picture). Kind regards, Marcel
-
Hello Chow, welcome to our forum! Unfortunately, we used two different transtaltions for a parallel roof installation type. This means that "Flush Mount - good rear ventilation" and "Roof parallel" are the same and the option for roof parallel systems. Kind regards, Marcel
-

Vorgehen zur schnellen Simulation einer aufgeständerte Ost-West-Anlage
developer_mm replied to e4plus's topic in PV*SOL
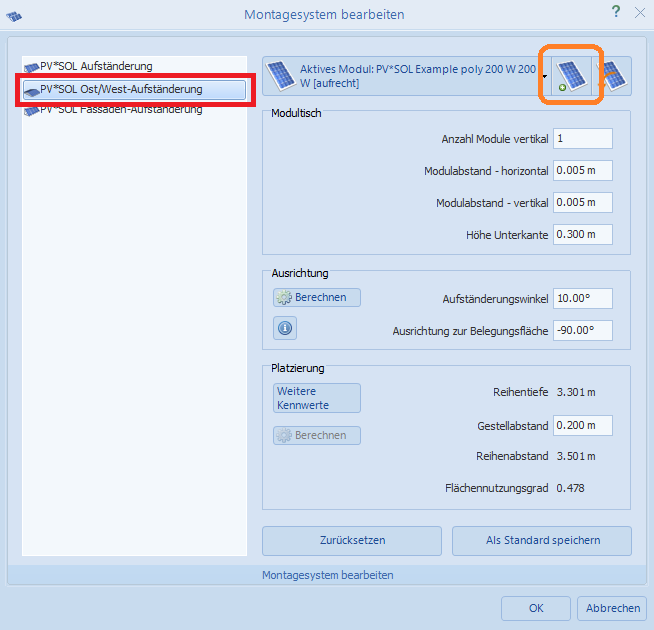
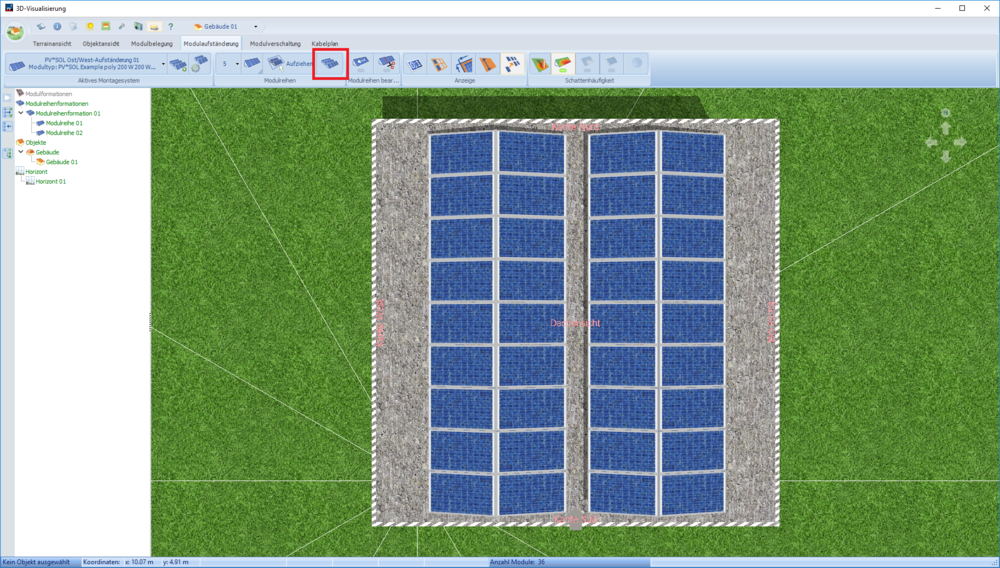
Hallo dag, das Vorgehen, um in der 3D-Planung eine aufgeständerte Ost-West-PV-Anlage zu erstellen ist wie folgt: auf dem gewünschten Objekt (Gebäude), die zu belegende Fläche auswählen auf dem Reiter "Modulaufständerung" , ein "Neues Montagesystem" definieren (siehe Bild; roter Rahmen) - Im Dialog "Montagesystem bearbeiten" das Montagesystem konfigurieren. Dazu das Ost/West-Montagesystem auswählen (roter Rahmen) und anschließend das gewünschte PV-Modul (oranger Rahmen). Abschließend noch die geüwnschten Angaben zum Gestellabstand etc. und das Ost/West-Montagesystem ist fertig konfiguriert. Nun kann die Dachfläche mit dem konfigurierten Montagesystem belegt werden. Am schnellsten ist es mittels der automatischen Belegung (roter Rahmen) Abschließend werden die PV-Module wie gewohnt über den Reiter "Modulverschaltung" verschaltet Viele Grüße Marcel
-
Definition of "AC Power Rating" and "AC Active Power"
developer_mm replied to S.F.'s topic in PV*SOL
Hello S.F., welcome to our forum. Your understanding of inverters is absolutely right. The "AC Power Rating [kVA]" should be 40 kVA. In the current PV*SOL premium 2018 version, the inverter has the correct specifications, as you can see in the picture. I guess there are two possible reasons for this. The database entry could be incorrect or the inverter specification has been changed. It looks like you are using an older version of PV*SOL, I would recommend upgrading to PV*SOL premium 2018. We are constantly developing new features. Further information can be found here: Program details: https://www.valentin-software.com/en/products/photovoltaics/57/pvsol-premium Release Notes: https://www.valentin-software.com/en/support-service/customer-service/release-notes/pvsol-premium However, you can also create your own inverter in the database. I would recommend that you copy the existing inverter and change the incorrect information according to the data sheet. Kind regards, Marcel P.S. I have deleted your second and double entry in the german forum area.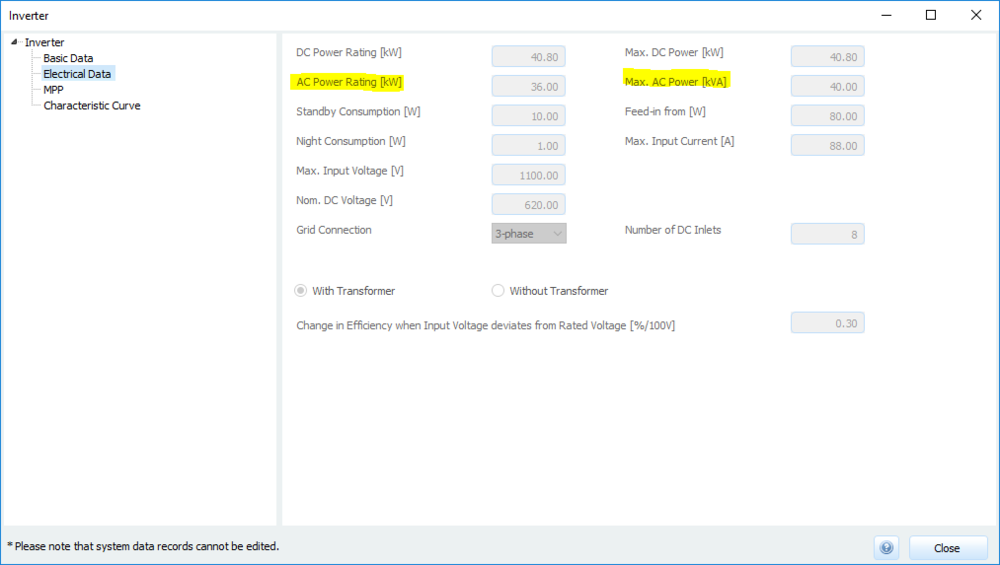

-
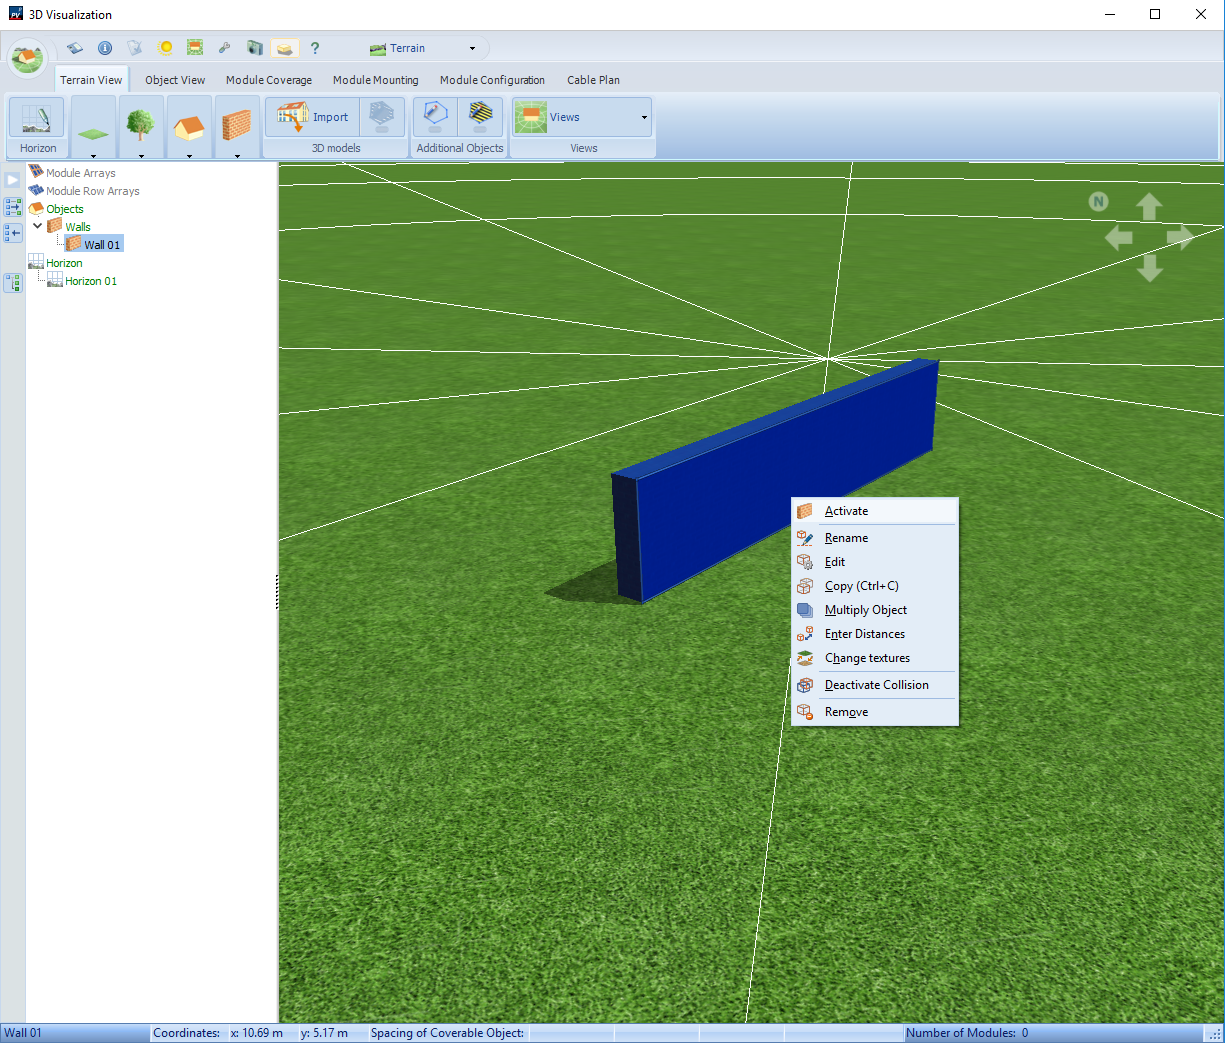
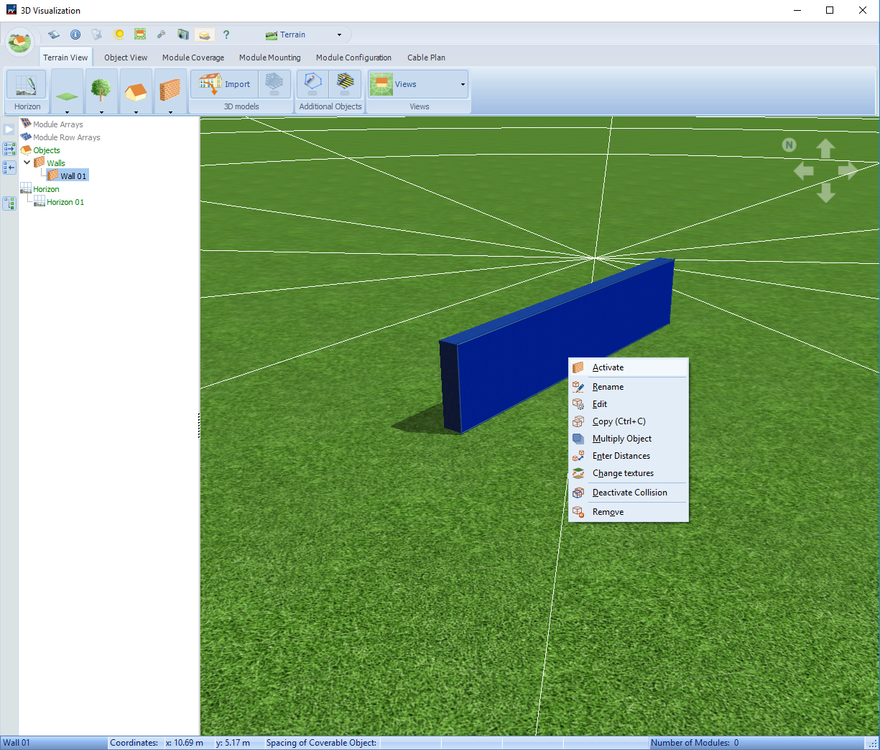
Hi Nils, no, you don't have to add a wall to your object. Simply activate the part of the object on which you want to place modules. To activate the part of the object, right-click on it and select "activate". Kind regards, Marcel
-
To your second question: Is there a way in PV-Sol to search for PV-panels with a 'portrait bypass configuration? Unfortunately, it is not possible to search directly in PV*SOL to check whether there are landscape or portrait bypass configurations. But you can check a specific PV module in the database. On the page "Electrical Data" you will find the information you need.

-
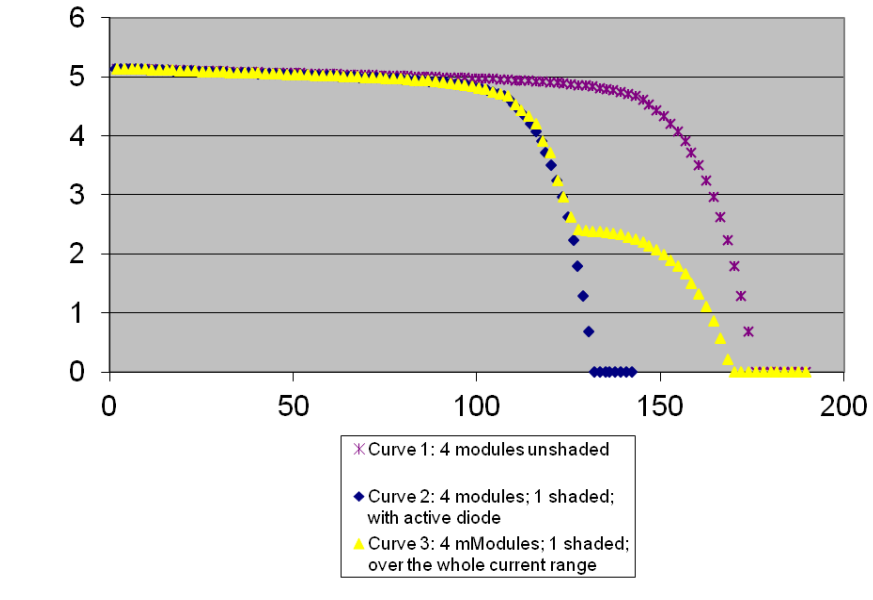
Hello Yvar, welcome to our forum! PV*SOL simulates on substring level of the PV modules so that the losses due to active bypass diodes are taken into account. Each substring will be checked whether there is a shadow in this substring or not. If there is a shadow, the bypass diode is active (curve 2 & curve 3), otherwise not. PV*SOL assumes from this that the shaded substring are never completely in shadow, but that there is always diffused radiation on the shaded parts (curve 2). There is therefore a I-V-curve with lower current for these cells as well. If the resultant MPP phase current is less than the short circuit current for the shaded cells, the bypass diode is not active and the complete module works with low current and high voltages. We therefore take these effects into account by working with yellow phase curve 2 when calculating the complete generator characteristic curve. I-V-curve (pretty old one, but it represents thematic well enough) Kind regards, Marcel
-
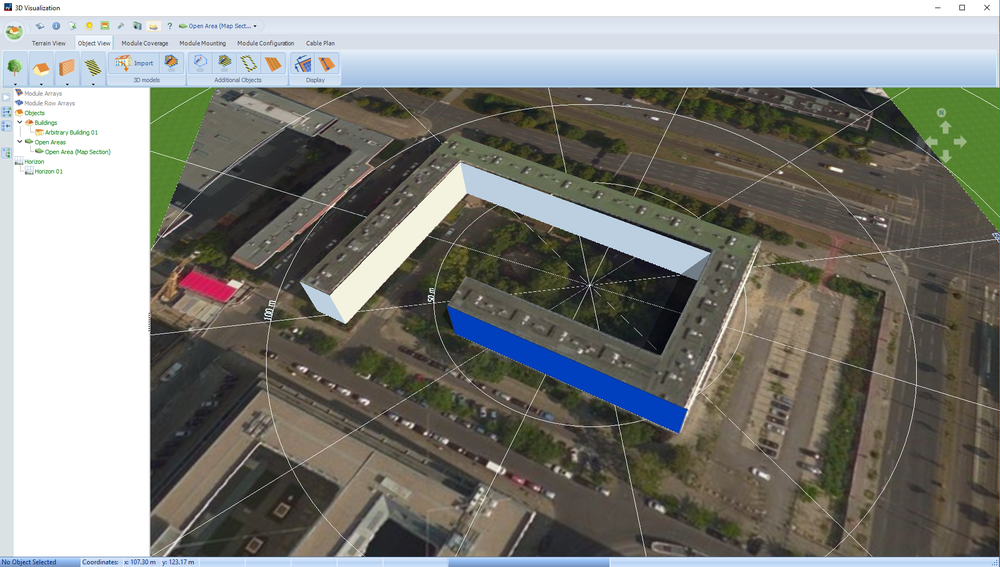
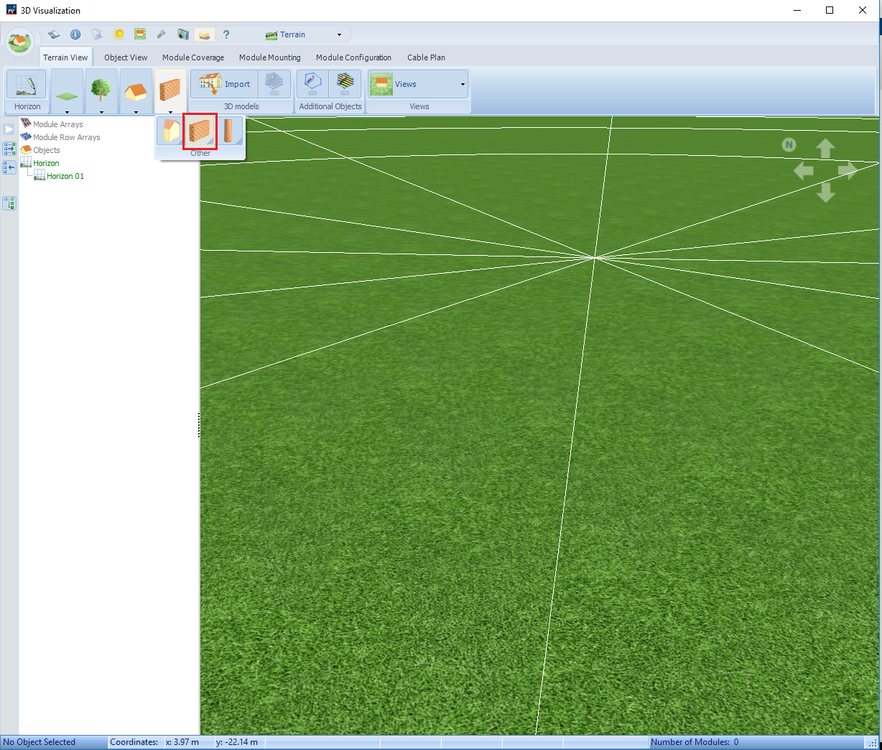
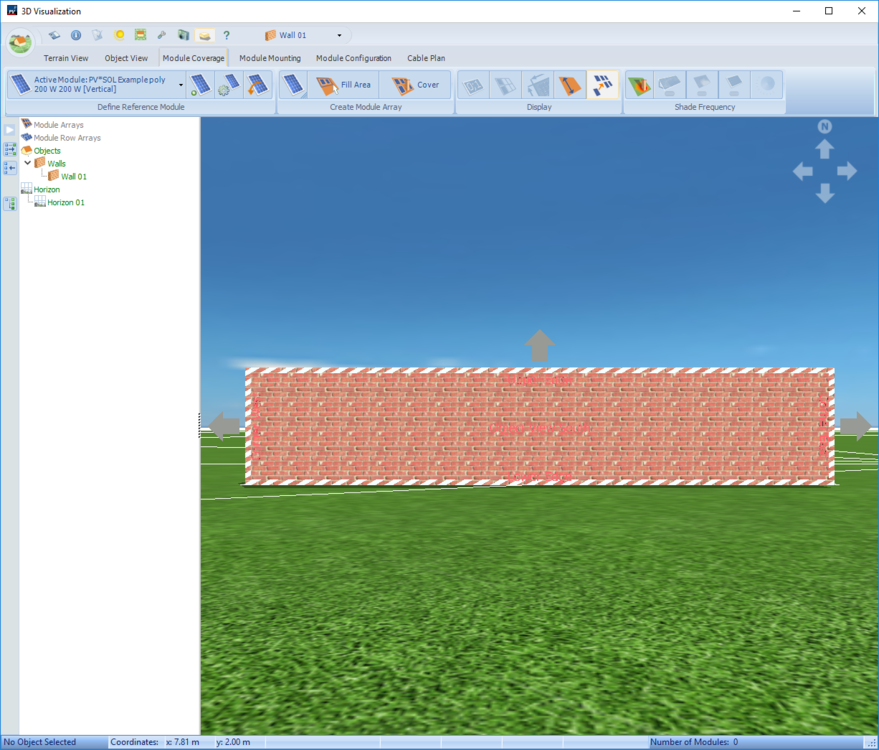
Hello Nils, welcome to our forum! The quick and short answer is yes, it is possible to mount and simulate solar panels on a wall. To do so, place a wall: Activate the wall: and finally, place the modules: Kind regards, Marcel
-
Halo Jarn, vielen Dank für die Projekte, ich habe mir die Verschaltungen und die Energiebilanzen der Projekte angeschaut und miteinander verglichen. Vergleicht man die nach Osten (MPP-T 2 & MPP-T 3) und Westen (MPP-T 1) ausgerichteten PV-Module zeigt sich, dass das Projekt "Verschaltung_prop_alle_betroffen" die besseren Ergebnisse erzielt. Sowohl bei den nach Osten als auch bei den nach Westen ausgerichteten Modulen. Die "Modulspezifische Teilabschattung" (siehe Ergebnisse > Energiebilanz > Verschaltungen) ist bei beiden Varianten in Summe gleich, was auch zu erwarten ist, da sich von der Modulanordnung nichts geändert hat. Der Hauptgrund für den höheren Ertrag sind die unterschiedlichen Verluste beim "Mismatch (Verschaltung/Abschattung)". Im Projekt "Verschaltung_prop_alle_betroffen" sind die Schatten auf den einzelnen Strängen relativ gleichmäßig verteilt, hingegen ist beim Projekt "Verschaltung_prob_Winkel_ optimal_4xost" hauptsächlich ein Strang sehr stark vom Schatten betroffen. Diese hohen Verschattungsunterschiede zwischen den Strängen innerhalb eines MPP-Trackers führt zu höheren Verlusten durch "Mismatch (Verschaltung/Abschattung)". Ich hoffe das beantwortet die Frage zu den Ursachen der Ertragsunterschiede. Viele Grüße Marcel P.S. Bei interesse habe ich mal meinen durchgeführten Vergleich als Excel-Tabelle angehangen. Vergleich Energiebilanz.xlsx
-
Hi Ahmad Elghobashy, the performance ratio is the ratio between the actual pv energy and the theoretical maximum pv energy. The actual pv energy is, as you have already mentioned, the "PV energy (AC) minus standby use", but the theoretical maximum is not the "Rated PV Energy", because there are already some influences on the radiation like soiling and reflection. The correct formula for the performace ratio (PR) is: PR = ("PV energy (AC) minus standby use") / (" Global Radiation at the Module" - "Reflection on the Module Interface") * module area * module efficiency )) In your case, that would be: PR = 114,960.40 kWh /[(2,041.7 kWh/m² - (- 33.13 kWh/m²)) * 414.11 m² * 0.1681] PR = 0.79594 = 79.6 % Kind regards, Marcel
-
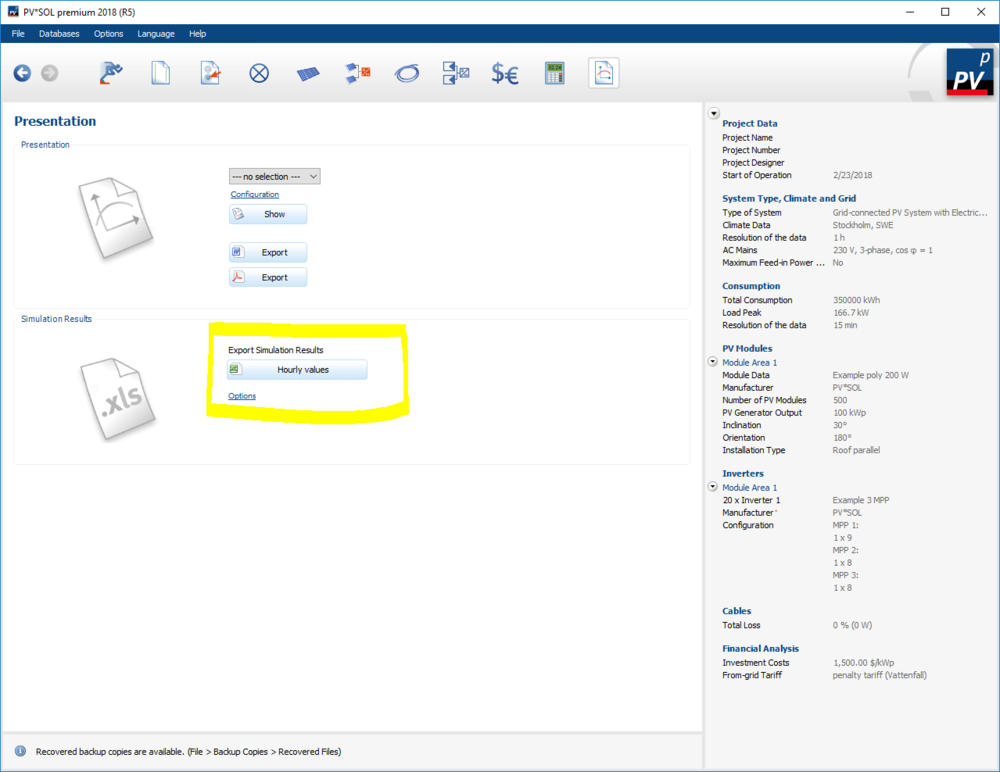
Hi Patrik, sadly you can't do this directly with PV*SOL. The fixed price per month and the transfer fee aren't a problem. Just create a new "From-grid Tariff" in the Database. Your fixed price per month would be the base price and the transer fee the energy price under the tariff period. I have made an example for you (attached image). Unfortunately, you have to calculate the penalty savings yourself. To do so, simulate your pv-system and then export the simulation results (on the last page; attached image). In this *.csv-file you can find two columns called "Energy from Grid" and "Consumption". "Consumption" is the old load profile and "Energy from Grid" would be the new load profile. Just extract the maximum values of each month for both columns. Please don't forget, your results are displayed in kWh, so you have to convert the energy consumption into kW. Kind regards, Marcel