


developer_mh
-
Posts
1,855 -
Joined
-
Last visited
-
Days Won
173
Everything posted by developer_mh
-
By the way, here is an overview over the new features of the next release: https://www.valentin-software.com/en/news/product-announcements
-
Hi Daniel, in the new version it will be possible to import a number of 3D formats into PV*SOL premium. The beta phase just started, so we look forward to release the new version by the end of November/beginning of December. Dwg files will not be supported in the first place, however. The final list of supported formats is not yet fixed, but at the moment it looks like that .x, .obj, .dae, .blend, .3ds, .ase, .lwo, .ply, .stl and .ms3d will be possible to import. Kind regards, Martin
-

Hybrid PV / Diesel Generator Option with SMA Fuel Saver Controller
developer_mh replied to damonl's topic in PV*SOL
ok, I understand now. No, that is definetely not possible to accomplish right now. But is it never possible to cover the entire load with 100% PV on sunny days with these systems? That seems a bit odd to me... -
Hybrid PV / Diesel Generator Option with SMA Fuel Saver Controller
developer_mh replied to damonl's topic in PV*SOL
Hi Damon, you are right, these aspects are not implemented in the simulation right now. What do you mean by energy capacity? Are these values a percentage of the instantaneous load (power), or is it in terms of daily or annual energy share? Kind regards, Martin -
Hybrid PV / Diesel Generator Option with SMA Fuel Saver Controller
developer_mh replied to damonl's topic in PV*SOL
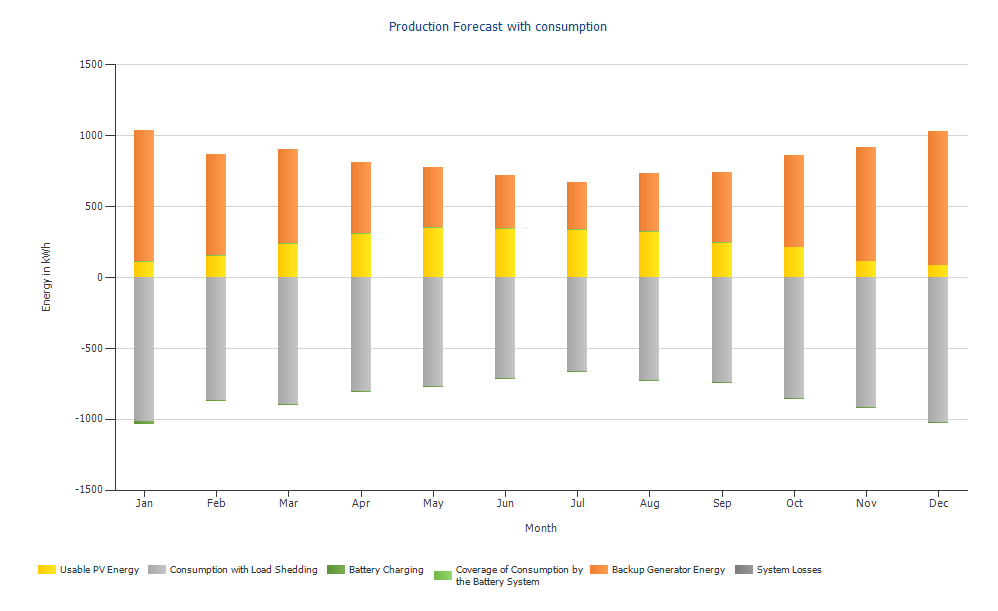
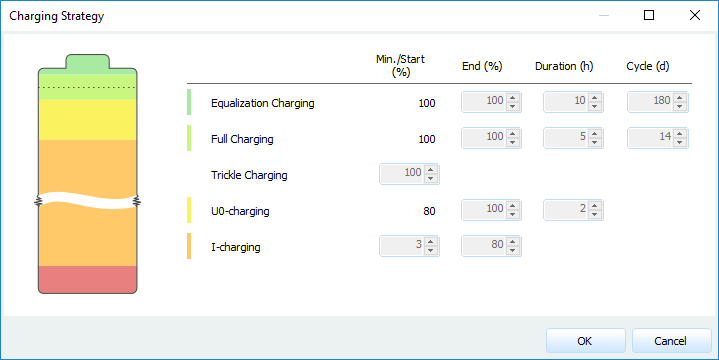
Hi Damon, while we haven't implemented the exact control mechanisms of the SMA Fuel Saver, you could do the following to mimic a hybrid PV system: Go to the battery and battery inverter page, select the first cluster in your system configuration Click the "Battery Management" link Disable the battery as good as possible with these settings: It will not be possible to avoid their usage completely, but you can limit their participation quite effectively, so that your load will be covered by PV and diesel only: Hope that helps, kind regards, Martin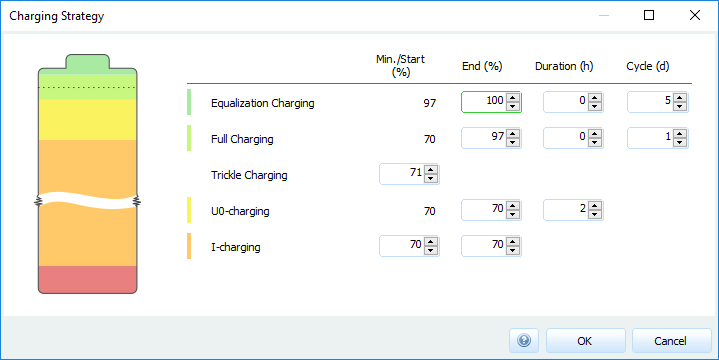
-
Hi Daniel, a very good question you ask there. There are different approaches when dealing with climate data over a long period of time. And as always, there are pros and cons for every approach. The approach most people use is to compile a representative collection of days out of the measurements of the past 10 or twenty years, a so-called typical meteorological year (TMY). The climate data we use is from MeteoNorm, and they use data over a period of twenty years, sometimes 10, sometimes 30. That means, in the final dataset the hourly values of one day are not averaged or max/min-ed over the years, but taken from one specific year. The data for the next day are then taken from another year, perhaps. You will find a lot of information on how TMY are compiled on the internet, here is a good start: https://www.nrel.gov/docs/fy08osti/43156.pdf But you are totally right, the amount of self consumable solar energy at a given moment depends strongly on the specific value of solar irradiance at the given hour (or minute) and it would change perhaps significantly depending on which measurement year you use. It is important to understand that TMY data do not give any guarantee regarding the values at a specific point in time. What they guarantee is that the data over the year is typical for the location in question, that it is very probable. And while you cannot quantifiy the probability of a specific value for a given point in time, you can quantify the overall uncertainty of your climate data. Here is a good presentation to start: http://www.meteonorm.com/images/uploads/downloads/Accuracy_of_Meteonorm_7.pdf The same problem you'll have with the load profile by the way. Perhaps you have measured the load profile of one year for a given household or company. But there is no guarantee that the 3kW that you measured on January 2nd at 9am will really occur in reality afterwards. But good news is that there are also standardized "typical" load profiles for households and different kinds of enterprises that minimize the uncertainty over a year. But no, they do not solve the actual problem you mentioned. The only solution I could think of would be to use all twenty datasets for solar irradiance from the last twenty years and make twenty simulations, and then have a look at the minimum, maximum and average self-consumption. And then you would have to repeat that with several years of load measurements. I don't know if this is feasible But it would be a very interesting research topic! Kind regards, Martin
-
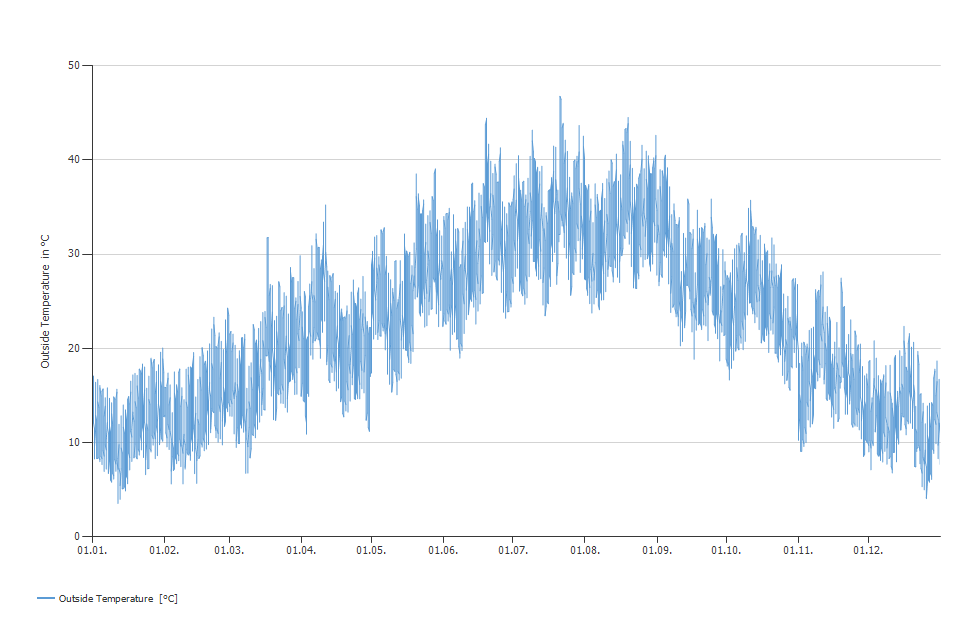
I really don't know what a recommended temperature for West Tunisia would be. In PV*SOL, I had a look at the climate data from Tozeur/Nafta, and the temperature looks like this: Minimum ambient temperature seems to be around 4°C. The cell temperature usually is higher, due to the irradiance, so I think if you go with 0°C cell temperature, you should be safe, even for worst case scenarios. But perhaps there are local guidelines you could follow? Kind regards, Martin
-
Hi Ahmad, thanks for your question! This temperature refers to the cell temperature. In STC (Standard Test Conditions, for measuring the nominal power, voltage and current), you'll have 25°C for cell temperature at 1000 W/m². But when configuring a system, you also want to make sure that a certain voltage is never exceeded by your PV array, so you'll calculate with lower cell temperatures. So you have to estimate the lowest ambient temperature at the given location (at daytime of course). For Europe, you normally just use -10°C at 1000 W/m² and you are on the safe side. Does that answer your question? If not, do not hesitate to ask! Cheers, Martin
-
ok, please check your private messages.
-
Hi Martin, before synthesizing the one-minute data, the algorithm is checking the synchronity of the hourly global irradiance data with the clear-sky irradiance. In your case tha data seem to be synchroneous in the first place, but in a deeper check the algorithm detects a shift of the irradiance distribution to the afternoon. In other words, cumulated over the year, you have more often high irradiance values in the morning than in the afternoon, and the relation of it surpasses a threshold and therefore your data is considered as not in sync. In the next version, the check is a lot less strict and I was able to synthesize your data into one-minute values. So the question would be if you can wait until the new version comes out in mid November? An alternative would be that I provide you the database file that contains the synthesized data. Please let me know what you would prefer. Kind regards, Martin
-
Hallo Ally, nein, da gibt es leider keinen Trick. Wir haben dieses Feature schon lange auf dem Zettel, das stimmt. Bisher konnten wir es aber noch nicht umsetzen, da uns schlicht die Zeit fehlt. Daher wird es auch leider in der nächsten Version, die im November erscheint, nicht möglich sein, aufgeständerte Anlagen zu verkabeln. Dafür wird es aber eine Menge anderer neuer Features geben, die sich die Leute ebenfalls schon lange gewünscht haben. Man kann es als Entwicklerteam mit begrenzten Ressourcen natürlich nicht allen recht machen, auch wenn man nichts lieber täte. So haben wir eben unsere Todo-Liste, unsere Priorisierung und arbeiten so viel davon ab, wie wir können. In der Hoffnung, dass unser Programm trotzdem eine Hilfe ist im Planungsalltag, Martin
-
Hallo Goofy, danke fürs Melden! Ja, ist leider ein bekannter Bug, da kann man als User nichts anders machen. Wir haben ihn auf der Liste und werden ihn beheben, sobald die höher priorisierten Bugs behoben sind. Bis dahin muss man wohl oder übel die Antenne manuell wieder zurechtdrehen. Beste Grüße, Martin
-
Hi Giannis, unfortunately I can't find your bug reports in our system. The only recent bug reports relating to that exception contain a lot of modules and seem to have crashed also while configuring modules. Could you perhaps send us a project file where this crash occurs? This would be very kind. You can send it privately here via private message. And some information about your system woul be very helpful (Windows version, RAM, PVSOL version etc.) Thanks! Martin
-
Hi Giannis, thank you for submitting this exception. We have some related bug reports already. Can you reproduce it? That is, could you describe a way how to get to this exception? Or does it occur randomly? Which version of PV*SOL do you use? Perhaps we can track this bug down with your help! If possible, also send a bug report when it crashes the next time. Thanks a lot in advance, Martin
-
Hallo REN, ja, wir glauben auch, dass Mieterstrom-Modelle immer wichtiger werden. Die Thematik sehr komplex, und noch haben wir unsere Wirtschaftlichkeitsberechnung nicht entsprechend angepasst. Wir empfehlen für solche Fälle aber wärmstens das Tool pv@now der Deutschen Gesellschaft für Sonnenenergie: https://www.pv-now.de/ Dort sind alle gängigen Betreibermodelle hinterlegt. Beste Grüße, Martin
-
Hi Felipe, this would be a good idea actually. Unfortunately we don't speak portuguese. So we will have to ask our partner in Brazil if he is willing to moderate a portuguese forum. We will keep you updated! Kind regards, Martin
-
Hallo LenLo, wenn du in der Modulverschaltung bist (oben bei den Tabs), und die gewünschten Module markiert hast, machst du einen Rechtsklick drauf und wählst 'Zum Dialog Modulfächen definieren hinzufügen'. Danach die restlichen Module auswählen und ebenfalls zum Dialog Modulflächen definieren hinzufügen. Die so definierten Modulflächen lassen sich jetzt entweder automatisch oder manuell mit einem Wechselrichter mit 2 MPP Trackern verschalten. Viel Erfolg und beste Grüße, Martin
-
Questions about shadow from snow and setting of soiling
developer_mh replied to Solcellekonsulenten's topic in PV*SOL
Hi Solcellekonsulenten, thanks a lot for your question. Unfortunately, I can not see the image or the figure that you posted.. But apart from that, we do not calculate with information on snowfall or any other precipitation from the climate data provided via MeteoSyn (which is based on MeteoNorm from Meteotest, Switzerland). So the engineer has to estimate the losses due to snow coverage as well as soiling losses and enter these values in PV*SOL. I think in the future we will be able to provide such a snow model that estimates the snow cover on the modules based on ambient temperature, precipitation, module angle, framing and mounting and so on. We already collected some of these models, but we need to validate them first and for that we need good measurement data and time. Kind regards, Martin -
Hi Damon, yes, these 100 W/m² would be equal to a efficiency of 10%. Let me know if you succeeded! Regards, Martin
-
Hi Damon, you could try to create a new module in the database and enter all the details that you know of so far. The dimensions were published, and if you found out the specific power in W/m² you can calculate the nominal power of a tile by multiplying it by the area. So, one tile is 184 mm wide and 365 mm long, which gives 0.067 m². I don't know the specific power you have found out, but if I should estimate the efficiency of the tiles, I'd say they have around 10 %. This would give a nominal power of 1000 W/m² * 0.067 m² * 0.1 = 6.7 W. Then, when you enter the voltage and current details on the next page, I would recommend to set the number of cells to 2, and adjust the voltage values accordingly. After that, adjust the currents: In the section electrical data set the number of cells to 2. In the STC section, enter the nominal power of 6.7 W in the field top right Change the voltage values to a 2/60th of their original values: MPP: 28.3 V / 60 * 2 = 0.943 V open circuit: 36.1 V / 60 * 2 = 1.203 V The nominal power of 6.7 W is the product of MPP voltage and current, so you have to adjust the MPP current to 6.7 W / 0.943 V = 7.12 A. Since the ratio of MPP current to short circuit current should be left as is, you also have to change the shor circuit current to 7.12 A * ratio_I = 7.12 A * 7.7 A / 7.07 A = 7.75 A The thermal voltage coefficient should be adjusted as well, set it to -0.35 %/K. With those values you should be good to go. Of course that is mere guessing, but if you really want to simulate these systems already, this is what you could do. Kind regards, Martin
-
Hi Damon, yes, the details on the solar roof of Tesla are very limited, in contrast to their marketing. On their website you can even order them already, without having seen any details/datasheets or whatever. I wonder who does this... but if you find out something, I think everyone here would be happy if you could share it. Thanks and kind regards, Martin
-
Hi Damon, thank you for your question! Indeed, you cannot enter the number of battery systems right now, this feature will be available in the next version. What you could do for now is to copy the battery system in the database and adjust the power and capacity values accordingly. If you want to go with three Tesla Powerwall systems, you would have to triple the charging power values and the battery capacity, for example. The message that the maximum charging power is insufficient refers to the boost charging mode (U0-charging), which depends on the SOC thresholds of the charging strategy setup and the capacity of your battery. For example, the Tesla Powerwall 2.0 AC from the database has a start SOC of 80% and an end SOC of 100% for the boost mode, which has to finish in 2 hours. The C10 battery capacity is 270 Ah, the batteries run on 50.1 V, so the rated energy would be 270 Ah * 50.1 V = 13.5 kWh. So the power electronics have to charge 20% of 13.5 kWh in 2 hours, which equals to 2.7 kWh in 2 hours. If the charging would run with constant power, one would need 1.35 kW to accomplish that. But the U0 charging modes run with constant voltage while the current decreases exponentially, and because P=U*I, the charging power also decreases exponentially. This is done because batteries need to be charged very carefully when they are nearly full in order to avoid over charging. But this also means that the initial power that is necessary for U0-charging is much higher than 1.35 kW. To calculate the necessary power you'll need to solve the integral of the exponential power curve. In this case the initial power would be around 3.1 kW (where of course the charging voltage is higher than the 50.1 V nominal voltage). I hope this answers your question. If you have any further questions, please don't hesitate to ask! Kind regards, Martin
-
Hi Martin, you will have to convert the data into the format that you can see at the top of this thread. FF is the wind speed and RH is the relative humidity. From what I understand, this would be UM and FF2 from the AgroMetBase, my Norwegian is relatively limited though The important thing is that you can only import one year of data, and it must be a complete year, with one value per hour. 8760 values in total, otherwise the import will fail. 2013 seems to be complete for example. The name of the location and the coordinates have to go in the header, like so: Skjetlein 63.2027,-10.1802,512,-1,-30 Ta Gh FF RH 4.2 0.0 2.0 69.0 2.9 0.0 1.7 77.4 1.7 0.0 0.2 84.4 1.4 0.0 0.0 87.8 1.3 0.0 0.2 91.0 1.0 0.0 1.4 92.7 ... Notice the coordinates are in degrees and minutes, not decimal, although one might think so from the formatting. The decimal coordinates of Skjetlein are 63.34085° North and 10.3005839° East, which gives 63°20'27'' North and 10°18'02'' East in Degrees, minutes and seconds. So you'll have to put 63.2027 and -10.1802. Mind the negative longitude, as the dat file requires longitudes in Western direction. Also note the negative time zone. Another important thing is that you have only valid numbers in your text file. The AgroMetBase exports NULL if values are missing, which is happening for the temperature in 2013 for example. These missing values have to be filled up. I attached a *.dat file for you that you should be able to import in MeteoSyn. Skjetlein.dat Hope that helps! If you have any further question, please don't hesitate to ask. Kind regards, Martin
-
Ja, die neue, große Version von PV*SOL premium kommt im Herbst 2017 und wird den Namen PV*SOL premium 2018 R1 tragen, wir ziehen das Jahr immer etwas vor Wenn man zu diesem Zeitpunkt einen gültigen Wartungsvertrag besitzt, bekommt man auch das Update.
-
Hallo REN, tut mir leid, dass die Antwort etwas auf sich hat warten lassen, ich musste dafür ein wenig recherchieren. Es scheint so zu sein, dass der Skalierungsfaktor, den wir in die dxf schreiben, von den mittlerweile gängigen Programmen nicht mehr richtig interpretiert wird. Ich habe hier das gleiche Problem nachstellen können, in meinem Fall mit AutoDWG. Ich habe das Problem nun beheben können, es wird dann in der neuen Version behoben sein. Solange könnte ein Workaround sein, die richtige Dimensionierung im Programm selbst einzustellen. Bei AutoDWG DWGsee geht das unter Options -> Dimension Settings. Wahrscheinlich gibt es etwas vergleichbares in AutoCad LT. Der richtige Dimension factor wäre hier 1,64 / 9.89 = 0,1658. Ich hoffe, das hilft erstmal so weiter. Wie gesagt, richtig behoben wird das Problem dann in der nächsten Version (PVSOL premium 2018 R1), die kommt im Herbst. Beste Grüße, Martin