-
Posts
1,855 -
Joined
-
Last visited
-
Days Won
173
Everything posted by developer_mh
-
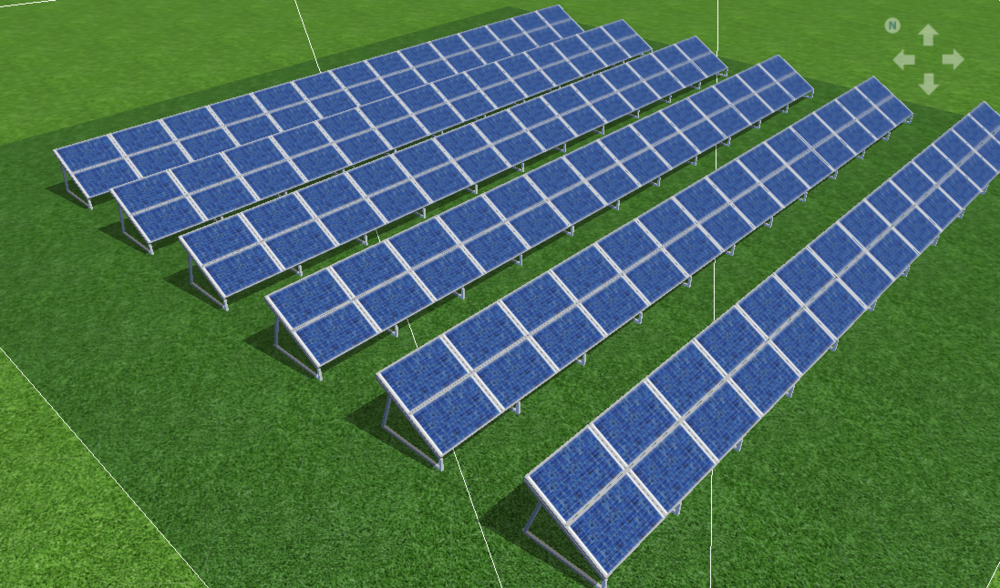
Hi Rodrigo, a solar park can be easily designed with the module mounting feature in the 3D environment. There you define the mounting system, which modules to take, row distance etc: If you need further help, please don't hesitate to ask. Kind regards, Martin
-
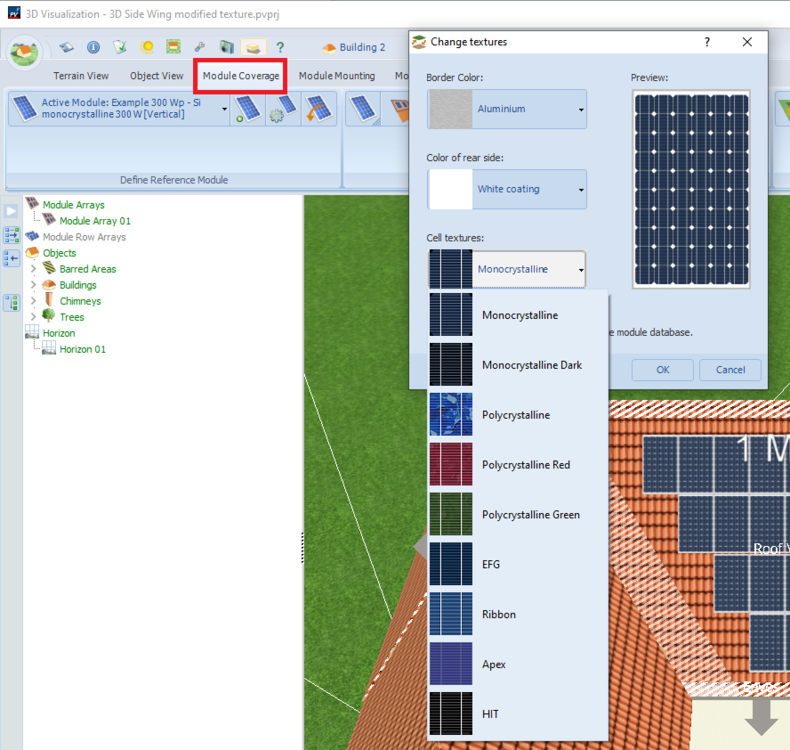
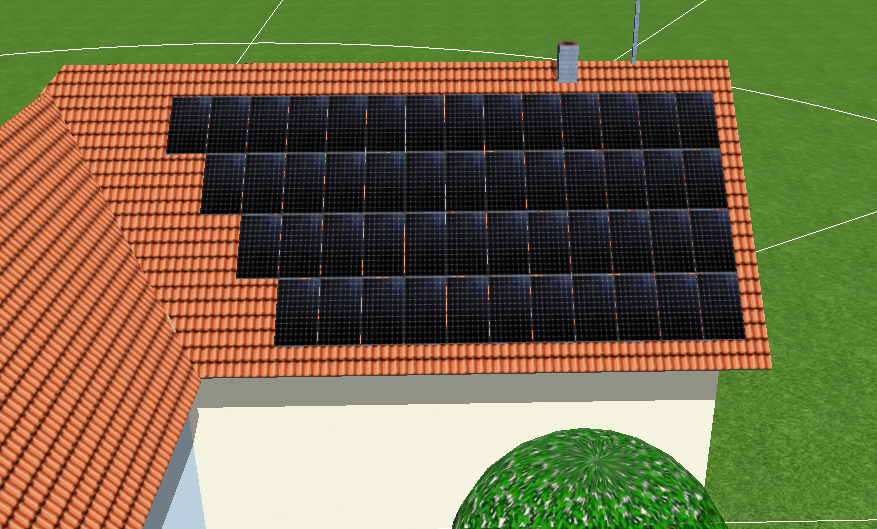
Hi Jordn, there are some predefined module textures that are available in the 3D mode of PV*SOL. Go to the tab "Module Coverage" and right click on the modules, then choose "Change texture". There you can choose various cell textures and also the color of the backsheet and the framing. Let me know if this is sufficient for you. There is also another way to change the module texture, but this involves some tricky file handling and is an unofficial (and unsupported) approach. But yes, it is possible to integrate the texture you posted: Kind regards, Martin
-
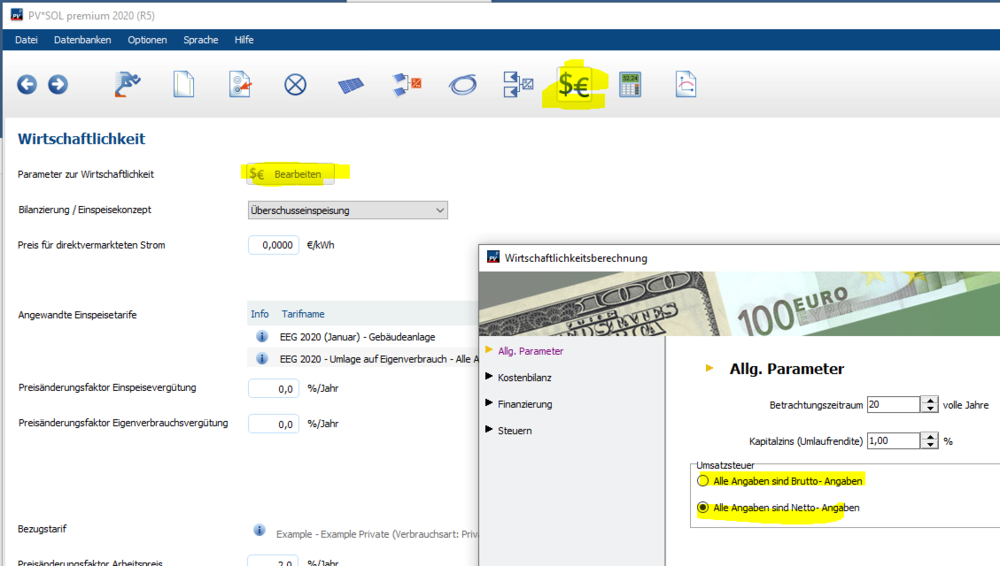
Hallo DDF, man kann wählen, ob man alle Angaben in brutto oder netto eingibt: Man wählt das also einmal, und muss dann alle Eingaben entsprechend konsistent halten. Beste Grüße, Martin
-
Hallo Anton, ja, diese Funktion wird in unserer Simulation generell so abgebildet. Es wird immer zwischen der minimalen und der maximalen MPP-Spannung der globale MPP gesucht. Wir gehen davon aus, dass das zu den grundlegenden Funktionen eines Wechselrichters gehört (also dass das alle können). Anders sieht es natürlich bei Festspannungs-Wechselrichtern aus. Beste Grüße, Martin
- 2 replies
-
- leistungsoptimierer
- dynamicpeak
-
(and 2 more)
Tagged with:
-

Eigenverbrauch in PV Sol Premium 2020 implementieren
developer_mh replied to julezfk's topic in PV*SOL
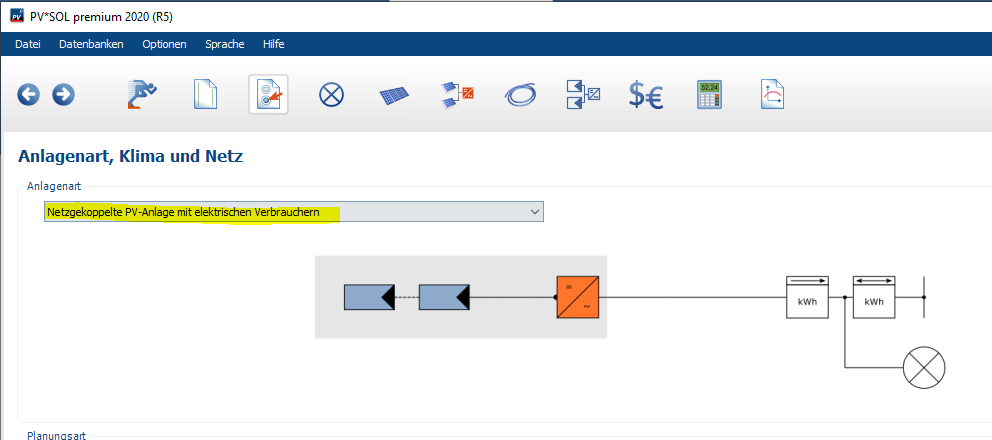
Hallo Julian, um PV-Anlagen mit elektrischen Verbrauchern zu rechnen, musst du zunächst die Anlagenart umstellen: Und dann ist es mit dem Eigenverbrauch so, dass er sich aus dem Zusammenspiel zwischen Energieproduktion der PV-Anlage und dem Energieverbrauch der Verbraucher ergibt. Man kann ihn daher nicht einstellen, so dass er beispielsweise 25% beträgt. Wenn die PV-Anlage im Jahr z.B. 10000 kWh produziert, und man einen Verbrauch von 2500 kWh hat, wäre das ja bilanziell übers Jahr gesehen ein Verbrauchsanteil von 25%. Es ist aber nicht gesagt, dass die PV-Anlage zu jeder Zeit die Last decken kann. Die Gleichzeitigkeit und die Leistungs-Profile von PV und Last sind hierbei ausschlaggebend. Auch der Zeitschritt der Simulation hat einen erheblichen Einfluss auf den Eigenverbrauch. Am besten wählst du mal ein paar Lastprofile aus, mal in 1min, mal 15min und mal 1h-Auflösung und variierst den Jahres-Energieverbrauch und simulierst das dann. Du wirst sehen, wie sich in den Ergebnissen der Eigenverbrauch ändert. Wenn du mehr Unterstützung brauchst, sag Bescheid. Beste Grüße, Martin -
Dear Aurora, could you please send us the project file that you used to produce the report? You can send it by private message. Kind regards, Martin
-
Dear Supportcenter EWS, as Marcel pointed out, we are aware of the fact that this feature is highly demanded by our customers. And be sure that we are not holding it back artificially. The undo function is quasi-impossible to implement in the existing code of the 3D environment. It would make it necessary to restructure the whole code from scratch. And since we are working on a completely new version of the 3D environment, it wouldn't make sense to rebuild the old version from scratch. We hope this is comprehensible. As a workaround against the worst cases of work loss we introduced the autosave feature some versions ago. With this you can jump back to earlier versions of your project if something unexcepted or undesired happened to your project. I know this isn't a full replacement for the undo function, but at least it avoids the loss of data or long hours of work. I am sorry to hear that. While we are always trying to produce the best simulation and planning software that is possible with our resources, we can't avoid that single customers aren't satisfied. If you want to stop using PV*SOL you can just refrain from extending your maintanance contract the next time. Kind regards, Martin
-
Dear Joao, you could try to follow the advice here in order to resolve this problem: Hope that will resolve the problem for you. Kind regards, Martin
-
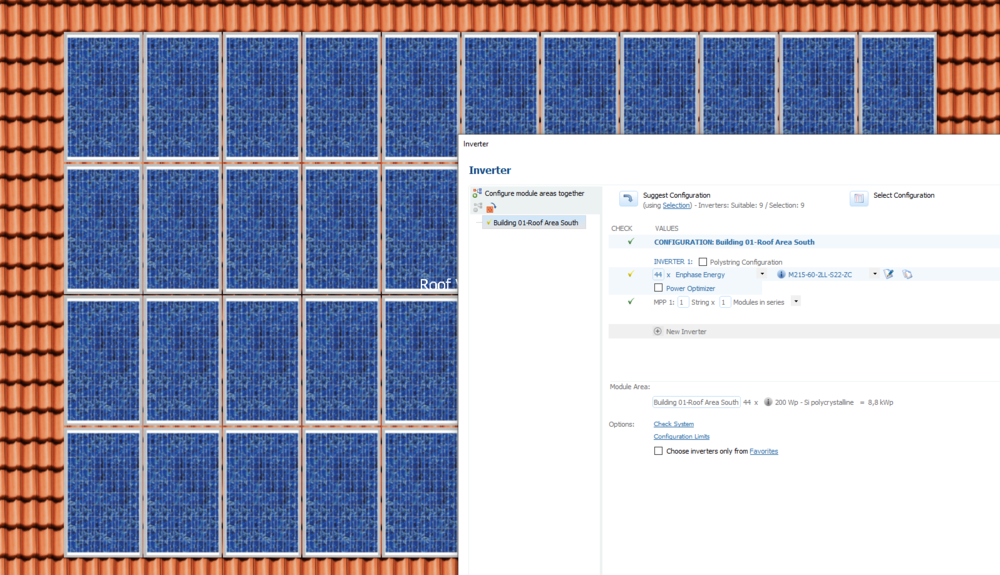
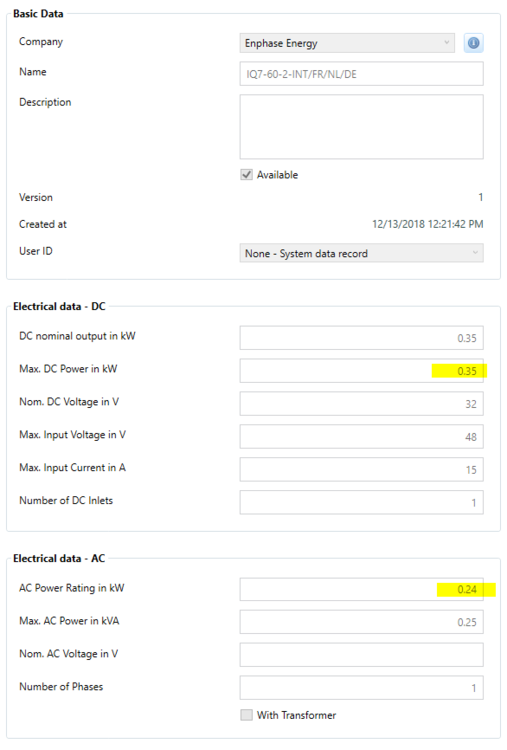
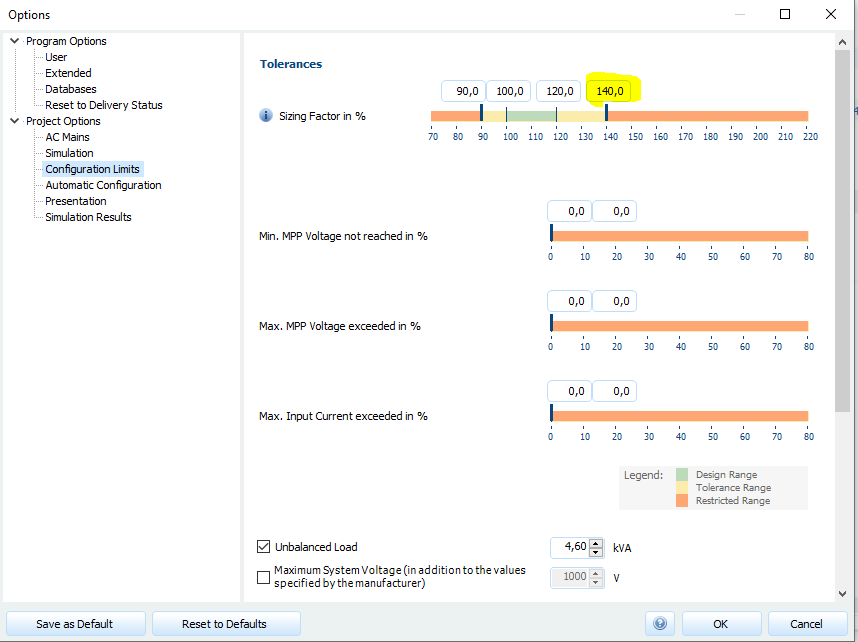
Hi Remu, you can use the Enphase inverters in the automatic or manual configuration like any other inverter as well. Here in my example I have 44 modules on the roof, so I use 44 Enphase inverters: You can also select all Enphase inverters using the link under "Suggest Configuration", and let PV*SOL search for a valid configuration by clicking on the arrow. Regarding the DC and AC power values of the Enphase IQ7-60. Its values are correct in the database: You will have to allow for sizing factors (DC power / AC power) of above 140%. You can do so by clicking on "Configuration Limits" and then set the upper limit to 150 for example: Hope that helps, kind regards, Martin
-
Hi Remu, thank you for reporting this error. I will forward it to our database team at database@valentin-software.com. If you find any errors concerning the database entries in the future, you can also report it to them directly. Kind regards, Martin
- 1 reply
-
- 1
-

-
Dear Luis, it seems that there are problems with your graphics card. "Fehler im DirectX-Device" (Error in the DirectX device) indicates that your graphic card has produced has error when executing DirectX functionality. "Fehler beim Zeichnen des Objekts" (Error when drawing the object) is a consecutive error, I'd say. Please check if you have installed the latest drivers for your graphic card. Also try to run dxdiag, please. Hit the "Windows" key, type "dxdiag", wait for the loading bar to finish and the click "Save All Information". You can send the file via private message. Hope that helps, kind regards, Martin
-
Hi Remu, can you elaborate where your difficulties are? Kind regards, Martin
-
Dear Remu, sorry for the late answer. I wrote that feature request down, thank you. Kind regards, Martin
-
Hi Luis, from your screenshot it is difficult to identify the problem. Could you describe a little what is going on? And also, please provide the log file "PVSOLpremium.log" that you can find at C:\ProgramData\Valentin EnergieSoftware\log Thanks in advance, Martin
-
Hi Infinitech, no, it is really like this: The difference is, that it takes into account the height of the sun and its "power". If a shadow occurs at lower sun angles (morning or evening, or winter time), it has less impact on the overall percentage. If a shadow occurs at higher sun angles (noon, summer) it has high impact. Hope that clarifies the matter a bit further, kind regards, Martin
-
Dear Stuart, thank you for your feedback. We are having a lot of customer feedback about the GUI at the moment, and we are working on a solution. It seems that recent updates of Mircosoft Windows, as well as the .NET framework and additionally the handling of the dpi scaling changed. So it would be very helpful if you could provide a screenshot of the pages with the issues you mentioned, and - if possible - some information about your display settings. Thanks a lot in advance, kind regards, Martin
-
Hi Ragy, did you re-simulate the project with zero tilt? If the simulation results are not valid for the current system data, they are not shown. Kind regards, Martin ps: Glad to see that apparently your installation succeeded
-
Hi Ragy, this error is unknown to me, but it looks like a system issue to me. "msxml3.dll" is a system library located in C:\Windows\System32\. Can you see it in your system? Also be sure that no other process is accessing the PVSOL.ini file here: "C:\Users\USERNAME\Documents\Valentin EnergieSoftware\PVSOL premium 2020\PVSOL.ini" or, if you install PV*SOL premium 2020 for the first time, check this file: "C:\Users\USERNAME\Documents\Valentin EnergieSoftware\PVSOL premium 2019\PVSOL.ini" Hope that helps to identify the problem. Kind regards, Martin
-

generator energy Wrong amount of PV Generator Energy (AC grid)
developer_mh replied to Marcin's topic in PV*SOL
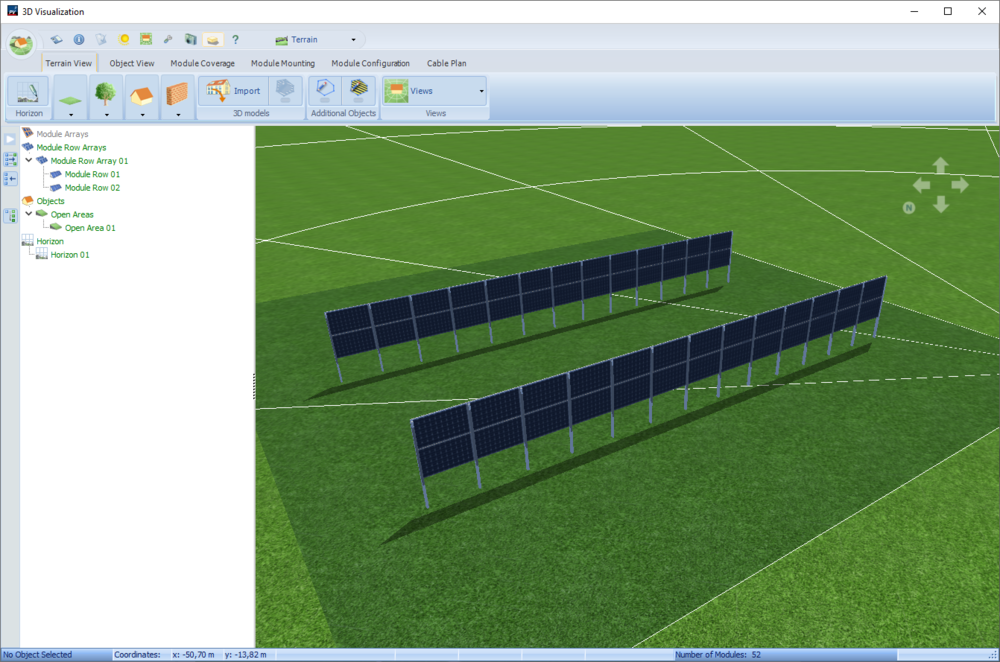
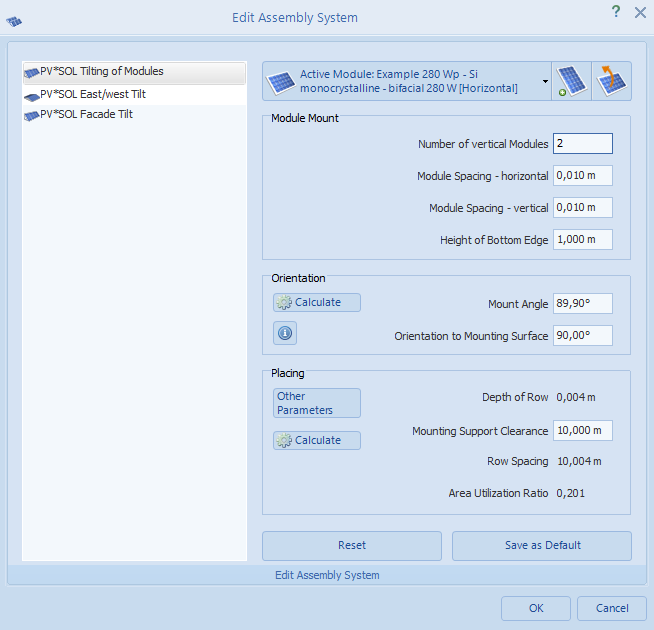
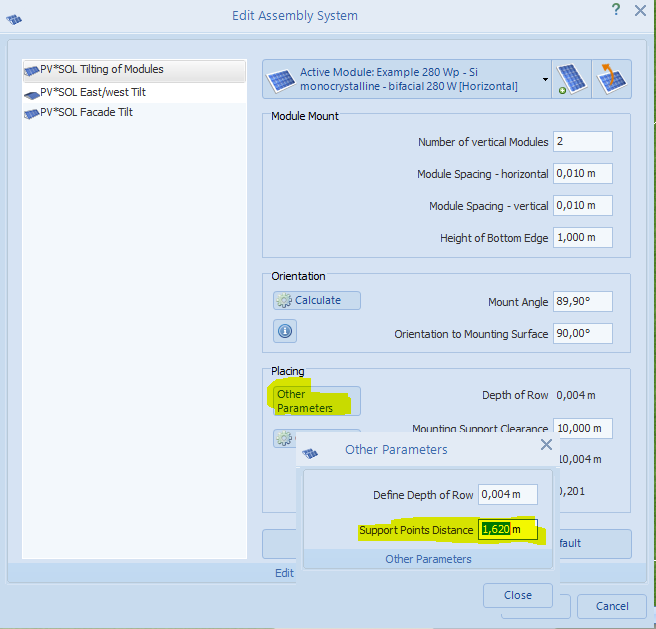
Hi Marcin, from what I see on the picture there and also on their website (https://www.next2sun.de), there are only two bifacial modules per section, one on the top and one below. I think we can see it very clearly here on this picture: This system can be easily modelled in 3D right now, with the help of mounting system type 1: And, in order to get the vertical posts in the correct place, set the Support Points Distance to a value a bit smaller than the longer side of the PV modules. Hope that helps, kind regards, Martin -

generator energy Wrong amount of PV Generator Energy (AC grid)
developer_mh replied to Marcin's topic in PV*SOL
Hi Marcin, I am not sure if I understand correctly.. Do you mean, you have a vertical structure with two bifacial modules, one to each side? So that their backsides touch? Kind regards, Martin -

generator energy Wrong amount of PV Generator Energy (AC grid)
developer_mh replied to Marcin's topic in PV*SOL
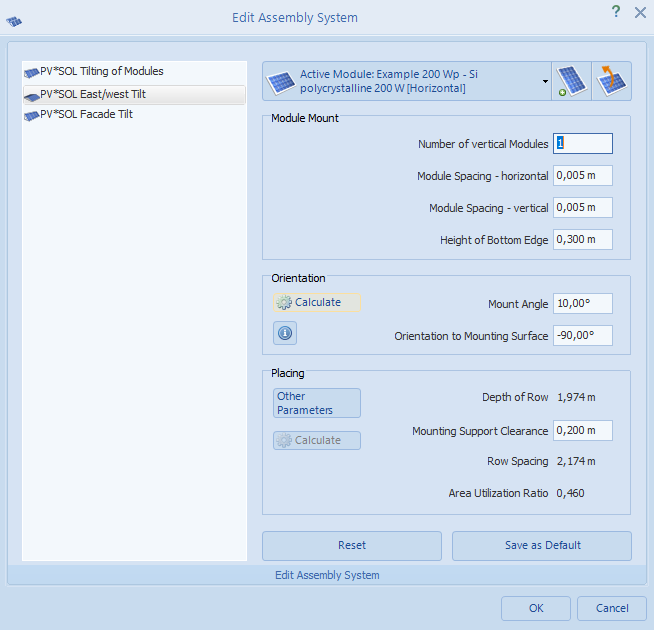
Hi Marcin, in the 3D environment of PV*SOL, we decided not to calculate bifacial gains if we have east/west mounting structures like in your pictures on the left. We assume that there is no irradiance hitting the backside of the module, since the triangular space below the modules will be dark. Also for facade structures, we decided not to calculate bifacial gains, since we considered them to be usually parallel to a vertical wall. But we just discussed it here and we will modify that in the future. Mounting structures of type 1 ("Tilting of modules") and type 3 ("Facade tilt") will calculated with the view factor bifacial model for inclination angles between 10° and 80°, and with the "vertical" model for angles between 80° and 90°. If the inclination angle is below 10°, no irradiation gains will be calculated. But for now, if you want to calculate with vertical modules oriented towards East/west, just use the mounting structure type 1. Kind regards, Martin -

Photo Plan Massverhältnis First/Traufe zu Dachbreite
developer_mh replied to Hampi's topic in PV*SOL
Hallo Hampi, entschuldige die späte Antwort, dein Post ist irgendwie untergegangen. Solche Luftbildaufnahmen sind generell schwierig in Photoplan umzusetzen, da man so gut wie keine Möglichkeit hat, vertikale Orientierungslinien einzuzeichnen. Photonplan ist gut für von vorne aufgenommene Bilder. Das Bild hier wäre eher ein Fall für den Kartenimport in 3D. Hast du das mal versucht? Vielleicht kommst du da zügiger zum Ergebnis. Beste Grüße, Martin -
Hi Jacek, another thing you could try then would be to manipulate you ini file. Close PV*SOL, and locate this file here: C:\Users\USERNAME\Documents\Valentin EnergieSoftware\PVSOL premium 2020\PVSOL.ini Open this file in a text editor (notepad++ is a good one ) and locate the line (near the end of the file) <MainPagerWider>0</MainPagerWider> Replace it with <MainPagerWider>-1</MainPagerWider> save the file, and start PV*SOL again. For some customers, this works, so I hope this works for you as well.. Kind regards, Martin
-
Hi Jacek, you could try out the measures explained in this post here: Let me know if that helped. Kind regards, Martin
-
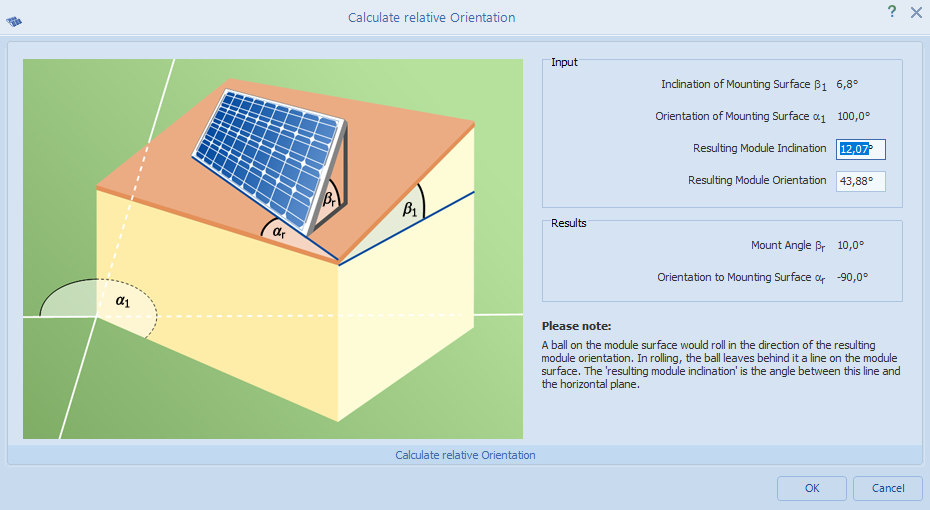
Hi Daniel, it looks like your roof has a ridge that is not exactly in North-South direction, is that correct? In that case, if you have a small inclination of the roof surface and you mount a PV system with its own orientation and tilt, the resulting orientation and tilt (or inclination) will be different. For that reason there is also a small dialog in the mounting system dialog that explains this a bit: Click on Orientation -> Calculate Hope that helps, kind regards, Martin


