developer_mh
-
Posts
1,855 -
Joined
-
Last visited
-
Days Won
173
Everything posted by developer_mh
-
Hallo Ralf, die Kosten können auf der Wirtschaftlichkeitsseite unter "Bearbeiten" eingetragen werden. https://help.valentin-software.com/pvsol/2020/navigationsseiten/wirtschaftlichkeit/ Viele Grüße, Martin
-
Hi Joao, thank you for notifying us of that issue. I will put it on our bug list. Could you provide the sample project, please? If you want, you can send it via private message here in the forum. Kind regards, Martin
-
Hi Joao, please see this thread for an answer to your question: In short: At the moment, you can only plan the cables either in 3D or on the cabling page of non-3D-side of PV*SOL (the one you shared screenshots of). If you plan the cables in 3D, their specific values can't be adopted into the cabling page, only the total loss, as stated in the thread above. We have this feature on our list, but at the moment we can't give a date for its release. Kind regards, Martin
- 3 replies
-
- 1
-

-
- cable plan
- adopt data
- (and 1 more)
-

Spezifischer Jahresertrag DC / AC -gekoppeltes Speichersystem
developer_mh replied to Anton's topic in PV*SOL
Keine Ursache, und vielen Dank fürs Kompliment -
Spezifischer Jahresertrag DC / AC -gekoppeltes Speichersystem
developer_mh replied to Anton's topic in PV*SOL
Hallo Anton, ja, da gibt es einen technischen Hintergrund. Bei DC-Systemen wird der Batteriespeicher ja DC-seitig an die PV-Anlage gekoppelt. Die Performance Ratio bezieht sich auf die AC-Ausgangsleistung des PV-Wechselrichters. Das bedeutet, dass die Batterie-Verluste und evtl die DC/DC-Wandlerverluste des Ladereglers die AC-Ausgangsleistung desPV-Systems verringern. Und das führt zu den niedrigeren PR-Werten. Uns ist bewusst, dass dies ein etwas unglücklicher Zustand ist, da die PR bisher dazu verwendet wurde, um eine Vergleichbarkeit der PV-System-Güte zu haben. Mit Batterie-Systemen, vor allem DC-gekoppelten, ist diese Vergleichbarkeit nun nicht mehr gegebenen. Wir haben aber auch schon Ideen, wie wir das in Zukunft besser darstellen, bzw. in den Ergebnissen kommunizieren können. Beste Grüße, Martin -
Hi Dominik, the upper diagram is shown when you select Net-Metering as tarif model, on the economy page. The diagram at the bottom is shown when you select "Surplus Feed-In" (Überschusseinspeisung). Hope that helps, kind regards, Martin
-
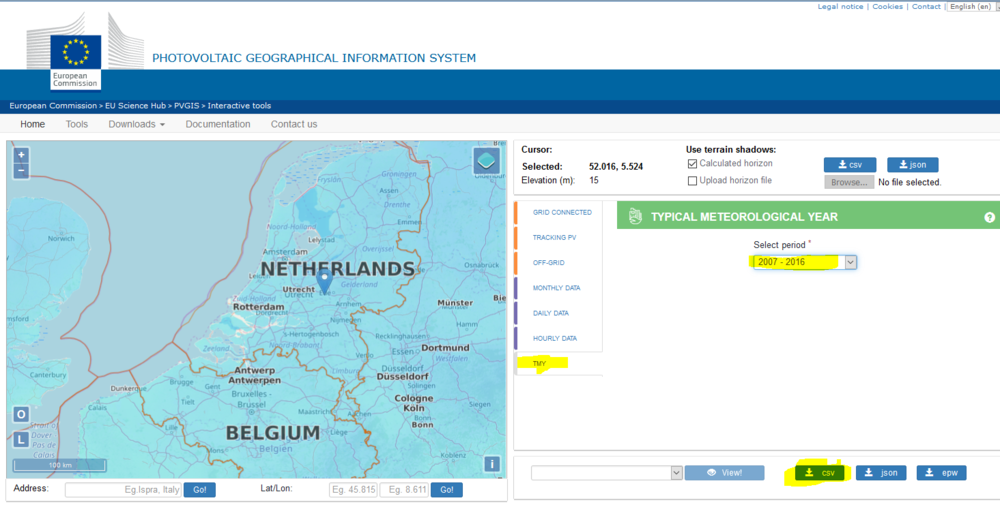
Dear Remu, yes, you can import climate or weather data into PV*SOL via its meteo module Meteosyn (which integrates Meteonorm). See the data format description here: https://help.valentin-software.com/pvsol/2020/pages/system-type-climate-and-grid/meteosyn/#options The reason why climate data from 1991 - 2010 is used in Meteonorm is that 1) you always want to use long-term climate data to realistically represent the location's weather "behaviour" over a long period of time, not just e.g. the last five years and 2) at the moment there is no climate data with a more recent period of time in Meteonorm 7.2. For some countries, there is data from 1996-2015, but not for the Netherlands. See also the difference between weather and climate data, and TMY here: https://help.valentin-software.com/pvsol/2020/calculation/irradiation/climate-data/#what-are-climate-data-sets-what-does-typical-mean-year-mean In PVGIS, you get satellite derived climate data in good quality for 10 years time periods (not as secure as 20 years, but ok), also for the Netherlands. This is what I would recommend to you at the moment, as long as Meteonorm has no more recent data. But also keep in mind, that for PV simulation and the reliability of the simulation results, more recent doesn't forcibly mean better. All the best, kind regards, Martin
-
Hi Joao, just a short feedback: I can reproduce the problem with your projects, and I haven't found the reason for this behaviour yet, but what I can say so far is that it doesn't affect the simulation results. And there is also a way to make it visible in the project report again. Load your project, go to results page, see in the energy balance "PV energy (AC) minus standby use", it is 128738,39 kWh Go to presentation page, create the report -> your horizon is not visible Go to 3D environment, Terrain View, right click on Horizon, open and close it with OK, and say OK to the warning "This action deletes the results of the shading simulation". Go back to PV*SOL, let the shadowing simulation run again Go to results page again, see in the energy balance "PV energy (AC) minus standby use", it is still 128738,39 kWh Go to presentation page, create the report -> your horizon is visible now We will look into the reason why the horizon lines disappears in step 1 and 2, but this will be next week. We are sorry for the inconvenience this may cause. Kind regards, Martin
-
Hi Joao, I just verified again that in our test environments the 3D horizon function works as expected. Could you please provide an examplary project where this error occurs? You send it via private message here. Please be aware that it might take us a while to reproduce the issue. Most likely we won't be able to provide an answer before Monday. Kind regards, Martin
-
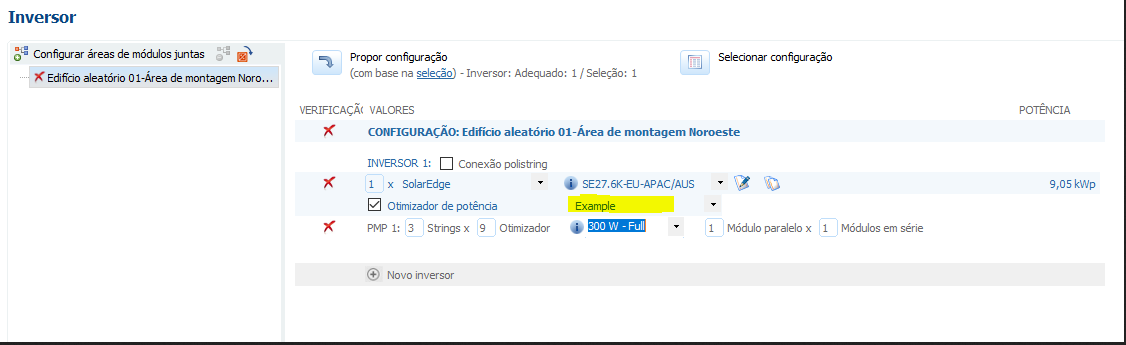
Dear Luís, did you try to select SolarEdge as company in the list above the model selection? Kind regards, Martin

-
?
-
Hi Joao, yes, this is normal. Only Bugfix/Smaller releases inside one major family replace the preceding installation. For example PV*SOL premium 2020 R4 will replace 2020 R3, but 2020 R1 will not replace 2019 R14 or any other version before it. This is intended behaviour, as some customers still want to use their old version for a while, and only switch slowly step by step. If you don't want 2019 on your machine, it is safe to uninstall it. Kind regards, Martin
-
Dear Vishnu, the current rating for the circuit breakers is determined as follows: Determine the maximum AC current of the connected inverters (taking into account the maximum AC output power, the grid voltage and the number of phases) Apply safety factor of 1.1 Choose the smallest current rating that is bigger than this current from the list: 6, 10, 13, 16, 20, 25, 32, 40, 50, 63, 80, 100, 125 A The characteristic is always B, except for inverters with transformator (K) oder with ENS (C) Hope that helps, kind regards, Martin
-
Hi electricalchild, if all goes well, you should see PV*SOL premium 2020 R1 starting from tomorrow until the end of the week. Maybe next week, it always depends on how well the tests go. Please understand that we can't give exact dates. Kind regards, Martin
-
Dear Remu, there are a whole lot of reasons why simulation results differ between PVGIS and PV*SOL. 1. The climate data used is different. Most of all the irradiation data, which has the strongest influence on the results. The standard in PV*SOL are climate data from Meteonorm, while PVGIS uses its own compiled climate data. See these forum threads here: 2. The simulation models (and even the simulation approaches) are completely different. We follow a time-step based approach (in one-hour or one-minute intervals) that is simulating very accurately the irradiation on module, their temperature, shadows and so on, the electrical generation inside the PV module (with the two-diodes model), the interconnection of various modules and the superposition of their IV characteristics, the inverter behaviour, grid behaviour and what not. PVGIS is following a factor based approach, as you can read in their documentation. In the example you posted here, they just apply a loss factor of 15% to the results and that's it. I'd say, PVGIS is more a tool for a first good guess of the energy yield of a PV system. They do a really good job in integrating meteorological data from various sources, and the web interface is superb. You can click very easily on every point in Europe and see how much a average PV system would generate. PV*SOL is more a tool for designing and simulating PV systems that you are really going to build in real life. You can select real world PV modules, inverters, choose and modify their configuration and so on. You can't really compare the tools, as the scope and the input data used are so different. If you want to dig deeper in our simulation models, have a look here: https://help.valentin-software.com/pvsol/2020/calculation/ Here is also a link to the documentation of PVGIS: https://ec.europa.eu/jrc/en/PVGIS/docs/methods Hope that helps, Martin
-
Hi Joao, thank you for reporting this bug, it is already fixed in the next major release. Unfortunately the zoom level isn't something we can easily control as it is an integer value that is given to the various map APIs. There are no values possible between e.g. zoom level 16 and 17. At least not with the tool that we use to access the APIs at the moment. Hope that helps, kind regards, Martin
-
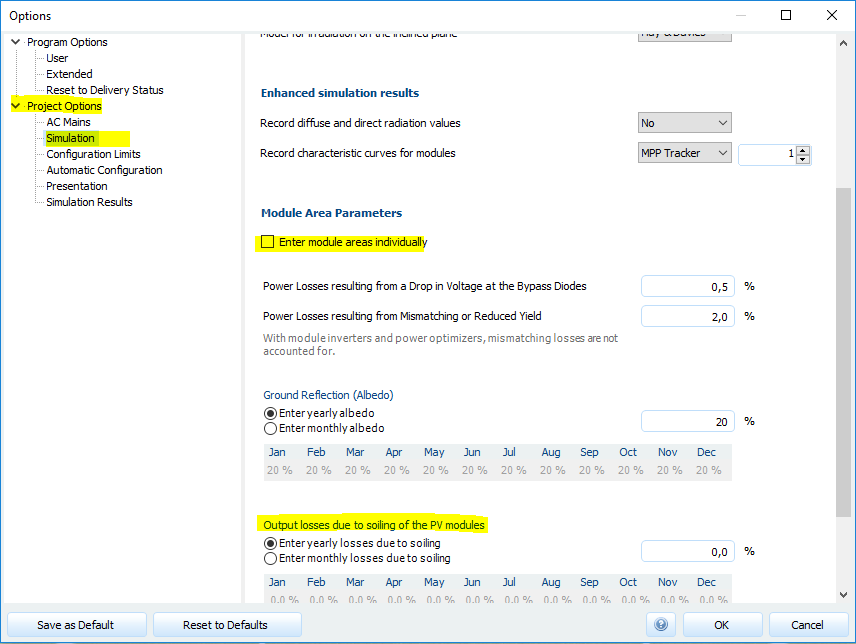
Hi Kenn, as Vishnu already mentioned, there are yearly or monthly soiling values that you can edit. Either you do this for all module areas at once, or you can edit these values per module area, if you enable the checkbox "Enter module areas individually". Hope that helps, kind regards, Martin @Vishnu: Thanks a lot for answering this question!
-
Dear Joao, thank you for your feedback. I was not saying that I do not know what multitasking is, and I also do not need reprehension from your side. I was just saying that you already found a work-around to a problem that probably won't be fixed in the next releases. There are a lot of feature requests from customers, and yours will be handled with the same priority as all the others. We prioritize the features and bugs according to our rating system and plan the releases accordingly. Since we have a non-infinite amount of team members, we can't take care of all items. I am sure that this is understandable. If you don't like the software, you are free to give it back and your money will be refunded. We do our best to develop a software that helps people to design PV plants. If it doesn't meet your expectations in this intensity, I guess you will be better off giving it back. Kind regards, Martin
-
Dear Joao, when the 3D visualisation is open, the DirectX component is used to render the scene constantly. This causes the CPU and GPU load. If you want to avoid PV*SOL using the CPU and GPU while being idle, just close the 3D environment, as you already found out. Kind regards, Martin
-
Dear Luís, I would recommend to you to contact our sales team at sales@valentin-software.com. They can give you the most suitable information to those questions. Thanks and kind regards, Martin
-
Dear Flavio, thank you for your log file. Unfortunately it doesn't contain any information related to your problem, so I guess the error occurs outside of PV*SOL. Do you have a firewall, that blocks certain URLs from being loaded, perhaps? Could you check if you can reach these URLs, please? https://www.openstreetmap.org http://www.bing.com/maps http://maps.google.com Also note that bing and google use the http protocol, not https, so perhaps this might be the reason. Perhaps your network is blocking http (without s) requests? Kind regards, Martin
-
I hope not, since PV*SOL doesn't require administrator rights.
-
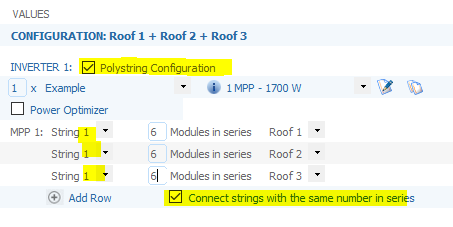
Dear Remu, yes, if you click "Add Row" below your first string, you can add a row for each module area (for each roof). Then select "Connect strings in series". Then all rows with the same string number will be connected into one electrical string. Hope that helps, kind regards, Martin
- 1 reply
-
- 1
-

-
Dear Flavio, could you send us your log files, please? You can find them under C:\ProgramData\Valentin EnergieSoftware\log Please send the file named "PVSOLpremium.log" via private message here in the forum, perhaps we can see something there. Kind regards, Martin
-
Trina Tallmax TSM-DE15M(II) 400W and Jinko Cheetah HC JKM340M-60H-V
developer_mh replied to Daniel's topic in PV*SOL
side note: we recently overhauled our whole database eco system, and as a side effect we now have a website where you can see the current state of our database and what modules are available: https://pvsol-database.valentin-software.com/ Current list of Jinko modules for example: https://pvsol-database.valentin-software.com/Products?productType=PvModules&areUnavailableProductsVisible=False&selectedCompany=f13d5c09-e3c6-4980-8593-f748363117d0 These new databases will be connected to PV*SOL from the next major version on. Kind regards, Martin