-
Posts
1,316 -
Joined
-
Last visited
-
Days Won
83
Everything posted by developer_fw
-
Hallo mlo, nein. Aber der Plan lässt sich als SVG exportieren und mit https://inkscape.org/ bearbeiten. Viele Grüße, Frederik
- 1 reply
-
- 1
-

-

PV*Sol - Irradiation and atmospheric Database sources
developer_fw replied to Javier Otálora's topic in PV*SOL
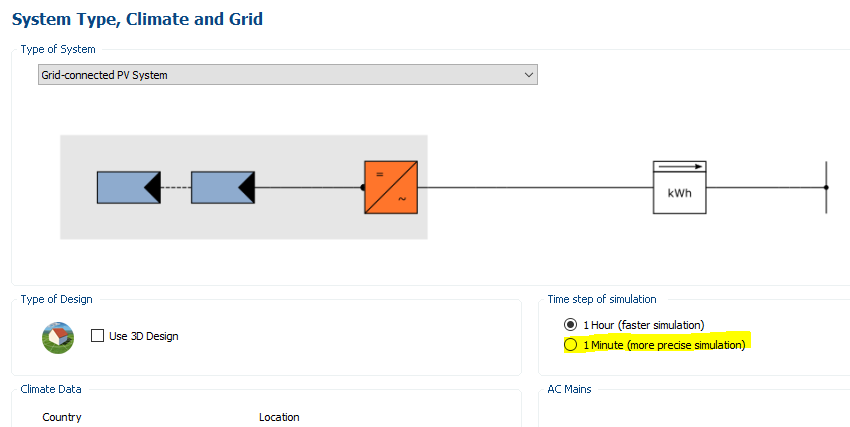
Hi LynetteOC, sorry for the belated response. This is correct, the irradiation is assumed to be constant throughout the hour. This again illustrates the importance of simulations with minute values instead of using hourly values. Those minutely data can be synthesized for every location: https://help.valentin-software.com/pvsol/2021/en/calculation/irradiation/synthesis-of-minute-values/ Best regards, Frederik -

Auswahl Wechselrichter, unabhängig von Einstrahlung/Dachneigung?
developer_fw replied to Wolfgam's topic in PV*SOL
Hallo Wolfgam, das ist korrekt, der Vorschlag eines Wechselrichters wird anhand der installierten Leistung getroffen, da keine Vorsimulation statt findet. Diese Idee gibt es schon länger bei uns, deswegen habe ich sie nochmal im Team angesprochen und als Feature für die Verschaltung auf die Liste gesetzt. Beste Grüße, Frederik -
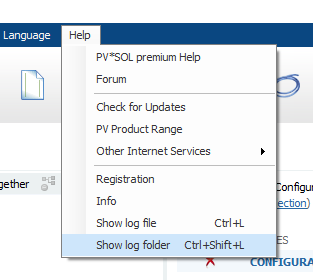
Hi Frido, could you send the MeteoSyn Logfile via private message here in the forum? You can open the logfile folder via There should be files for MeteoSyn and pvsolpremium. Thank you in advance and best regards, Frederik
-
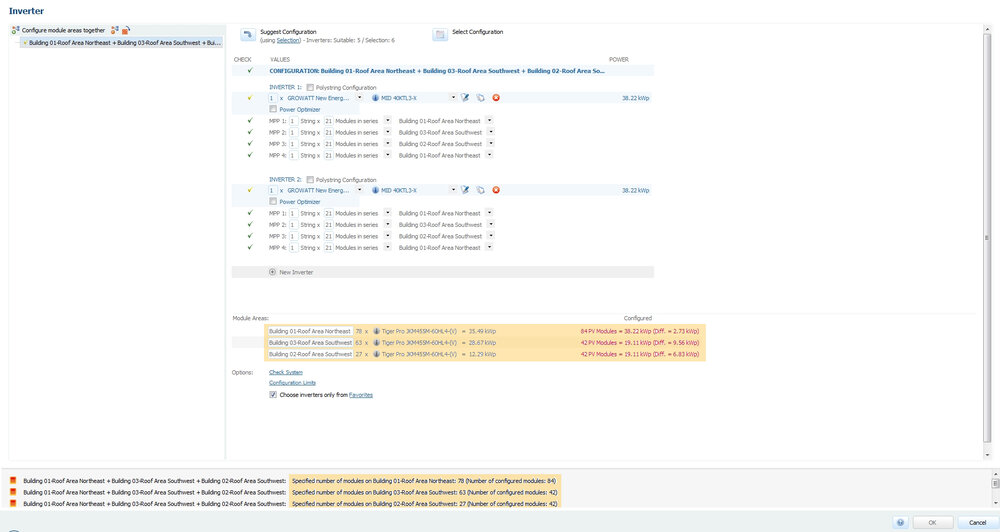
Hi Tazar, welcome to the forum! I added the picture behind your link to your post, I hope you don't mind. PV*SOL assists you with the configuration. In the bottom of the program window you can see the warnings or info regarding your project. Some of them restrict a simulation, some of them just inform you and a simulation is possible anyway. You could read more about that and the program in our online help: https://help.valentin-software.com/pvsol/2021/en/pages/#notifications-pvsol I marked the relevant information: You have to configure all the modules, otherwise PV*SOL does not start a simulation. For example for the Roof Area Northeast 84 modules are configures, but only 78 exist. You have to adapt your configuration above until those targets are fulfilled. I hope this helps! If you have further questions regarding the configuration, don't hesitate to ask! Best regards, Frederik
-
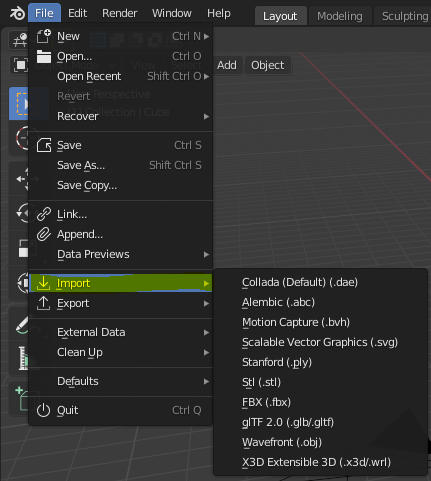
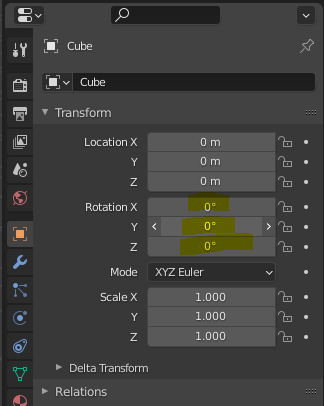
Hi GIM, PV*SOL uses a different coordinate system orientation than Google SketchUp. You could rotate your model before the import using https://www.blender.org/ for example. After importing and selecting your model, you are able to rotate it via the menu on the right side: I hope this helps. Best regards, Frederik
-
Hello Faruk, this is correct, the enrolment certificate should be the usual document by your university or other institution which ensures authorities or companies like us that you are an enrolled student. Yes, a picture/scan with all needed information (Name, Surname, major studies, period of semester, university and so on) will do fine. You could send this with your buying request directly at sales@valentin-software.com for further processing. Best regards, Frederik
-
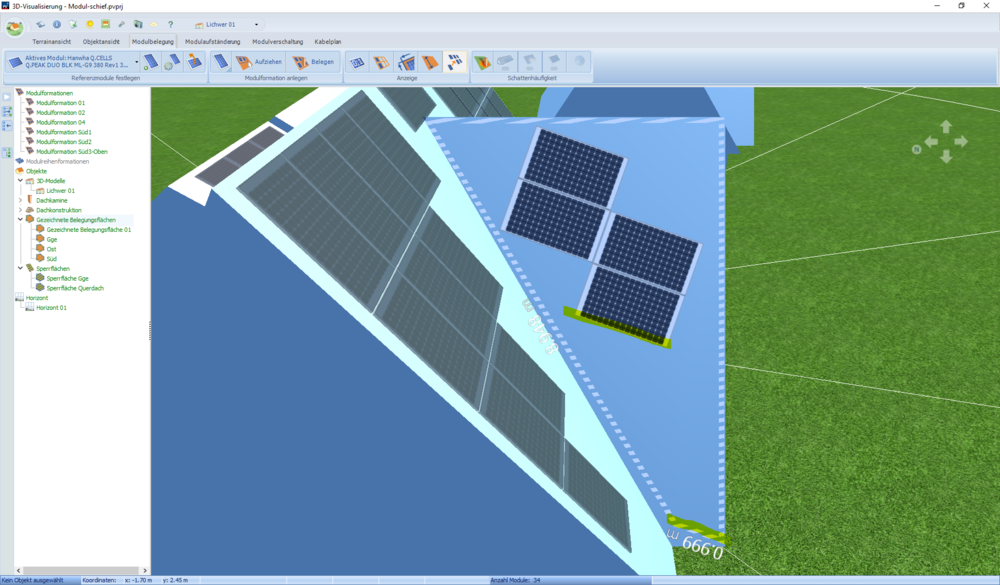
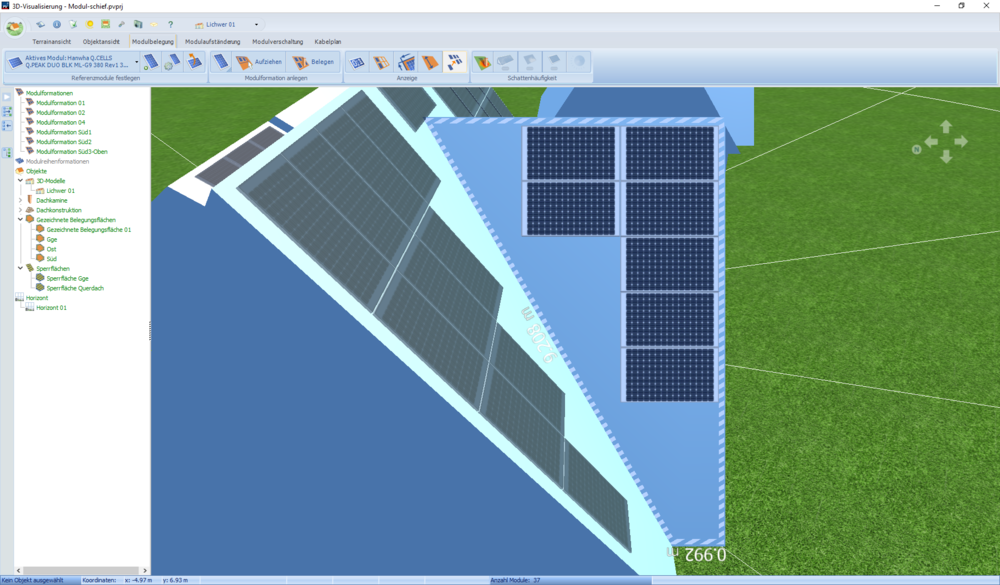
Hi Wolfgam, Sie machen nichts falsch. Ihnen fehlt vermutlich nur die Information, dass PV*SOL die Module parallel zur unteren Kante der Belegungsfläche ausrichtet. Bei solch kurzen unteren Gaubenkanten müssen Sie ein, zwei Mal belegen und nacharbeiten, bis das Ergebnis optisch passt. Kleine Änderungen an den Horizontalen wirken sich stark auf die langen vertikalen Achsen aus. Zur Veranschaulichung habe ich hier ein bisschen übertrieben: Nach ein bisschen Feinarbeit lassen sich passable Ergebnisse erzielen: Viele Grüße! Frederik
-
Hallo PeterZ, das ist leider nicht möglich. Viele Grüße, Frederik
-
Hi Julius, I talked to our Sales team. You bought the license from our partner The Solar Design Company, which you should try to contact first. Your maintenance has expired, which means the latest version you can use is the last one which has been released while your maintenance was still active. For example if your maintenance ended at 11-30-2020, the last version you have a license for, is 2021 R2. If you still have questions, feel free to ask. Best regards, Frederik
-
Hi burale83, mit PhotoPlan geht das leider nicht. Aber ein Workaround, der 5 Minuten dauert funktioniert mit GIMP, einem Open Source Rasterbildbearbeitungsprogramm https://www.gimp.org/ Bild öffnen "Lasso"-Tool benutzen, um die PV-Modulfläche zu selektieren (die Eckpunkte reichen) Unter Colors > Saturation die Sättigung der selektierten Fläche auf 0.0 setzen. Per Export kann das Bild dann erneut gespeichert werden. Hi Beste Grüße, Frederik
-
Hi Julius, they replied that they have already been in contact and solved the problem yesterday. Best regards, Frederik
-
Hi SolarStevo, another way to go: So far PV*SOL does not support forecast-based controlled consumers, but you could mimic them by using the exported simulation results to create your load profile. https://help.valentin-software.com/pvsol/2021/en/pages/presentation/#simulation-results Best regards, Frederik
-
Hi Julius, I forwarded your request to our sales team. Best regards, Frederik
-
Hallo RPK, die Abregelung bezieht sich auf die installierte DC-Leistung, also auch in diesem Fall auf die 44 kWp. Viele Grüße, Frederik
-
Hi robin, at the moment this functionality is missing for tracking, since there are no geometrical time-dependent informations about the modules tracked. The interesting situations appear while sunrise and sunset. According to your low inclination angle of 17° I assume you are planning more equator-nearish, so the self shadow losses of the columns that might appear should be minimal (fast change of sun elevation). Is that correct? I'm afraid you should estimate this geometrically outside of PV*SOL. Best regards, Frederik
-

Lebensdauer von Batteriespeichern und deren Wirtschaftlichkeit in PV*SOL
developer_fw replied to Stefan's topic in PV*SOL
Hallo Stefan, die Zyklenbelastung der Batterie lässt sich einsehen, aber ja, leider nur für ein Jahr. Diese Zyklenbelastung wird linear skaliert. 100% Zyklenbelastung entspricht 80% maximale Restkapazität, woraus sich die Jahre ergeben, nach denen rein rechnerisch eine Batterie ersetzt werden müsste. Viele Grüße, Frederik -
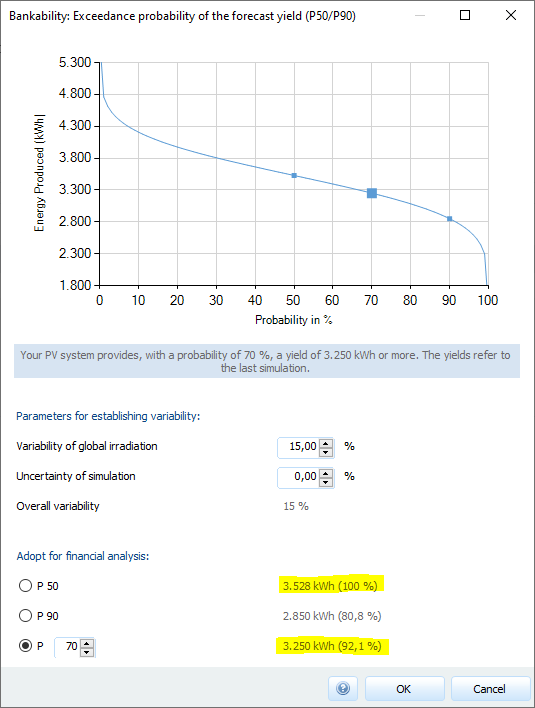
Hi pawel, the bankability is an exceedance probability for the energy yield. It is used as kind of a security measure for a finance provider like a bank. A bank is always interested in a high credit rating, i.e. in the case of large photovoltaic plants, in being sure that the debt will be repaid. Therefore this parameter does only make sense as a higher value than default. Higher P value means a higher probability for a lower but guaranteed (more probable) energy yield. You could of course set P to a lower value, but in our context as a planning tool it does not make sense to lower the default probability of the guaranteed yield. I hope my somewhat cumbersome explanation does make sense. After a simulation the bankability dialogue shows the yields. I also set a very high value for variability of global irradiation to show you the change of the curve. Unfortunately you have to reopen the dialogue for a change. I put this onto our bugfix list. Best regards, Frederik
-
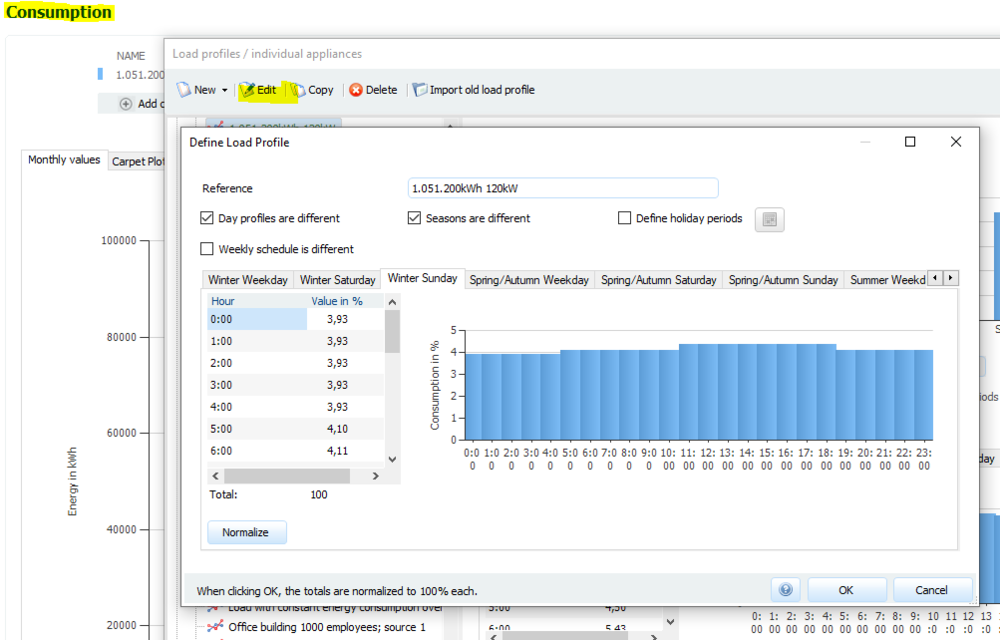
Hi Rohan, welcome to the forum and thanks for your request. You could calculate the energy amount by 120kW * 24h *365 = 1,051,200 kWh. With this energy amount you could create a load profile at the page consumption: If you have a lower average load and 120kW as peak load as you wrote (120kWp), then you might calculate with a lower value and set the values accordingly to reach a higher peak load. I hope this clarifies your question. If you have further questions, please feel free to ask. Best regards, Frederik
-
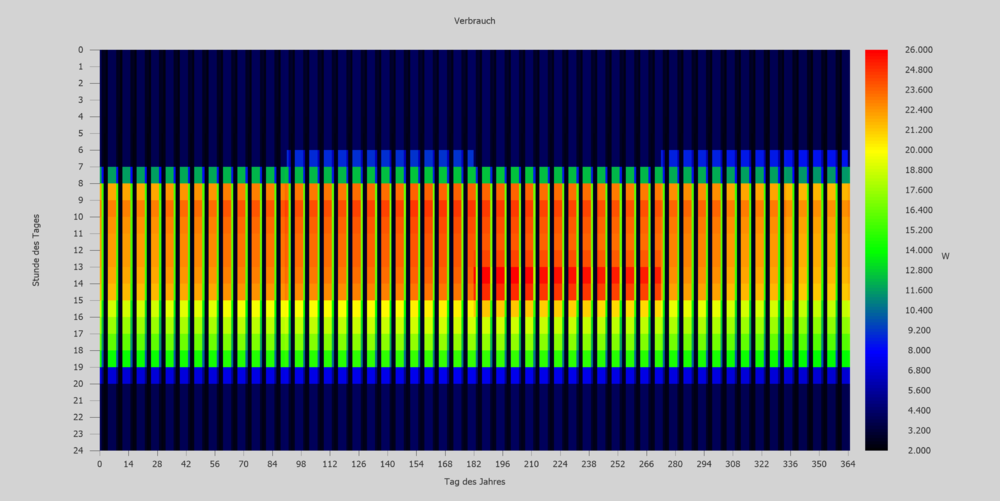
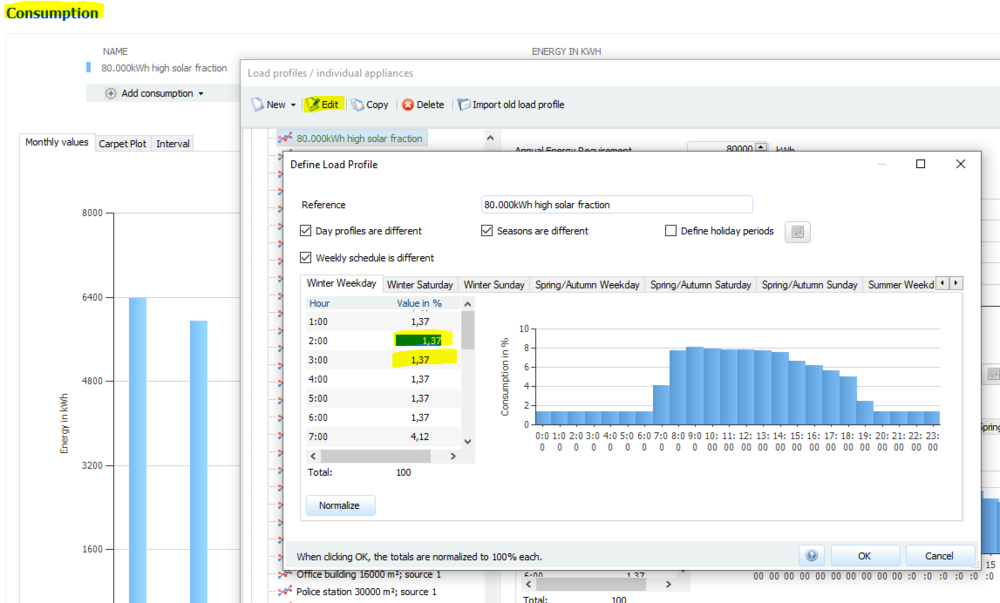
Hi SolarStevo, load profiles is a tough topic because of many unknowns. I just created a project with a custom load profile respecting a certain higher load from 8 am until 6 pm on workdays and a relatively low load for the weekend. In the summer at noon there is also a little higher load due to cooling. This resulted in a higher solar fraction since load and solar energy overlap more often. The solar fraction gets higher: Of course there is a limit, but I guess this clarifies the common question of getting a higher solar fraction. So did you manage to edit the profiles so far? This is possible on the page Consumption, after opening/adding a profile. A system data set can be edited after copying it. The input table is a bit cumbersome to use, but the overall concept of having different profiles for different days and so on pretty straightforward. I hope this helps! If you have further questions, don't hesitate to ask! Best regards, Frederik
-

Welche Grafikkarte als Empfehlung für PV-Sol Premium
developer_fw replied to Dexter's topic in PV*SOL
Hallo Dexter, ich denke die Hardware ist mehr als ausreichend. Ein Blick in die Historie: PV*SOL 3D ist in seinem derzeitigen Zustand sehr betagt. Viele programmiertechnische Designentscheidungen sind aus damaliger Sicht nicht für solch große Anlagen gefällt worden. Viele Dinge unter der Haube können nur schwer geändert werden bzw. wir sind an einem Punkt, an dem das jetzige 3D auslaufen wird. Der einzige Rat, den ich zur Zeit geben kann, ist die Projekte so gut es geht zu vereinfachen. Ich weiß, dass das keine befriedigende Antwort ist. So ist der derzeitige Stand. Wir arbeiten mit Hochdruck an einem zeitgemäßen 3D, welches mit vielen derzeitigen Limitierungen bricht. Auch sehr große Anlagen sollen dann kein Problem mehr sein. Eine Überbrückungsmaßnahme mit der nächsten Version 2022 wird sein: 3D wird in einen separaten Prozess ausgelagert, um Arbeitsspeicher besser nutzen zu können. Wir hoffen, dadurch noch ein bisschen Luft zu haben, bis das neue 3D fertig sein wird. Beste Grüße, Frederik -

Simulation of production CIS, CIGS vs. cSi modulen
developer_fw replied to Jan Mackovic's topic in PV*SOL
Hi Jan Mackovic, additionally to my answer as private message I want to point at the very bad low light performance of the CIS module. We allow manufacturers to put their low light data even in case the performance drops i.e. the values are probably wrong. You could use our PV*SOL model for CIS modules, which is way better than the manufacturers values but still a conservative value which usually slightly underestimates the real performance. For being able to adapt this you have to copy the module in the database dialogue. Best regards, Frederik


