-
Posts
1,316 -
Joined
-
Last visited
-
Days Won
83
Everything posted by developer_fw
-
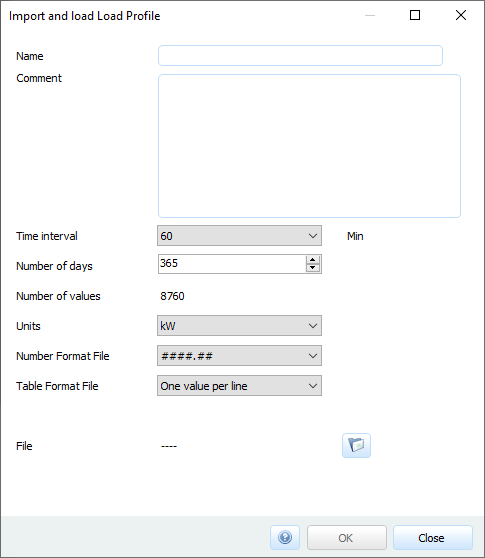
Hello Dominykas, 1. It depends on how your data looks like which you want to import. Depending on this, you choose the settings in the Import and load Load Profile window: Taking into account the chosen settings your file contains hourly values for 365 days. Those options define the number of values your file has to contain. These first fictional example lines show one value per line in kW, so 4.5kW in the first hour, 4.6kW in the next and so on. 2. You have to put the PVGIS irradiance data into a file, PV*SOL is able to import. There is an explanation in our online help: https://help.valentin-software.com/pvsol/2021/en/pages/system-type-climate-and-grid/meteosyn/#options If you don't have values for temperature, RH and FF for this specific location, you could create a new location using MeteoSyn, export the data and substitute the irradiance data with your PVGIS data. This might be a proper approximation. I hope this clarifies your issues. If you have further questions, please ask! Best regards, Frederik
-
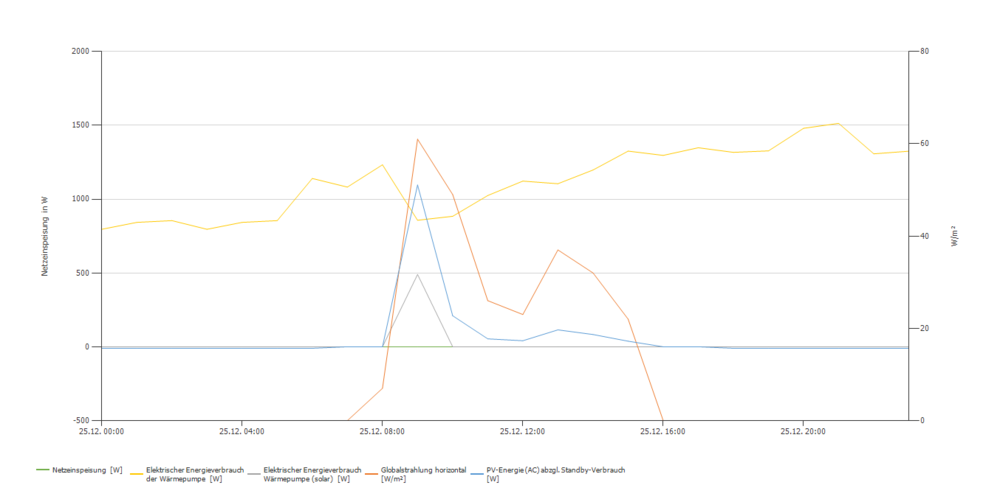
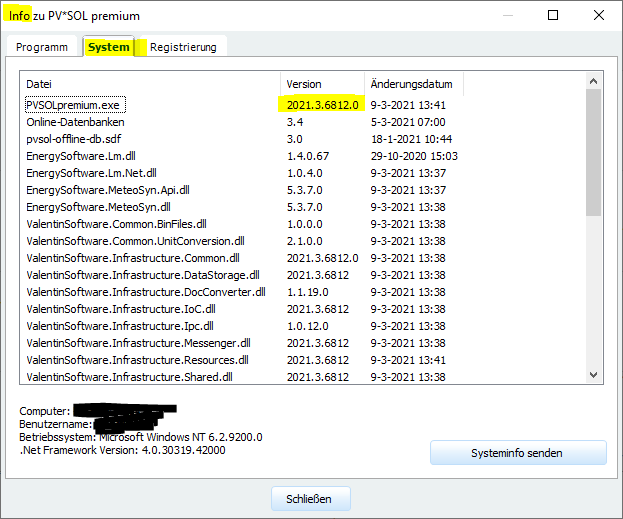
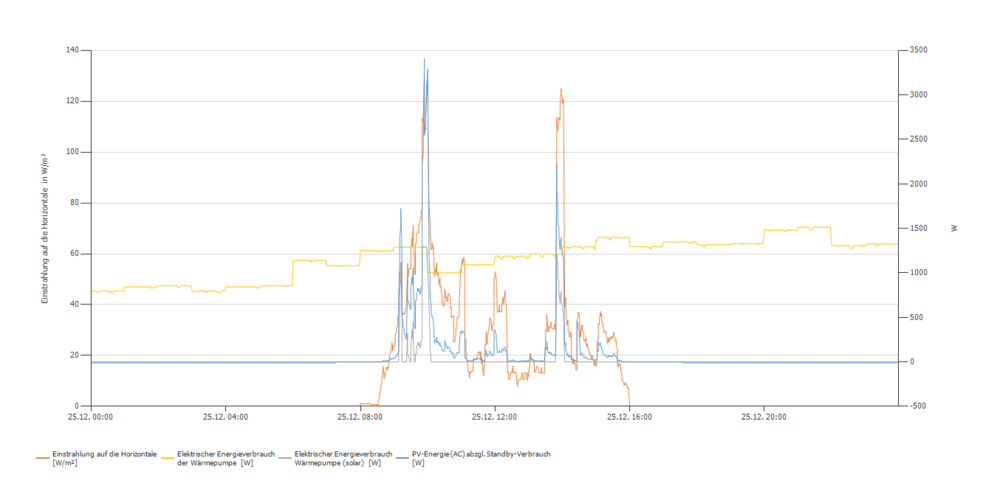
Hallo carpe diem, ich habe das Projekt geöffnet und simuliert. Bei mir sieht es am 25.12. folgendermaßen aus: Die Wärmepumpe läuft durch und nur um 9 Uhr wird ein Teil solar gedeckt. Zum Vergleich habe ich die Globalstrahlung mit eingeblendet. Minütlich: Welche Version von PV*SOL wurde genau verwendet? In der Menüleiste unter Hilfe > Info > System: Viele Grüße, Frederik
-
Hi Lucía Varela, the climate data in PV*SOL is limited to certain locations for which there are measured values over a longer period (speaking of years). Those years are stitched together forming a Typical Mean Year considering climate situations which are typical so to speak. For locations which are not in the database, our tool MeteoSyn can be used to create an interpolation between nearest locations where there are measured values in the database. This gives a good enough estimation in most cases. If you want to create a new location, you can follow the instructions in our online help: https://help.valentin-software.com/pvsol/2021/en/pages/system-type-climate-and-grid/meteosyn/#create-new-location This is a complex topic, so if you have further questions, we are happy to answer! Best regards, Frederik
- 1 reply
-
- climate data
- meteosyn
-
(and 1 more)
Tagged with:
-
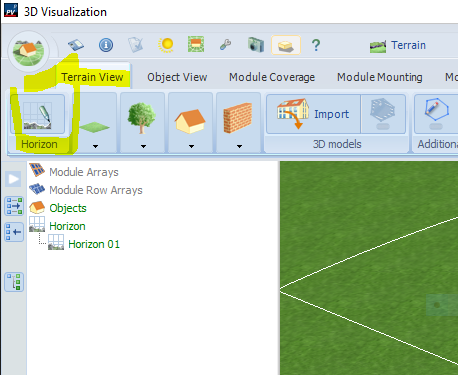
Hi Faruk, welcome to the Forum! Here you go: After opening the 3D design window, you are getting asked how you would like to start your planning. Choose Open Area for example. After that you should be in Terrain View, where you can set or import a horizon line: Best regards, Frederik
-
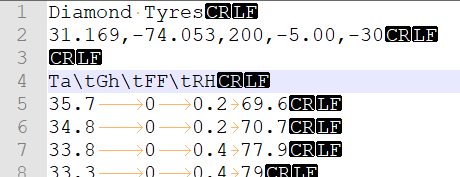
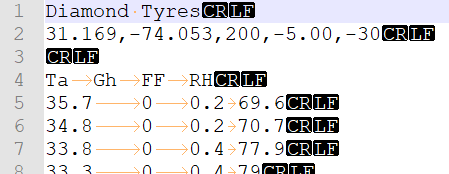
Hi Nasr, 1. In this case it is https://notepad-plus-plus.org/, a free editor which can show "hidden characters" like SPACE, TAB, NEWLINE and so on. View > Show Symbol > ... 2. TAB is a special character https://en.wikipedia.org/wiki/Tab_key#Tab_characters So in this case the \t is represented as string: and here as character: Best regards, Frederik Diamond_Tyres-hour_fixed.dat
-
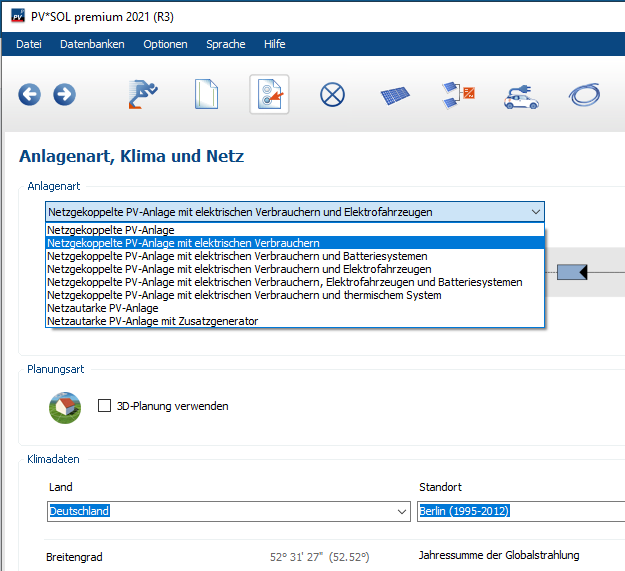
Hallo und willkommen Gerd, Die Anlagenart kann auf der Seite Anlagenart, Klima und Netz geändert werden: Mehr dazu findet sich auch in unserer Onlinehilfe: https://help.valentin-software.com/pvsol/2021/de/navigationsseiten/anlagenart-klima-und-netz/#anlagenart Ich hoffe, das hilft weiter. Viele Grüße, Frederik
-
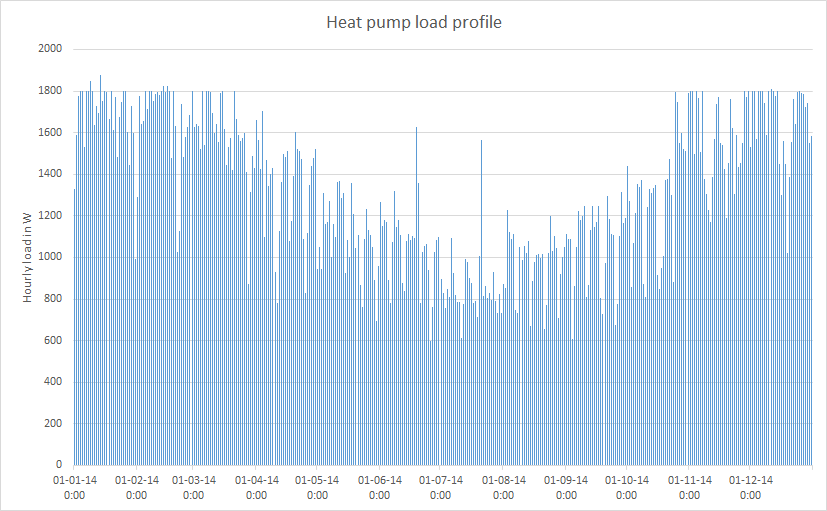
Hi Reint, could you specify which exact profile did you choose? From the total value of 3441kWh I assume you chose the profile Heat pump system with heating and domestic hot water. This is preset to 3441kWh. After exporting the values from the load profile and sum up the hourly values it results to that exact energy amount. The second image you provided seems to show the baseload for heating plus short peaks for hot water. What data did you use for your graphs? Could you provide a project file for further details? The example profiles provided where added since customers asked for example profiles. Those are bound to one specific climate location and should not be used within your own projects. I hope this helped to clarify some questions. Best regards, Frederik
-
Hi Ignacio, this is hard to tell without the project file. Is it possbile to send via private message in this forum? Best regards, Frederik
-
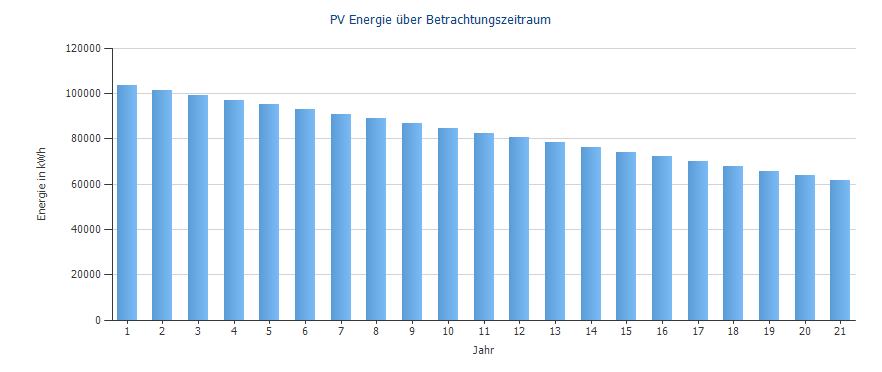
Hallo Ralf, alles klar, ich hatte es missverstanden. Die Moduldegradation wird nicht in der Ertragssimulation berücksichtigt, sondern nur in der Wirtschaftlichkeitsberechnung. Die Veränderung des zu erwartenden Ertrags wird im Diagramm PV Energie über Betrachtungszeitraum verdeutlicht. Die Entwicklung des Eigenverbrauchs und der Autarkie ist nicht im Programm enthalten. Viele Grüße, Frederik
-
Hallo Magdalena, eine Nachführung der Module kann derzeit in 3D nicht simuliert werden. Viele Grüße, Frederik
-
Hi FUSen, it is not possible to include the climate data into the simulation report at the moment, but I put this onto the list of feature requests. It is possible to export the simulation results as character separated values, though. This format has the advantage that it can be used more easily by other domains. The Albedo and soiling losses are also included. I hope this helps. Best regards, Frederik
-
Hi Reint, the heat pump profiles were simulated with GeoT*SOL https://valentin-software.com/en/products/geotsol/ Those are more or less example profiles since it is impossible to pinpoint a certain use case. In PV*SOL from version 2021 you can simulate an air heat pump as a new system type Thermal system. It uses the climate data from your actual location. We are planning to offer the possibility of creating your own heat pump or use existing heat pumps from our database. I hope this helps. Best regards, Frederik
-
Hello Alex11, yes, this is possible. Best regards, Frederik
-
Hi Sondre207, meanwhile I edited the answer including the 3D part.. have a look. Best regards, Frederik
-
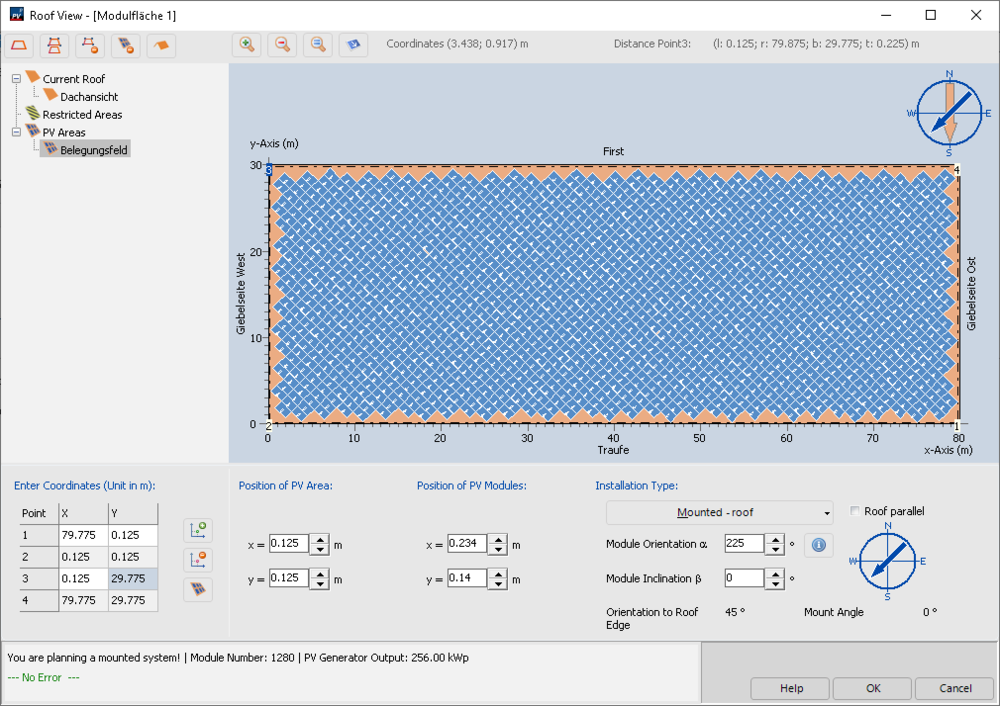
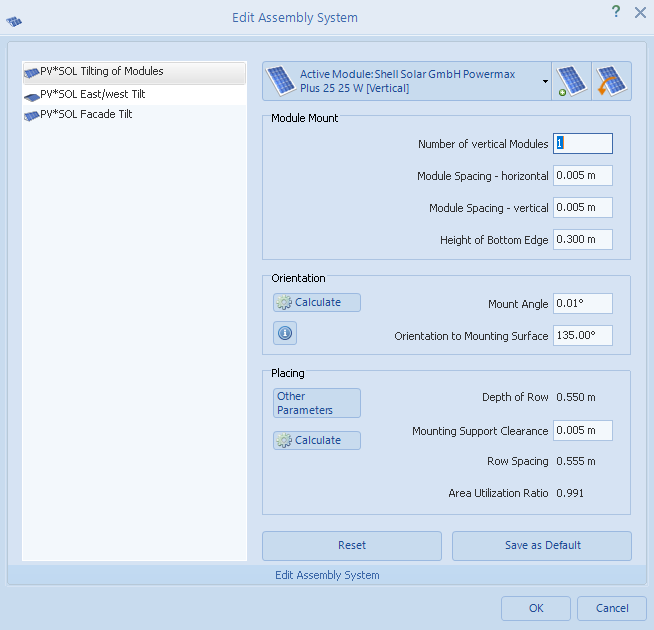
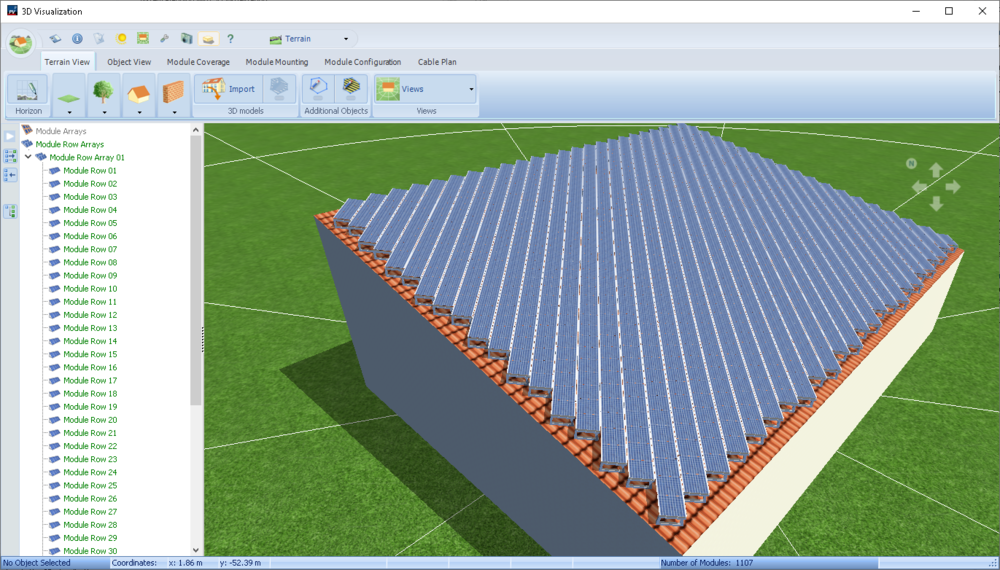
Hi Sondre207, I must admit I missed your question. Sorry about that. Within the graphical allocation (2D) this is possible: Set installation type to Mounted - roof Uncheck Roof parallel and set a different module orientation Change the module inclination to 0° Change the row distance from 1m back to 0.005m to get rid of the default row distance In 3D you can achieve a similar effect by using module mounting: which results into this configuration: The problem is you cannot get rid of the mounting system as far as I'm concerned.. You can get rid of the mounting system by setting height of bottom edge to 0. Best regards, Frederik
-

Leistungsbegrenzung von Wechselrichtern einstellbar / simulierbar?
developer_fw replied to Markus Glöckler's topic in PV*SOL
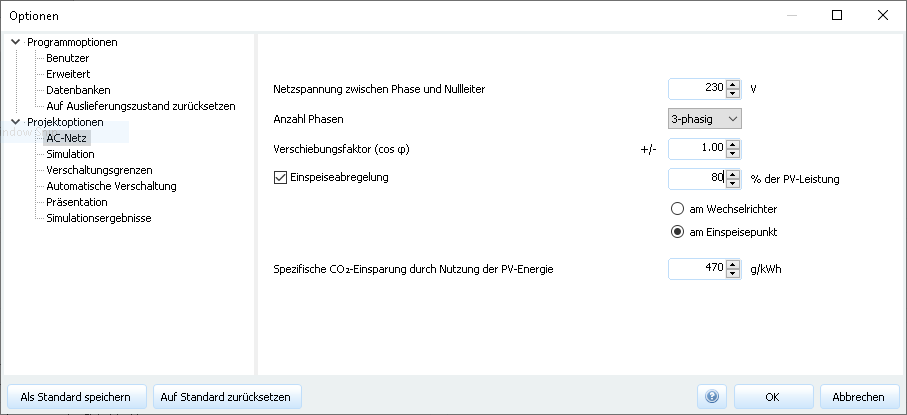
Hallo Markus Glöckler, ja, das ist möglich. In den Projektoptionen unter AC-Netz lässt sich eine Einspeiseabregelung wählen: Ich hoffe, das hilft weiter? Viele Grüße! Frederik -
Hallo Ralf, ist es möglich, uns die Projektdatei zukommen zu lassen, um der Sache auf den Grund zu gehen? Am besten hier im Forum per persönlicher Nachricht. Welche Version ist in Benutzung? Viele Grüße, Frederik
-
Hi Photovoltaique83, I'll pass your request to our database team. In the meantime you could create new database entries for your project with the datasheets they provide: https://my.dualsun.com/en/resources/#spring Let me redirect you to our help pages for creating your own modules: https://help.valentin-software.com/pvsol/2021/en/databases/components/pv-modules/ Best regards, Frederik
-
Hallo MarkusPV30, das ist zur Zeit leider nicht möglich und ja, PV*SOL rechnet über 20 Jahre mit dem gleichen Strombedarf. Dies steht bei uns auf der Feature-Liste, unter anderem auch, weil sich der Verbrauch über die Jahre stark ändern kann. Sonnige Grüße, Frederik
-
Hallo Ralf, sehr verständlich, dass Du möglichst genau wissen möchtest, wie Verläufe in den Lastprofilen zustande kommen! In Deinem Fall hast Du ein Lastprofil gewählt, das von der HTW Berlin zur Verfügung gestellt wurde: https://pvspeicher.htw-berlin.de/veroeffentlichungen/daten/lastprofile/ Dort findest Du eine Beschreibung der Datengrundlage. Außerdem können die Daten herunter geladen und analysiert werden, um sich selbst einen Überblick zu verschaffen. Dein gewähltes Profil wurde folglich sogar sehr sorgfältig geprüft. Die Arbeitsgruppe an der HTW freut sich immer über Rückfragen. Im Zweifelsfall einfach per Email anschreiben. Ich hoffe, das hilft weiter. Viele Grüße! Frederik
-
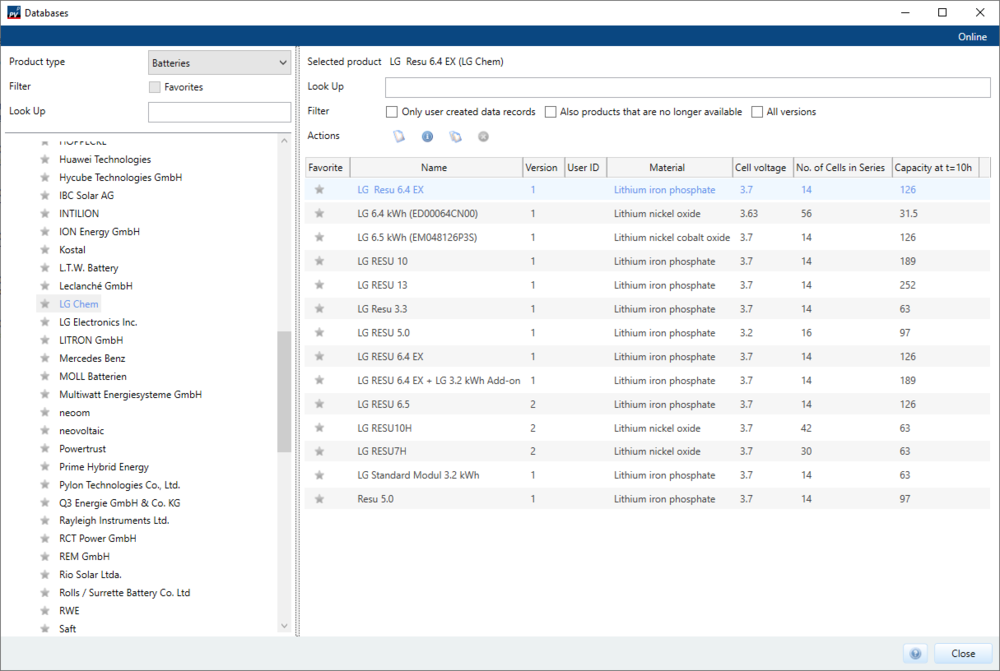
Hallo Schlarsa, ich habe Deine Anfrage an unser Datenbankteam weiter geleitet. In unserer Herstellerdatenbank sind diese enthalten: https://pvsol-database.valentin-software.com/Products?dbEntryType=Battery&areUnavailableProductsVisible=False&selectedCompany=96237dd4-11b9-4732-b256-77a6b42f8452 In PV*SOL auch: Ich werde aber nochmal unsere Datensätze abgleichen und nachsehen, ob welche rausgeflogen sind. Sind das die Datensätze, die Du gesucht hast? Viele Grüße, Frederik
-
Hi Sondre207, welcome to the forum! I looked into the data sheet of the shingles by Sunstyle (attached). PV*SOL is limited to rectangular shaped modules which results in difficulties with the modules at the roof edges. You could turn the modules by 45° degrees but then you cannot use the whole roof space. Assuming a rather big roof so this little workaround doesn't affect the results too much I would recommend creating 4 different modules (basic, top, bottom, left/right with the values from the data sheet) and install them perpendicular to the edges taking into account the different areas. This does not have the shingle roof look but I would guess for middle sized roofs and above you will have a very good estimate. I hope this helps! Best regards, Frederik Data_Sheet_Solar_Roof_SUNSTYLE_E.pdf
-
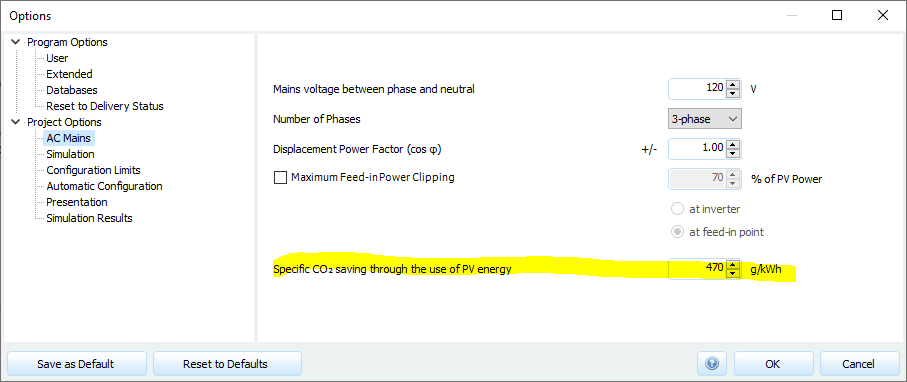
Hi Ygor.Ribeiro, welcome to the forum! At the moment PV*SOL calculates with a constant value which can be set in the project options: Best regards, Frederik
-
Hi Photovoltaique83, with PV*SOL premium you can choose between different modes of planning. Either you plan your PV system in 3D as you do, or you plan it in 2D with the possibility to use graphical allocation or photo plan. Using Photo Plan and 3D is not possible. Best regards, Frederik


