


developer_mh
-
Posts
1,855 -
Joined
-
Last visited
-
Days Won
173
Everything posted by developer_mh
-

What does the "Reduce the number of points of the 3D object" option do?
developer_mh replied to Jimmy's topic in PV*SOL
Hi Jimmy, for your question I had to ask a colleague and this is what he replied: I guess this answers both of your questions and perhaps sheds some light on the algorithms behind it. Kind regards, Martin -
Datenbank BYD Batterie mit SMA WR Datensatz veraltet?
developer_mh replied to Lukas615's topic in PV*SOL
Hallo Lukas, danke für den Hinweis, ich werde das weiterleiten an unser Datenbank-Team. Viele Grüße, Martin -
Hallo masp, könntest du mir so eine Datei zukommen lassen? Gerne hier im Forum als private Nachricht. Danke und viele Grüße, Martin
-
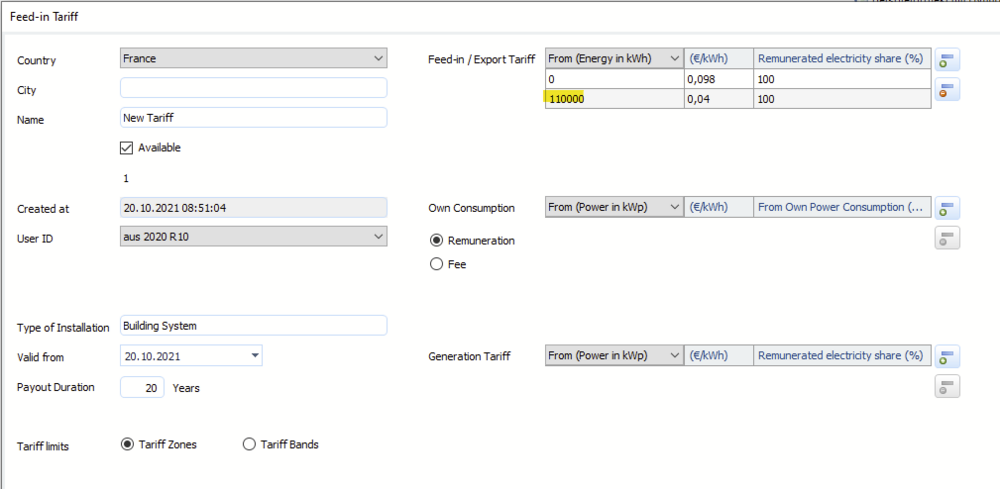
Hi Patrice, the levels or zones in the tarriffs in PV*SOL can't be entered in kWh/kWp (or kWh/kWc in France), hence it would be necessary to enter the total kWh that these zones would refer to for your current PV system. For example, if your PV system has 100 kWp (or kWc in France), you would enter the following: So, for the first 1100 kWh of each of your installed kWp (kWc), you would get 0.098 €, and after that it is 0.04 €. If your PV system has 250 kWp (kWc), you would have to enter 1100 * 250 = 275000 kWh: Hope that helps, and I also hope that I did get your question right. Kind regards, Martin

-
What does the "Reduce the number of points of the 3D object" option do?
developer_mh replied to Jimmy's topic in PV*SOL
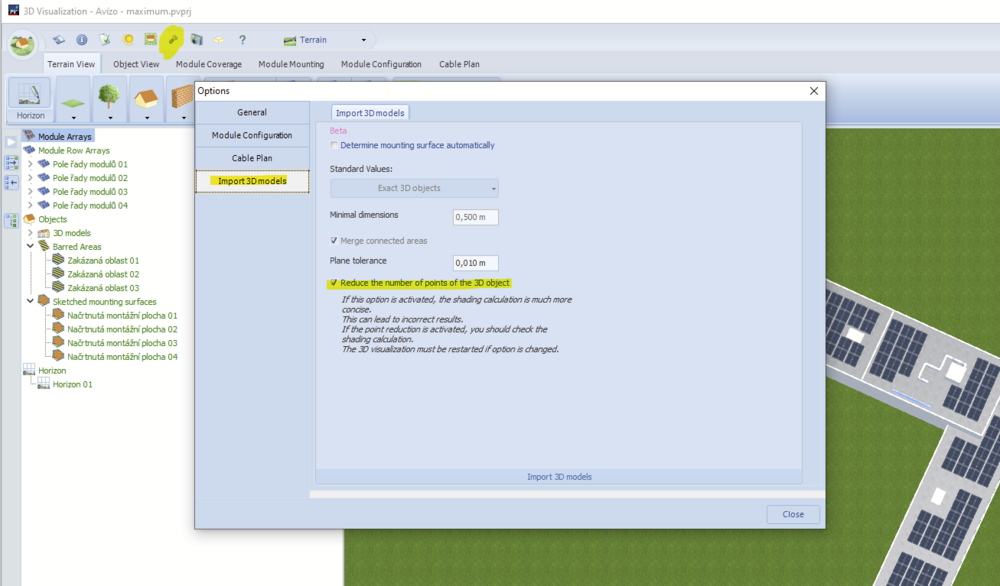
Hi Jimmy, this function basically does what the description says. It reduces the number of points of the 3D objects in order to make the overall handling and especially the shading calculation more efficient. It is essentially an algorithm that detects similar triangles and melts them together. In this manner, the number of points is reduced. But since this reduction can lead to inaccuracies in the resulting planes, a warning is given that the user has to check carefully the shading results. Hope that helps, kind regards, Martin -
Model integrated solar panels on curved bulding
developer_mh replied to Thomas D H's topic in PV*SOL
Hi Thomas, in PV*SOL it is not possible to place modules or a module mounting on curved surfaces. You'll have to split the surface into small elements with even surfaces, large enough to place PV modules onto it. Also see these posts for reference: Kind regards, Martin -
Hallo Thomas, Schindelmodule können mit ihrem speziellen Verschattungsverhalten tatsächlich derzeit nicht in PV*SOL simuliert werden. Man könnte aber in erster Näherung ein Modul anlegen mit 340 Zellen, 6 Bypassdioden und dem Zellmaterial triple a-Si. Die Verstringungsrichtung auf horizontal gestellt, sollte sich dann in der Simulation ein einigermaßen realistisches Bild ergeben. Ich habe ein Beispielprojekt mit dem HiE-S400VG mal angehängt, vielleicht hilft das weiter. Viele Grüße, Martin Beispielprojekt mit Hyundai HiE-S400VG Shingled.pvprj
-
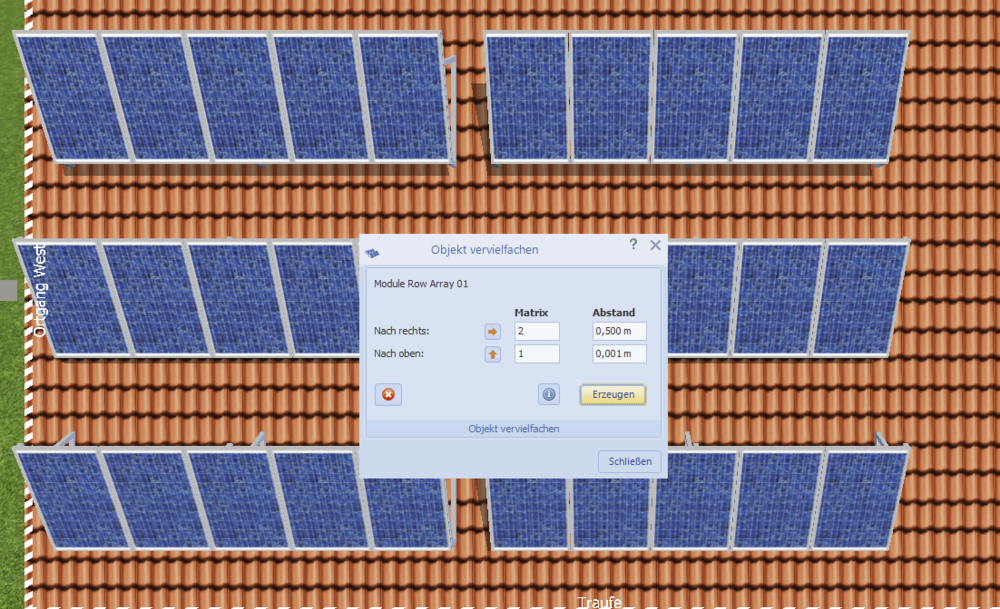
Hallo Hannes, eine waschechte Funktion zum Definieren von Gängen in aufgeständerten Anlagen gibt es derzeit leider nicht. Das steht schon seit längerer Zeit auf unserer Liste, allerdings kann ich derzeit nicht sagen, wann wir uns das Feature vornehmen werden. Man kann aber in Blocks arbeiten und dann die einzelnen Blocks mit definierten Abständen vervielfältigen. Vielleicht hilft das etwas weiter. Ich habe zunächst die linken 15 Module (3 Reihen à 5 Module) erstellt und dann einen Rechtsklick darauf gemacht und "Modulreihenformation vervielfältigen" gewählt. Damit kann man schon einiges machen. Ich hoffe, das hilft erstmal weiter. Viele Grüße, Martin
-
Hallo Andrej, wäre es möglich, uns eine Projektdatei zukommen zu lassen? Gerne hier im Forum als private Nachricht. Vielen Dank, beste Grüße, Martin
-
Dear all, here is the fix that helped in Davids case: Hope that helps, kind regards, Martin
-
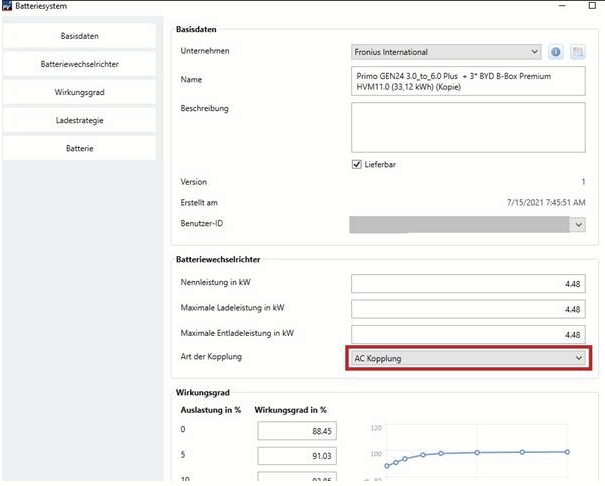
Fronius GEN24 nach Update keine DC Kopplung möglich
developer_mh replied to jens682's topic in PV*SOL
Hallo Jens, das Thema kommt in letzter Zeit häufiger auf. Hier die Antwort unserer Hotline zum Thema: Ich hoffe, das erklärt die Sachlage. Viele Grüße, Martin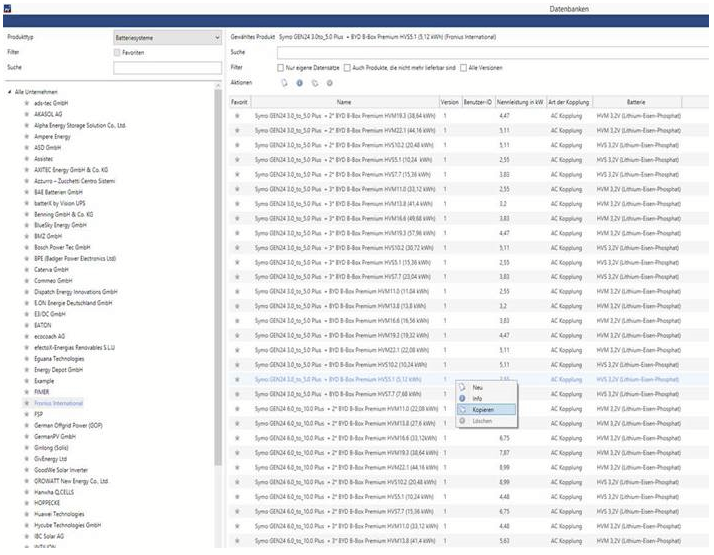
-
Of course you may, Jimmy, thank you. It is just that nothing was changed concerning the shading calculation in the last releases, so I doubt that it would help.
-
Hi Bill, the link to the bankability dialog is located on the economy page, but only for projects without electrical consumption (choose "grid connected PV system" from the list). Hope that helps, kind regards, Martin
-
Hi David, this is a serious bug, no question. Could you please provide a project file to us, so that we can look into it? You can send it to me as private message here in the forum or send it as an email to hotline@valentin-software.com, along with your customer number and a short reference to your forum post here. Thanks a lot, kind regards, Martin
-
Hi Nabil, the U0-charging (boost charge) will be done with grid power if PV power isn't sufficient. So in order to fully avoid charging from the grid you can set the upper limit of the I-charging mode (bulk charging) to 75%, or the end of U0-charging to 70%. Since you want to achieve an 80% charging limit, you can also set all those values to 80%. Setting the duration of the maintenance modes (equalisation and full charge) to 0 is also the right thing to do. Kind regards, Martin
-
Is it possible to download previous versions somewhere?
developer_mh replied to Jimmy's topic in PV*SOL
Hi Jimmy, you can find the setup file for PV*SOL premium 2021 R4 here: http://downloads.valentin.de/pvsol/setup_pvsolpremium_2021_4.exe Kind regards, Martin -
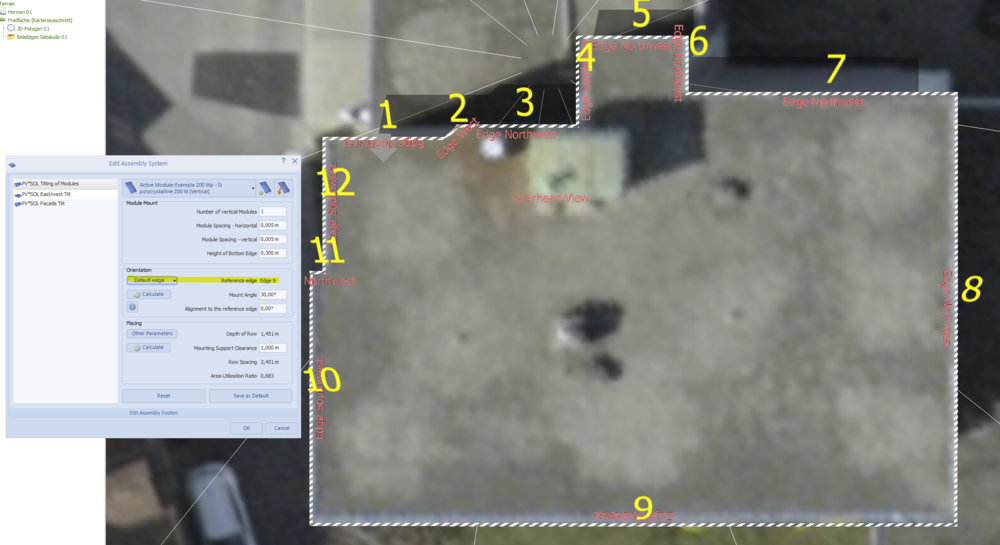
Hi Jimmy, if you use module mounting systems, you can select the edge that is used as a reference: The module coverage tool doesn't have this option. If you need the modules to be mounted horizontally, just set the mounting angle to 0°. Kind regards, Martin
-
Hi Paramesh, could you provide the log files please? You can find them here: C:\ProgramData\Valentin EnergieSoftware\log C:\ProgramData\Valentin EnergieSoftware\log Just send me a private message here in the forum, thanks. Kind regards, Martin
-
Hi Wouter, our 3D team checked your model and it seems to be fine. Apparently there is a bug in the automatic detection of the mounting surfaces. We will file a bug notice with your model attached to the responsible developer so that he can fix it perhaps. But since he is busy right now with other things, and since it is a feature in beta state, please understand that there won't be an immediate fix for that. In the meanwhile we recommend to use the draw tool in those cases in order to get clean mounting surfaces. Kind regards, Martin
-
Dear Wouter, thanks, I didn't realize that you already posted the model. I forwarded it to our 3D team and the hotline. Let's see what they say. Kind regards, Martin
-
The scale of the building does not correspond to the scale of the loaded map
developer_mh replied to Andrii's topic in PV*SOL
Hi Andrii, this is interesting. Could you provide us a project file with the described map section and 3D model? You can send it here in the forum as private message. Thanks a lot, kind regards, Martin -
Hi Bill, this is just an inaccuracy in the translation of the 3D environment. "Flush Mount" is the type you are looking for. Kind regards, Martin
-
Dear Wouter, dear Jimmy, we really appreciate how you discuss with each other and help you out! Could you try to reduce the model so that only the lower block remains and then convert it into an obj file? Which software are you using for modelling and converting dwg to obj? Kind regards, Martin
-
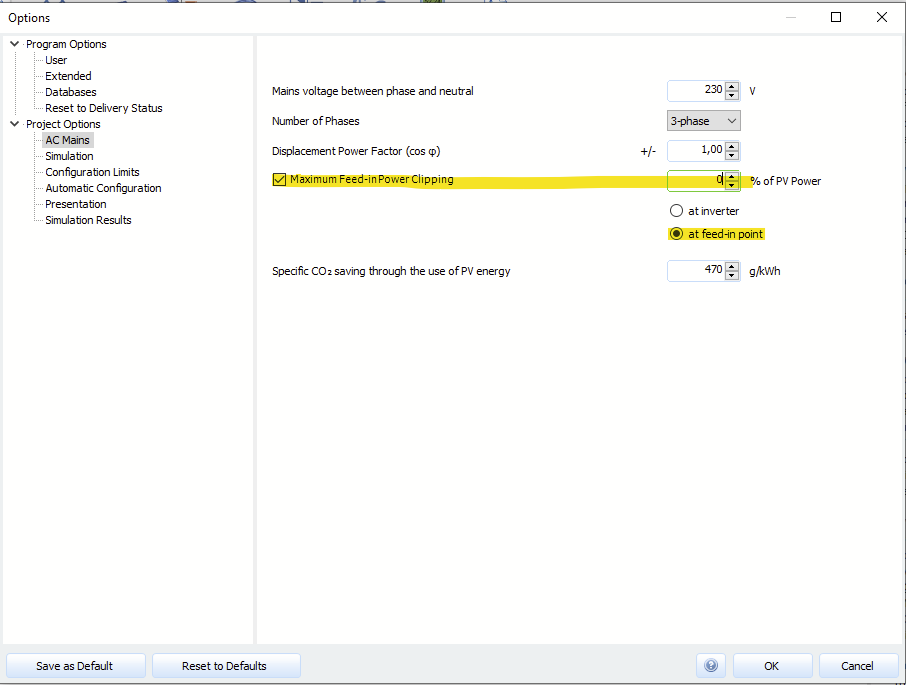
Dear Gorka, you can avoid a grid feed-in if you set the maximum feed-in power clipping to 0 % at the feed-in point in the dialog of the AC grid: Concerning your last question: Thanks for pointing that out, we will put that on our list. Kind regards, Martin
-
Auto in PV-Sol - Verbesserungsbedarf PV Überschussladen
developer_mh replied to RLoos's topic in PV*SOL
Hallo Finn, dazu gibt es leider noch kein Update. Auch im nächsten Release wird es nicht enthalten sein, tut mir leid. Wir mussten andere Dinge priorisieren. Viele Grüße, Martin


