


developer_mh
-
Posts
1,859 -
Joined
-
Last visited
-
Days Won
173
Everything posted by developer_mh
-
Hi cjSPS199, if you are a manufacturer or licensed distributor and you wish to enter products in our database, you can contact our database team at database@valentin-software.com. Kind regards, Martin
-
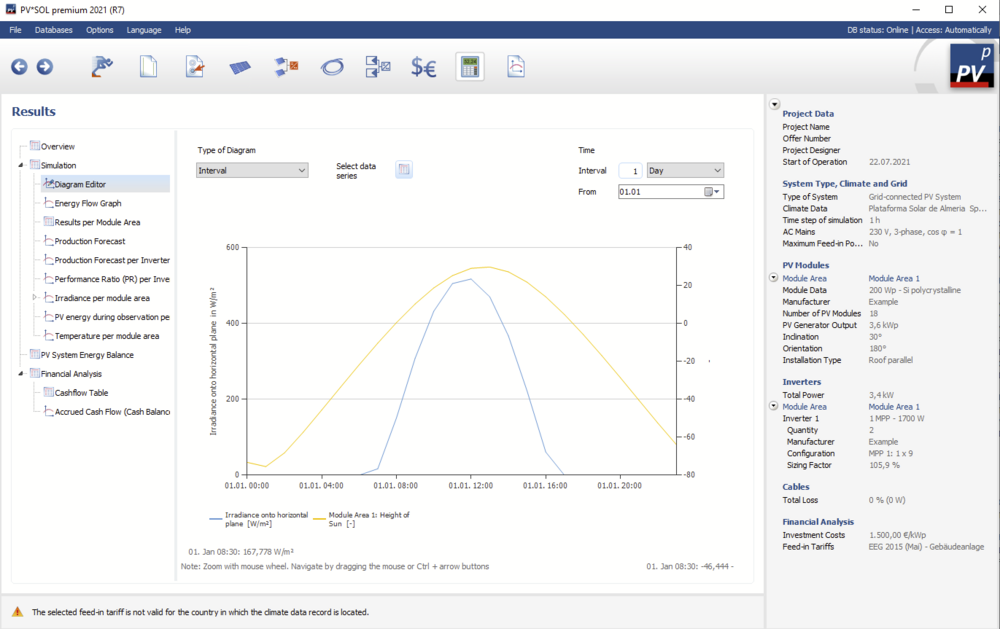
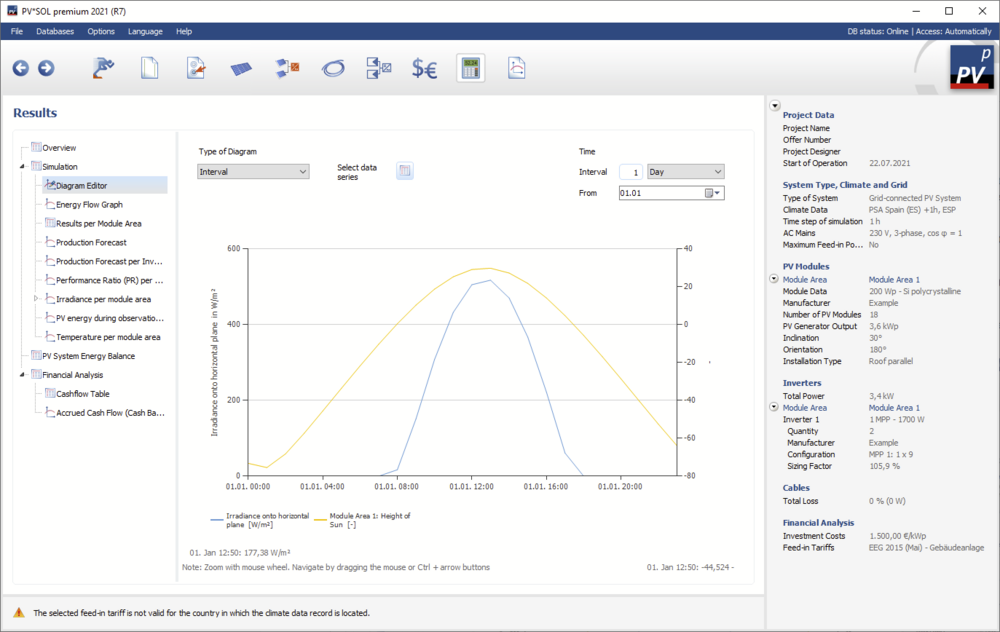
Hi Endika, in PV*SOL, you can only import hourly data. Data with one-minute resolution can be synthesized from it afterwards, but you can't import your own, I am afraid. When you import hourly data, and PV*SOL shows a hint that "Input data and clear sky data are not sync", it means that you irradiation data and the calculated position of the sun do not fit together. Most likely it is because of the time zone or other timestamp-related issues. The data must be in local time, without daylight saving time switch, and right-justified. That means the timestamp from e.g. Jan 01, 11:00 refers to data between 10:01 and 11:00. You can easily check if you imported hourly data is in sync with the sun position when you look at the imported irradiation and the elevation of the sun in the diagram editor. Search for a clear sky day, where the irradiation follows a nice bell-shaped curve, and see if the elevation follows approximately the same curve: Here, as an example, these data are not in sync, since the peak of the irradiation comes approx one hour before the peak of the sun's elevation: Here, the data are in sync: Hope that helps, kind regards, Martin
-
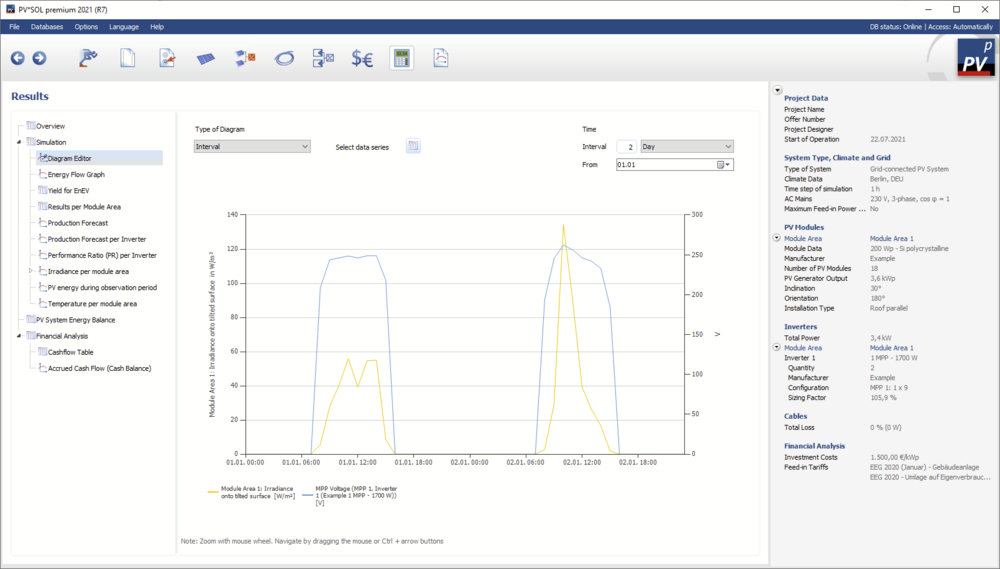
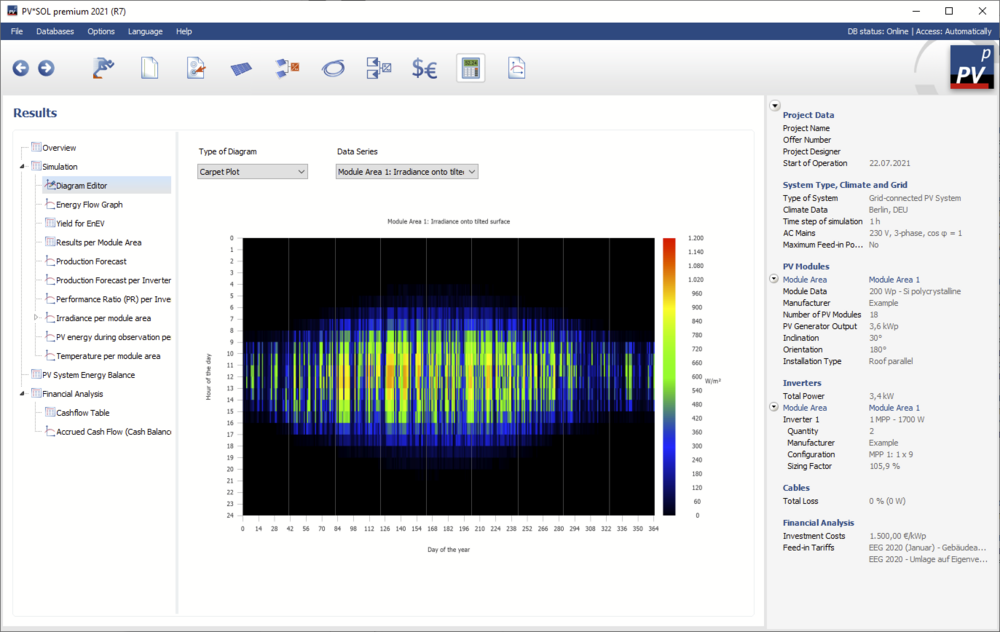
Dear Gerhard, in PV*SOL you can only simulate one whole year. However, you can look at the simulation results in a very high resolution and flexibility afterwards. Use the diagram editor to show the results you like, over time (so you can see every morning as well): Or use the carpet plot, to analyse all mornings of one year at once: Or you can export the simulation results and analyse the data in another tool, e.g. MS Excel or LibreOffice. Hope that helps, kind regards, Martin
-
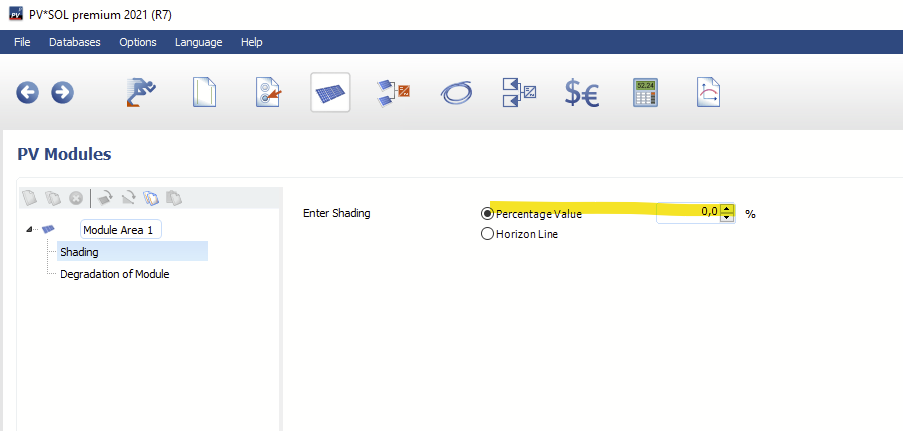
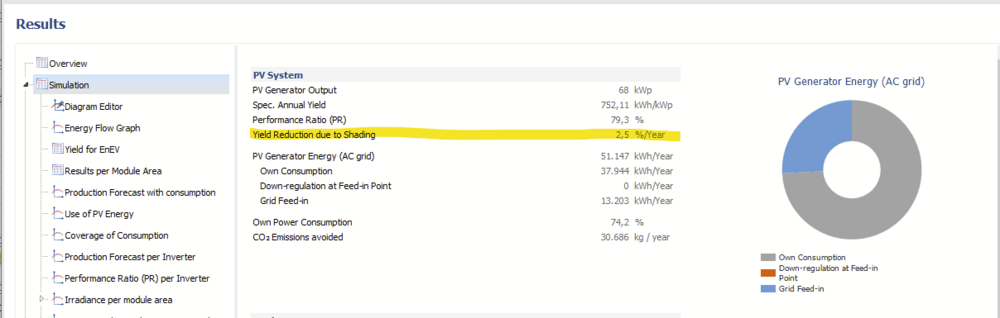
Dear Aljaz, you can simulate very large PV farms in the 2D mode, no problem. We recommend to make a pre-simulation in 3D with a subset of the modules, e.g. with 1000, depending on your PV farm layout and setup. Then simulate it and write down the yield reduction due to shading: Then configure your complete PV farm in the 2D mode and enter the shading loss from the 3D simulation as shading loss in 2D: Or, follow point 3) from this answer here, but at your own risk: Hope that helps, kind regards, Martin
-
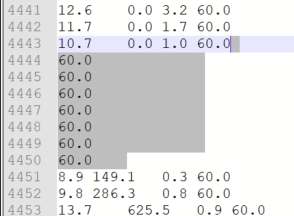
Hi Endika, there are some lines in your file where data is missing: Other than that, the file should be fine. Kind regards, Martin
-
Hi Vishnu, thank you for reporting this. Could you provide the project file please? I quickly checked it, and it seems to work as expected: Kind regards, Martin
-
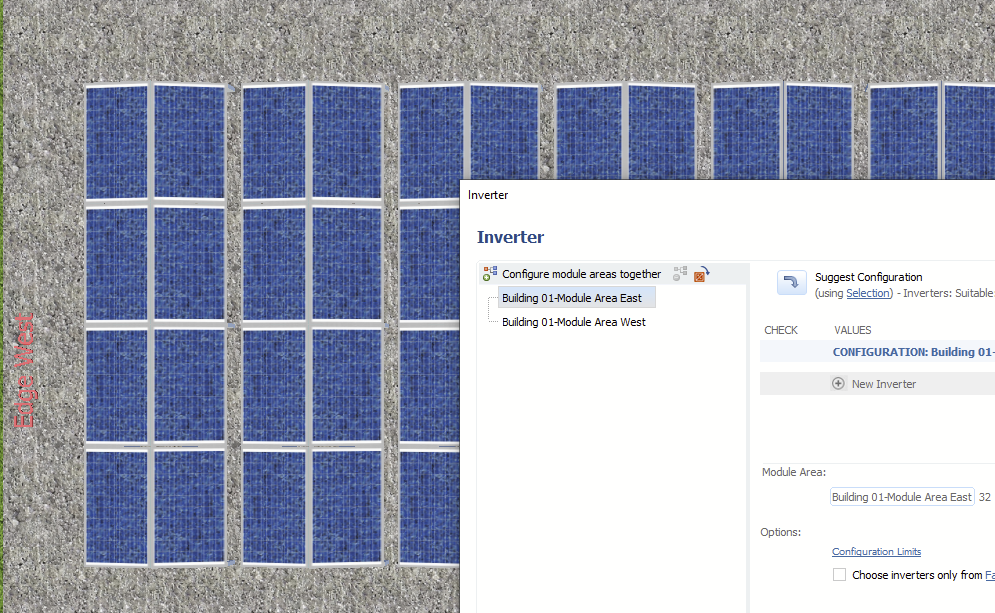
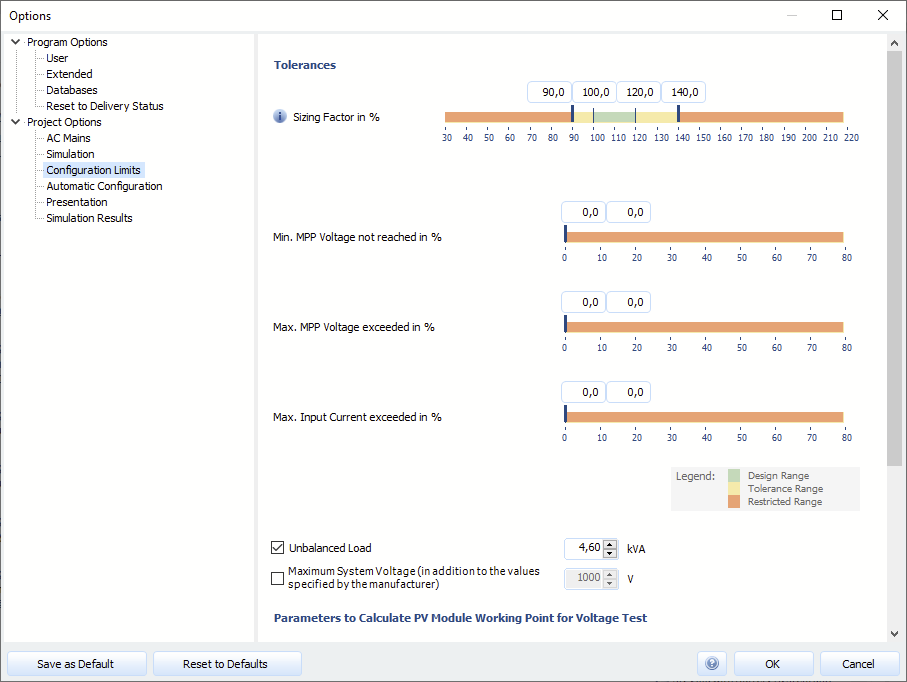
Hi apaec, the sizing factor is defined as the installed DC power of the PV modules in relation to the AC power of the inverter. So, if you have 100 kWp of PV modules, and an inverter of 100 kW AC output, you'll get a sizing factor of 100%. If you have 150 kWp PV module power connected to a 100 kW inverter, that would be a sizing factor of 150%. The sizing factor is a design choice. The higher the sizing factor, the smaller the inverter. Smaller inverters usually are cheaper than bigger ones, so you can save cost there. But then you'll have more down-regulation situations where the PV produces more than the inverter can handle. So the inverter will limit the output and "throw away" the excess energy, so you'll lose some portion of your PV energy. That effect will decrease the profitabitility of your project. So the planner of the PV system has to make a choice which inverter to connect to the PV array. With PV*SOL, you can easily see the impact on the energy yield a smaller inverter (higher sizing factor) would have. The limits of the sizing factor can be modified in the Options -> Configuration Limits: Hope that helps, kind regards, Martin
-
 Dear Daniel, concerning your first question, please have a look at this answer here: ad 2) There is no simple calculation formula here, I am afraid. What we do is really simulating the irradiance on the module surface, with diffuse and direct shadowing, down to substring level. Then we use an IV-model (two-diodes-model or our own "PVSOL" model) to calculate the I-V characteristics of the module under the given conditions. In addition we also calculate the IV characteristics of the module without shadow and remember this value, so that we can determine the losses due to module-specific partial shading afterwards. You can find more detail here on our help pages: https://help.valentin-software.com/pvsol/en/calculation/irradiation/ https://help.valentin-software.com/pvsol/en/calculation/pv-modules/ ad 3) The configuration or shading mismatch is the difference between the actual output power of an PV array (several modules connected together), not regarding ohmic losses, and the sum of the individual output power values of each module at each moment. When you have inhomogeneous shading on the modules, the resulting IV characteristics of the array may be such that it is not possible to hit the MPP for each module. Instead, the overall array MPP will be chosen, and this point may vary more or less from the per-module MPP. Hope that helps, kind regards, Martin
 -
Dear Paul, thank you for the project. The problem here is the limitation of the MC box (multicluster box). It can only connect to a maximum of 12 three-phase clusters of Sunny Islands and to a maximum of 360 kW of PV power. https://www.sma.de/en/products/battery-inverters/multicluster-boxes-for-sunny-island.html And PV*SOL doesn't support more than one MC box at a time. So I would suggest to break your 5MW project down into a smaller unit, let's say 250 kW, a 1/20th of your current project. You would calculate with 575 PV modules, smaller PV inverters, a load of 32,5 kW and then you can configure the battery system accordingly. Finally you would have to scale up the results by 20, manually. Sorry that we can't provide a different solution, but this is as it is right now. Kind regards, Martin
- 1 reply
-
- 1
-

-
Dear Douglas, we are working on it, as well as on the integration of other climate data sources, and we hope to be able to release it with the new major version, PV*SOL premium 2022 R1 in November. Kind regards, Martin
-
PV*Sol - Irradiation and atmospheric Database sources
developer_mh replied to Javier Otálora's topic in PV*SOL
Hi Lynette, when we simulate with an one-hour timestep, we can directly interpret the incoming irradiance values (in W/m²) from the climate data as irradiation values (in Wh/m²). When we simulate with one-minute values, you can see the output in the diagram editor or you can export them to csv on the presentation page. Here it is in W/m², when you export, you'll get kWh/m², depending on your export settings. The irradiation is only available on module level. The diffuse shading is applied on the whole module homogeneously while the direct shading affects the cells with varying intensity. But these different irradiation values (on cell or substring level) are not logged at the moment, it would lead to a huge amount of simulation data. Hope that helps, kind regards, Martin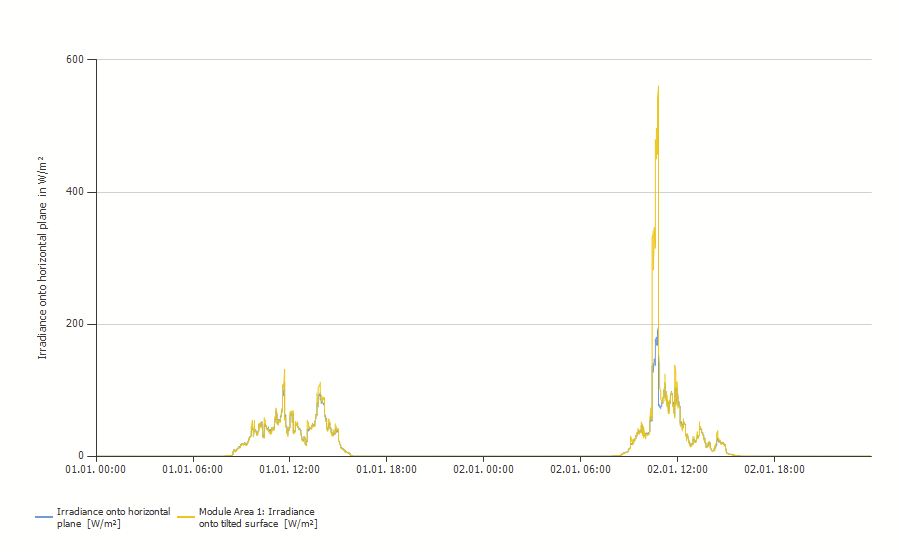
-
Ungenauigkeit in der Wirtschaftlichkeitsrechnung
developer_mh replied to Patrice Ahmadi's topic in PV*SOL
Hallo Patrice, danke vielmals für den Input. Du hast natürlich Recht, der "Preisänderungsfaktor Einspeisevergütung" sollte sich nicht auf die Abgaben beziehen. Ich nehme das mal in die Liste mit auf. Der andere Punkt, also das getrennte Anzeigen der Tarife, auch in der Cashflow-Tabelle, steht bereits auf der Liste. Und dort auch relativ weit oben. Danke für das Feedback, viele Grüße, Martin -
Dear Ben, the electrical load profiles we provide in PV*SOL have various origins. Here is an overview that I just compiled: Name EN Description Source 1-person household Load Profile Generator 2 person household with one child Load Profile Generator 2-person household Load Profile Generator 2-person household with 2 children Load Profile Generator BDEW commercial load profile (G1) Business, weekdays 8 am to 6 pm (i.e. offices, doctor's offices, workshops, administrative units) BDEW BDEW load profile business (G2) Business with high or primary use in the evening (i.e. sport clubs, fitness studios, night clubs) BDEW BDEW load profile business (G3) Continual business operation, i.e. cold warehouses, pumps, sewage treatment facilities (cold warehouses, pumps, sewage treatment facilities) BDEW BDEW load profile business (G4) Shop/Hairdresser BDEW BDEW load profile business (G5) Bakery with shop attached BDEW BDEW load profile business (G6) Weekend operations (i.e. cinemas) BDEW BDEW load profile business (GO) General business (weighted mean of profiles G1-G6) BDEW BDEW load profile household (H0) BDEW BDEW load profile agriculture (L0) Agriculture (weighted mean value of profiles L1 and L2) BDEW BDEW load profile agriculture (L1) Agricultural operations with milk/secondary income livestock BDEW BDEW load profile agriculture (L2) Other agricultural operations BDEW Brasil Centro Oeste Solarize Brasil Nordeste Solarize Brasil Norte Solarize Brasil Sudeste Solarize Brasil Sul Solarize Colombia Amazonia Solsta Colombia Andina Solsta Colombia Caribe Solsta Colombia Orinoquia Solsta Colombia Pacifico Solsta Household, seasonal course comparable with standard profile Load profile 31 HTW Berlin Household, load profile with high night proportion Load profile 67 HTW Berlin Household, load profile with high summer proportion Load profile 26 HTW Berlin Household, Load profile with high percentage of morning hours Load profile 68 HTW Berlin Household, Load profile with low percentage of nighttime hours Load profile 61 HTW Berlin Household, load profile with low summer proportion Load profile 12 HTW Berlin Household, Load profile with low percentage of morning hours Load profile 48 HTW Berlin Household, diurnal course comparable with standard profile Load profile 17 HTW Berlin Load profile with constant load Constant load throughout the year, e.g. broadcasting station Heat pump Base year 2011 Heat Pump System with Space Heating (air/water) GeoT*SOL Heat Pump System with Space Heating (brine/water, geothermal collector) GeoT*SOL Heat Pump System with Space Heating (brine/water, geothermal probe) GeoT*SOL Heat Pump System with Space Heating (water/water) GeoT*SOL Heat Pump System with Space Heating and Domestic Hot Water (air/water) GeoT*SOL Heat Pump System with Space Heating and Domestic Hot Water (air/water) with Heating Element GeoT*SOL Heat Pump System with Space Heating and Domestic Hot Water (brine/water, geothermal collector) GeoT*SOL Heat Pump System with Space Heating and Domestic Hot Water (brine/water, geothermal probe) GeoT*SOL Heat Pump System with Space Heating and Domestic Hot Water (water/water) GeoT*SOL Sources: Load Profile Generator Created with the LoadProfileGenerator (https://www.loadprofilegenerator.de/) HTW Berlin University of Applied Sciences: „Representative electrical load profiles of residential buildings in Germany with a temporal resolution of one second“, dataset, Berlin, 2015 GeoT*SOL Created with GeoT*SOL 2020 R1 Solsta provided by Solsta SAS, data from XM (Colombian electricity market administrator) Solarize provided by Solarize BDEW Standard load profiles of German BDEW (German Association of Energy and Water Industries) I hope that helps. I will try to find the time to update the help also in the near future. Kind regards, Martin
-
Hi Jimmy, haha, you should really avoid doing this. But yes, if you break stuff there you can just uninstall and reinstall, and it should run again. Concerning the model: I think it would be the best option to send me the model that causes the problem, here in the forum as private message. Then we can have a look if we find something. There are limitations that we know of, like the number of vertices as you are already aware, but in your case it seems to be something else. Thanks and kind regards, Martin
-
Hallo Paul, hier wäre es gut, wenn ich das Projekt bekommen könnte. Ohne das Projekt kann ich leider nicht sagen, was da genau passiert. Könntest du es mir hier im Forum in einer privaten Nachricht zukommen lassen, bitte? Vielen Dank und beste Grüße, Martin
-
-
Hallo PV-Robin, wir haben uns selbst etwas gewundert, dass BYD bzw. Fenecon die Komponenten auf "nicht mehr lieferbar" gesetzt hat. Aber das liegt eben nicht in unserer Hand, da die Hersteller bei uns die Daten eintragen. Wir sind aber mit ihnen in Kontakt und versuchen die Ursache bzw. die eigentliche Intention dahinter zu klären. Wahrscheinlich handelt es sich um ein Missverständnis in der Datenbank-Pflege. Wir rechnen eigentlich damit, dass die Speicher bald wieder verfügbar sein werden - versprechen können wir es aber nicht. Viele Grüße, Martin
-
Hallo Kathi, eine aufs einzelne Modul heruntergebrochene Ertragsanalyse gibt es in PV*SOL nicht, nein. Vor allem deswegen, da ja die Module nicht einzeln/isoliert den Ertrag bringen, sondern als ganzes PV-System. Würde man ein Modul aus einem der Stränge heraus nehmen, würde sich auch die elektrische Verschaltung ändern und damit auch das Verhalten der ganzen Anlage, bzw. der Teilanlage. Insofern ist eigentlich das genauste Vorgehen, verschiedene Varianten der Anlage zu rechnen, dabei immer ein Modul wegzulassen und am Ende den Ertrag der Varianten im Projektvergleich zu vergleichen. Ist halt ein bisschen Aufwand. Die modulunabhängige Verschattung kann erklärt werden als der Anteil der Solarstrahlung, der für alle Module gleichermaßen durch Verschattung verloren geht. Dies kann zum Beispiel bei einer eingestellten Horizont-Verschattung der Fall sein oder bei identisch platzierten nahen Verschattungsobjekten. Im Gegensatz werden bei der modulspezifischen Teilabschattung alle Verluste zusammengefasst, die durch die individuelle Verschattung der PV-Module entstehen. Es werden die elektrischen Verluste betrachtet, die je nach Verschattungssituation und Modulaufbau teilweise erheblich höher ausfallen können als die reinen Verluste an Solarstrahlung. Die Schattenhäufigkeit in 3D dient eher als Planungshilfe. Man kann sie eher dazu nutzen, um zu sehen, welche Module man zusammenschalten sollte. Sie ergibt sich aus der Minderung der Clear-Sky-Direktstrahlung. Der tatsächliche Ertragsverlust wird also immer geringer sein als der in 3D angezeigte Wert. Anders formuliert nochmal hier: Ich hoffe, das hilft weiter. Viele Grüße, Martin
-
Hi Wouter, yes, if the obstruction objects are part of the 3D object, they must be re-traced manually (barred area polygon). Trace the object once, then copy it (multiple copy) and move it to the corresponding position. Should be reasonably fast. However, the shading caused by the objects is taken into account, so no worries there. Kind regards, Martin
-
Hallo DDF, hier verhält es sich nicht anders. Wenn bei den Wirtschaftlichkeitsparametern netto angegeben wurde, gibt man bei den Tarifen auch den Netto-Betrag ein, andernfalls beides Mal brutto. Wichtig ist nur, dass man es konsistent hält. In anderen Worten: PV*SOL ist Umsatzsteuer-ignorant, es kümmert sich an keiner Stelle um die Berechnung oder Ausweisung der USt bzw. MwSt. Viele Grüße, Martin
-
Hallo Philip, nein, das derzeit leider nicht möglich. Wir haben das als Feature-Wunsch aber bereits auf unserer Liste stehen, es ist derzeit aber nicht in Bearbeitung, tut mir leid. Viele Grüße, Martin
-
Hallo AMB, nein, eine Analyse der Blendeinwirkung ist mit PV*SOL leider nicht möglich. Ich würde aber gerne den Kontakt zur DGS Berlin-Brandenburg empfehlen, die haben sich viel mit Blendgutachten beschäftigt: https://www.dgs-berlin.de/solarservices-gutachten/angebote-solarservices Viele Grüße, Martin
- 1 reply
-
- 1
-

-
Hallo Oakman, wäre es vielleicht möglich, mir die Projektdatei zukommen zu lassen? Dann lässt sich so eine Frage immer leichter beantworten, danke. Gerne hier im Forum per privater Nachricht. Viele Grüße, Martin
-
PV-Sol Premium abgestürzt, seither fehlen in der Datenbank Batteriespeicher
developer_mh replied to DDF's topic in PV*SOL
Hallo DDF, BYD und Fenecon haben tatsächlich ihre gesamte Batterie-Palette bei uns in der Datenbank auf nicht mehr lieferbar gesetzt. Wir haben uns auch etwas gewundert. Unsere Nachforschungen haben ergeben, dass sie scheinbar die Einträge komplett überarbeiten wollen. Das Fehlen dieser Batterien führt nun an ein, zwei Stellen im Programm zum Absturz. Diese Stellen haben wir bereits gefixt und werden sie mit dem nächsten Release (PV*SOL premium 2021 R7) veröffentlichen. Unser Datenbank-Team arbeitet parallel auch an einer Lösung und ist mit BYD bzw. Fenecon im Austausch. Beste Grüße, Martin -
Hallo Ralf, man kann auch immer die alten Versionen eines Produktes aus der Datenbank verwenden. Einfach im Datenbank-Auswahl-Fenster den Haken bei "Alle Versionen" setzen. Um welches Fronius-Gerät handelt es sich denn? Viele Grüße, Martin


