developer_mh
-
Posts
1,855 -
Joined
-
Last visited
-
Days Won
173
Everything posted by developer_mh
-
 Hallo J Berends, leider kann das AC-seitige Nachladen derzeit nicht in der Simulation dargestellt werden. Wir haben diesen Feature-Wunsch bereits auf unserer Liste, ich kann aber derzeit noch nciht sagen, wann wir es werden implementieren können. Ja, tatsächlich. Wir sind uns auch bewusst, dass die Funktionalität immer öfter angefragt wird und werden das in unserer Planung berücksichtigen. Viele Grüße, Martin
 -
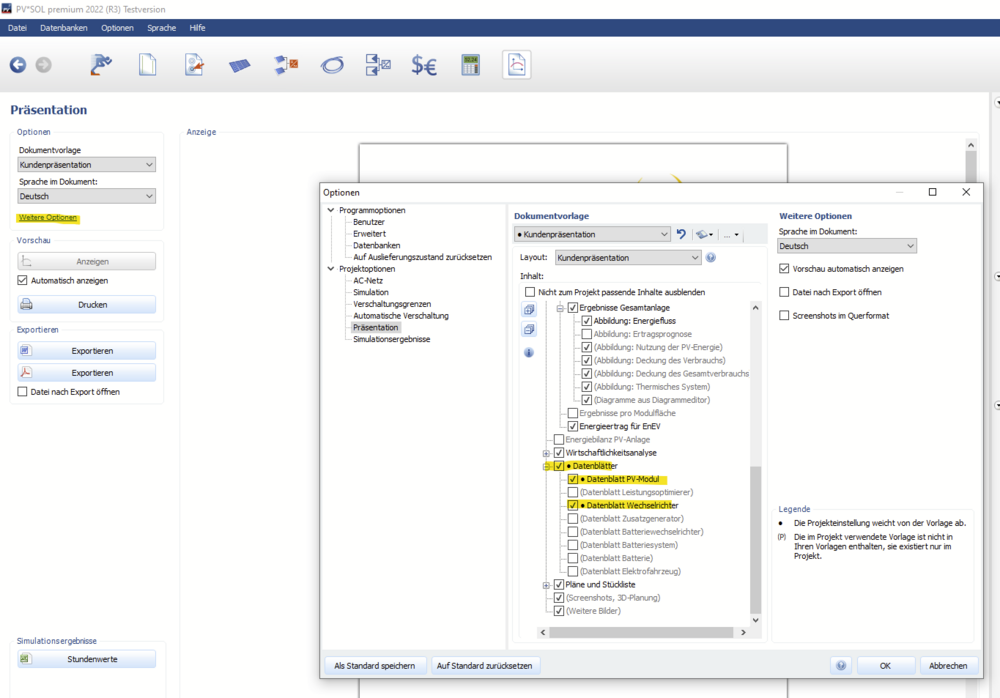
Hallo Udo, man kann einen Datensatz ausdrucken, allerdings nicht direkt aus dem Datenbank-Dialog heraus. Wenn man den Wechselrichter oder das PV-Modul in der Anlage verwendet, kann man sich die Datenblätter als Teil der Präsentation ausgeben lassen. Beste Grüße, Martin
-
Problem mit Bildschirm-Auflösung und Skalierung
developer_mh replied to Christian Dorst's topic in PV*SOL
Hallo bene-solar, am besten ist es, die Einstellungen für das Überschreiben des HighDPI-Verhaltens ganz rauszunehmen: Dann PV*SOL neustarten. Das Problem mit dem verschwindenden Kontext-Menü ist uns bekannt, es liegt leider am darunter liegenden Oberflächen-Framework von Microsoft. Wir prüfen derzeit, welche Workarounds funktionieren könnten. Viele Grüße, Martin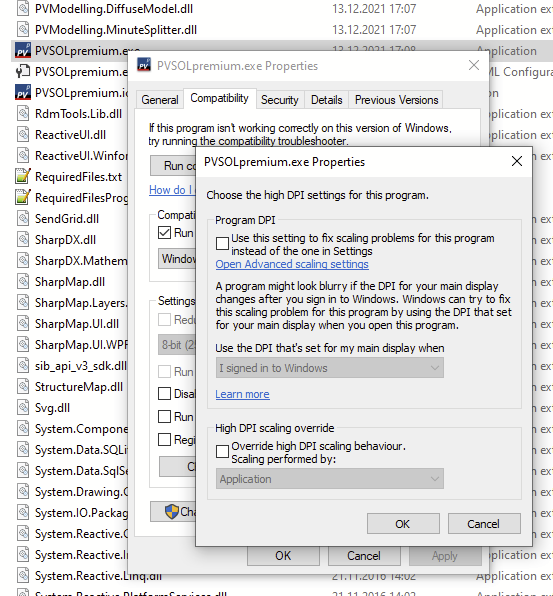
-
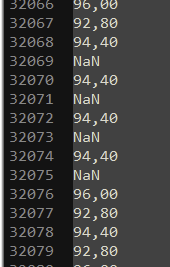
Hallo Marco, in der Textdatei gibt es Einträge mit "NaN": Das steht für "Not a Number" und führt zu den beschriebenen Problemen. Beste Grüße, Martin
-
Hallo Udo, viele liebe Grüße zurück nach Thailand! Normalerweise werden Produkte wie Wechselrichter oder PV-Module von den Herstellern in unsere Datenbank eingetragen. Am besten wäre es daher, wenn du invt kontaktierst (https://www.invt.com/contact-us), mit der Bitte, deren Wechselrichter bei uns einzutragen. Die Kontaktadresse bei uns lautet database@valentin-software.com, die zugehörige Webseite https://pvsol-database.valentin-software.com. Wir werden sie auch mal kontaktieren. Es können aber auch selbst Produkte in die Datenbank eingegeben werden. Hierzu der Link auf die Hilfeseiten: https://help.valentin-software.com/pvsol/de/datenbanken/komponenten/wechselrichter/ Das Währungssymbol wird vom Betriebssystem übernommen. Wenn es dort auf Baht umgestellt wird, arbeitet auch PV*SOL damit. Es erfolgt allerdings keine Währungsumrechnung, dh die Beträge bleiben unverändert. Beste Grüße, Martin
-
Good day Venco Gary, where do you have the data in the first table from? I didn't see it in the datasheet. The table itself is the reason for the unrealistically high value for the relative effiency. You can check that by a simple calculation. The short circuit current of a PV cell or module is (usually) proportional to the irradiance. If you have 13.83 A at 1000 W/m², you should have around 2.76 A at 200 W/m² (13.83 A * 200 / 1000). Here in the table we see 5.59 A. I would say, this is impossible. The data is erroneous. Hope that helps, kind regards, Martin
-
This is because your attachment quota is nearly full. You'll need to delete older attachments or messages in order to upload new ones.
-
Hi Jimmy, the "Maximum Feed-in Power Clipping" lets you limit the power at either the feed-in point or at the inverter output to a percentage of the installed PV power (STC). If you have PV modules with a total STC of 10 kWp installed and you set the power clipping to 70% percent at the inverter, everything above 7 kW (AC) will be cut off. Actually, if you limit the power at the inverter output, the exceeding power will not be cut off, but instead another point on the I-V characteristics of the modules is chosen so that the power limit is not hit. If you choose to clip at the feed-in point, the inverter can still output power to its own limit, say 10 kW. Then electrical appliances or a battery system or an electric vehicel can be supplied, and only after that, before feeding in the surplus PV power into the grid, we check if the power clipping limit is reached. If so, we cut the excess off. If the PV is outputting 10 kW (AC), and the consumers draw 5 kW at the same time, the grid feed-in would only be 5 kW, so no clipping would occur. If you want to limit to an AC current of 20 A, you would have to calculate the resulting power depending on the grid voltage. On a one-phase 230 V grid you can get 4.6 kW over a 20 A fuse. If you have 10 kWp of PV power installed, you would enter 46 % "Maximum Feed-in Power Clipping" at the feed-in point. Hope that helps, kind regards, Martin
-
Hi Johan, often this is caused by the file names of the textures. Be sure that there are only letters and numbers in them. If it doesn't work, feel free to send your obj file to hotline@valentin-software.com, together with a link to this thread. Hope that helps, kind regards, Martin
-
Fehler Abschattung PVSOL 3D-Objekte vs. importierte 3D Objekte
developer_mh replied to Max Berg's topic in PV*SOL
Hallo Max, ja, das hast du prinzipiell richtig interpretiert. Wäre es möglich, das 3D Modell zu bekommen? Gerne per privater Nachricht hier im Forum. Mit welchem Programm wurde es erstellt, und mit welchen Einstellungen exportiert? Danke und Grüße, Martin -
Fehler Abschattung PVSOL 3D-Objekte vs. importierte 3D Objekte
developer_mh replied to Max Berg's topic in PV*SOL
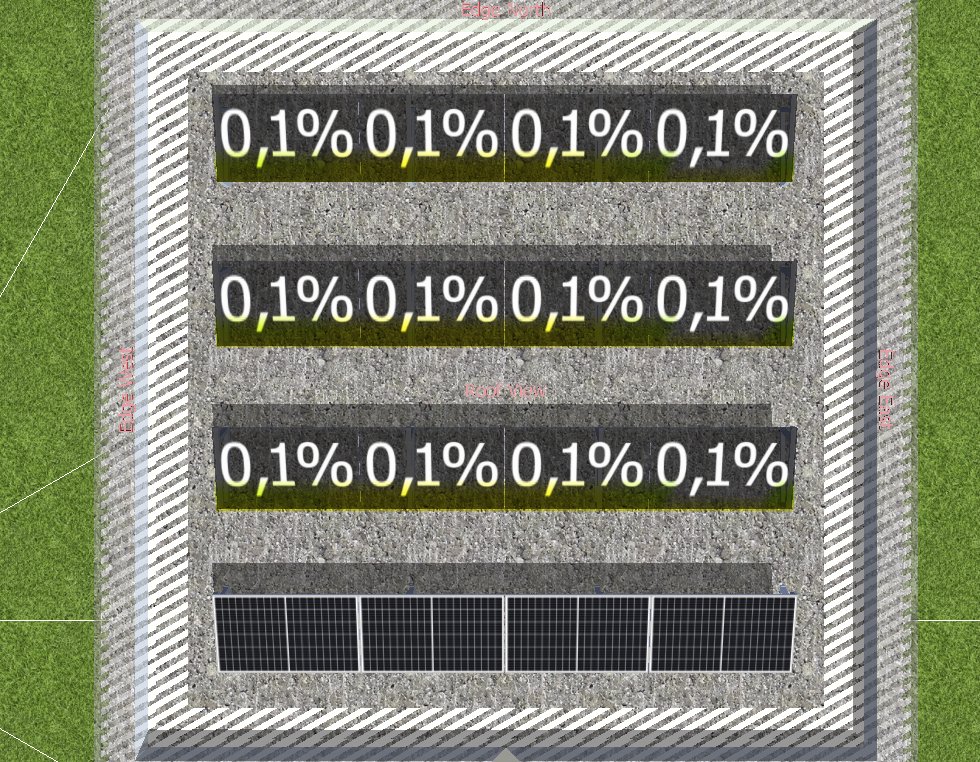
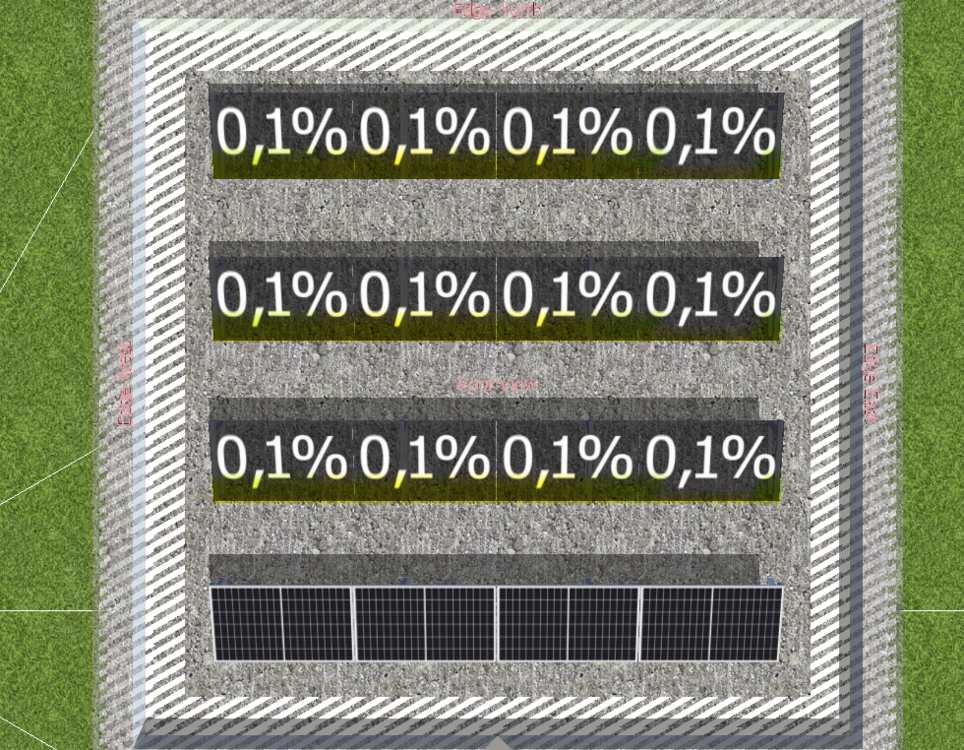
Hallo Max, schönes Vergleichsprojekt! Hierbei handelt es sich um den "Attika"-Fehler beim Import von 3D-Objekten. Wenn man die Schattenhäufigkeiten vergleicht, wird der Unterschied sehr deutlich: Der Fehler wird verursacht durch geschlossene Attikas bei importierten 3D-Modellen. Abhilfe kann geschaffen werden, indem man die Attika an einer Stelle unterbricht. Ich hoffe, das hilft weiter. Beste Grüße, Martin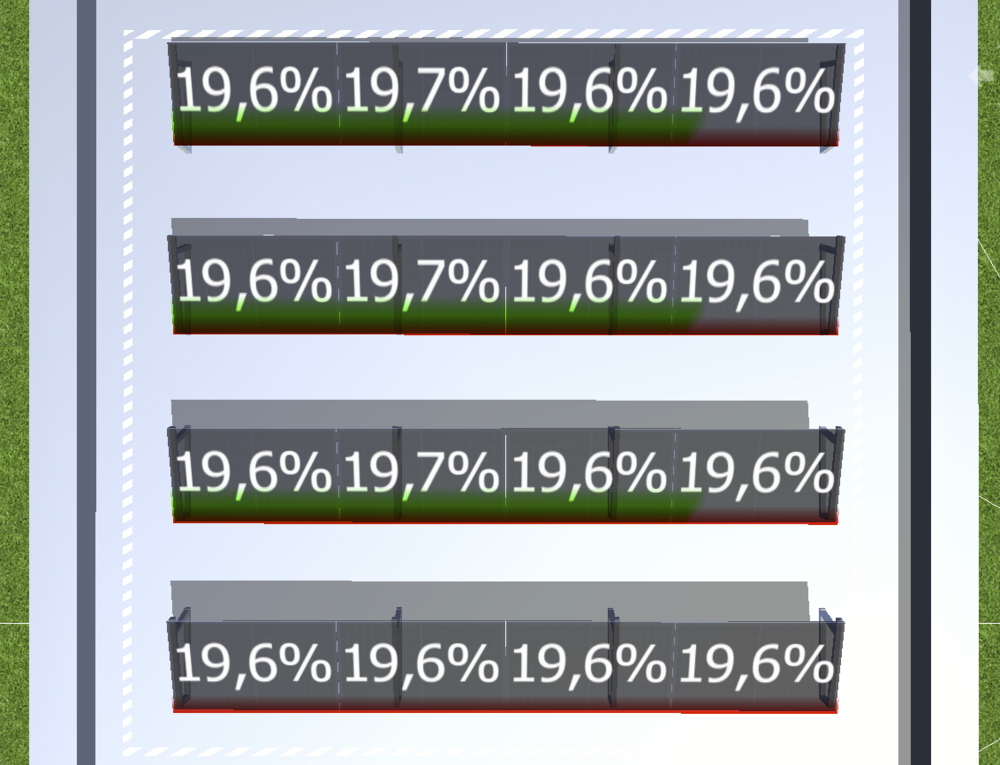
-
Hi Pablo, I am very sorry for the late answer, somehow we oversaw the question. The BIM is very interesting for us and we follow its development and adaptation in the market closely. However we can't give any schedule on when we will integrate it in PV*SOL at the moment. Kind regards, Martin
-
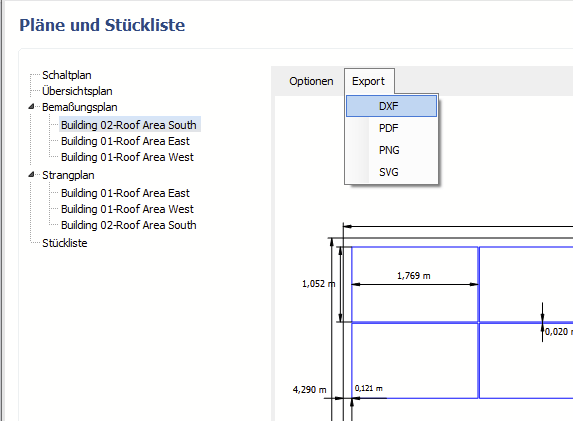
Hallo Sven, ja, es gibt einen DXF Export für die Bemaßungspläne und die Strangpläne: Viele Grüße, Martin
-
Allocate inverter to module row array independently
developer_mh replied to Gary Zhou's topic in PV*SOL
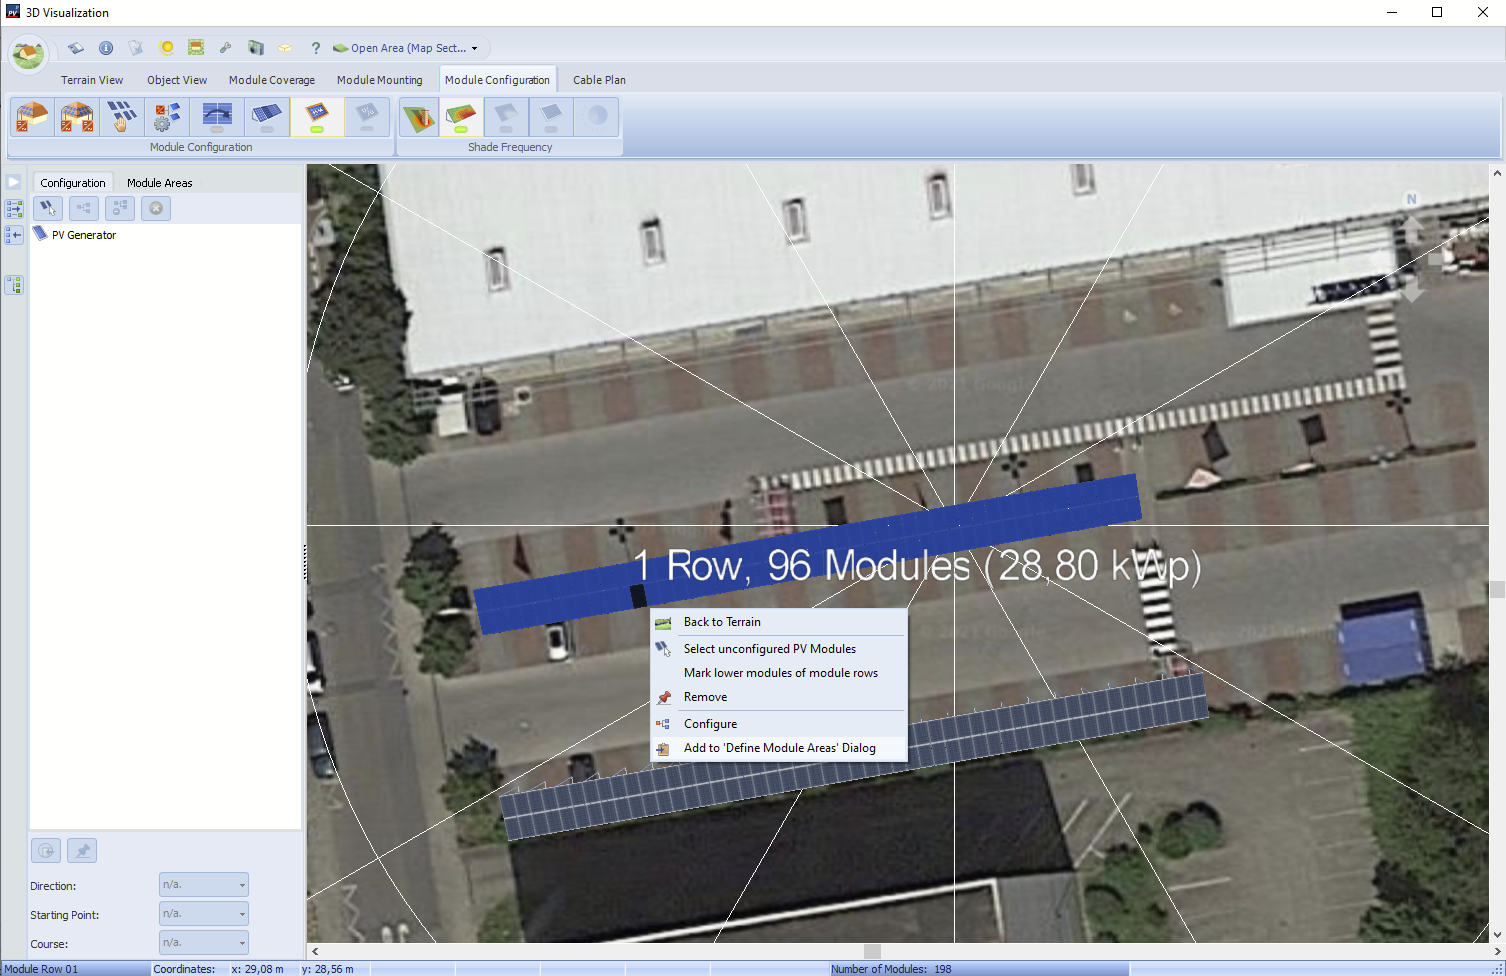
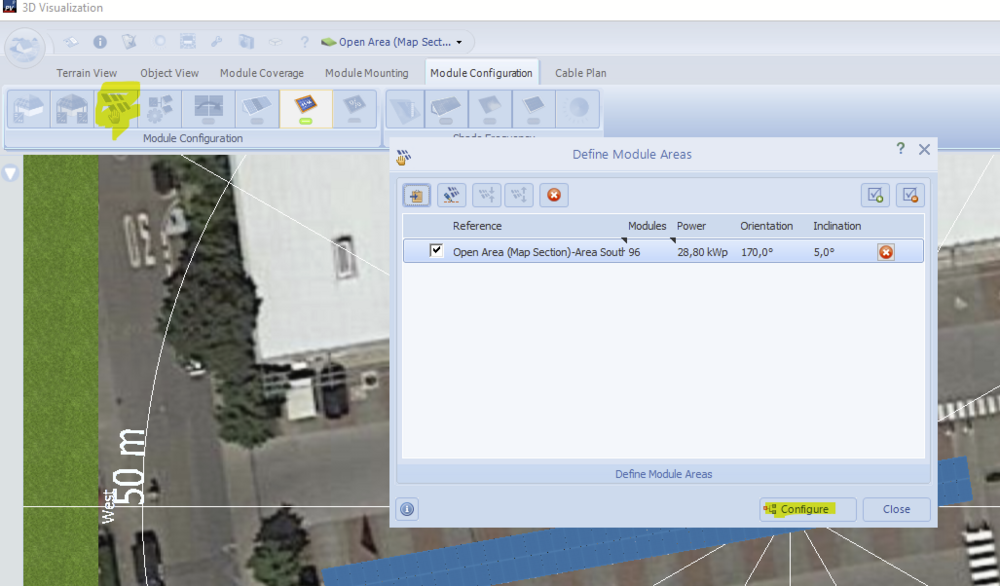
Hi Venco Gary, firstly I would recommend to delete the configuration that you have in order to start from the beginning. Then, in the module configuration tab, select the modules in area 1, right click and select "Add to 'Define Module Areas' Dialog": Then go to the "Define Module Areas" dialog and select "Configure" Like so you have configured the modules in area 1. You can proceed in the same way for area 2. Hope that helps, kind regards, Martin
-
Hi EMcSweeney, in the upcoming release PV*SOL premium 2022 R3, we will exclude the energy clipped at the feed-in point from the production cost. Hope that helps, kind regards, Martin
-
Fehlermeldung beim Start "Die Datei.... kann nicht geladen werden"
developer_mh replied to Ralf's topic in PV*SOL
Hallo Ralf, den Fehlerbericht haben wir bekommen, danke. Leider hängt kein Projekt an, mit dem wir nachvollziehen können, was der Fehler ist. Könntest du die nicht zu öffnenden Projektdateien vielleicht hier im Forum als private Nachricht schicken? Danke. Viele Grüße, Martin -
Hi John, this is most possibly coming up because you try to load a project file from PV*SOL premium in standard PV*SOL. Kind regards, Martin
-
Hi Alberto, Yes, exactly. You can't open project files from version 2022 in PV*SOL 2021. Kind regards, Martin
-
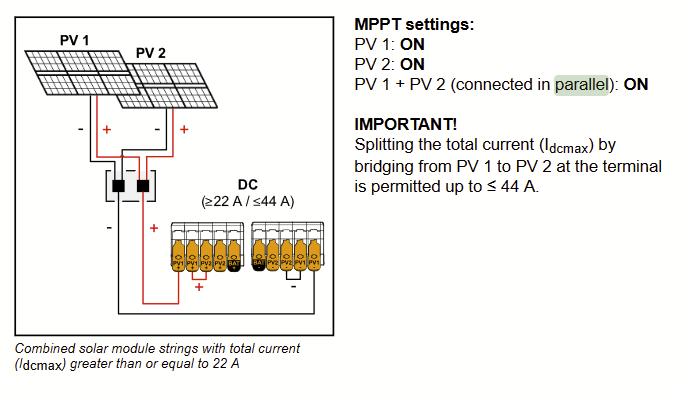
Hi Tazar, the parallel operation mode must be supported by the inverter and is defined by the installer upon installation. How exactly this is achieved will be different across inverter models, but as an example see this screenshot taken from a manual of the Fronius Gen24 inverter: Taken from here, page 63: https://www.fronius.com/~/downloads/Solar Energy/Operating Instructions/42%2C0426%2C0419%2CEN.pdf In this example, you connect your two module areas to the inverter as if they were one (only one plus and one minus cable going to the inverter, using only one DC inlet), but then, as a installer, you bridge the input on a second DC inlet. In this case, this allows for a double maximum current. Hope that clarifies the matter a bit, kind regards, Martin
-
Hi Alberto, in PV*SOL there is no concept of ownership of project files. A file that you create and send to another person should be no problem. Could you provide a screenshot of the error message? Thanks and kind regards, Martin
-
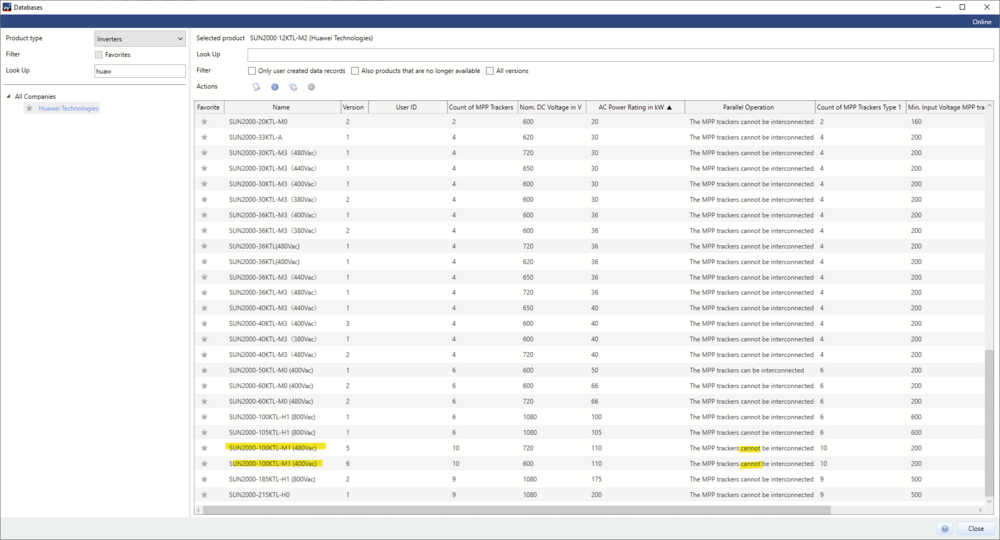
Hi Tazar, thanks a lot for the project. The inverter that you are using in that project is version 3 of the Huawei SUN2000-100KTL-M1, with the following property: I guess this was an errorneous input by the Huawei colleagues. You should use the most current version, version 6. Hope that helps, Martin
-
Hi Tazar, this is really strange. Could you do me a favour and send me the project file with this configuration? You can send it here in the forum by private message. Kind regards, Martin
-
Hi Fredrik, coudl you check if you have access to the following files: "C:\Users\USERNAME\Documents\Valentin EnergieSoftware\PVSOL premium 2021\PVSOL.ini" and "C:\Users\USERNAME\Documents\Valentin EnergieSoftware\PVSOL premium 2022\PVSOL.ini" as well as "C:\Users\USERNAME\Documents\Valentin EnergieSoftware\Installation.ini" Also check if these files are read-only or currently in use by another process or user. Hope that helps, kind regards, Martin
-
Dynamische Wirtschaftlichkeitsberechnung nach VDI 2067
developer_mh replied to Paalmo's topic in PV*SOL
Hallo Paul, in PV*SOL werden die in der VDI 2067 genannten dynamischen Verfahren ebenfalls berechnet und ausgegeben: Kumulierter Cashflow (Kapitalwert) als erwirtschafteter Überschuss der Investition am Anfang des Betrachtungszeitraumes Der Cashflow (Annuität als regelmäßig jährlich oder monatlich fließende Zahlung, die sich aus Zins und Tilgung zusammensetzt) Die Amortisationsdauer als Kapitalrückflusszeit Der interne Zinsfuß als mittlere Rendite Viele Grüße, Martin -
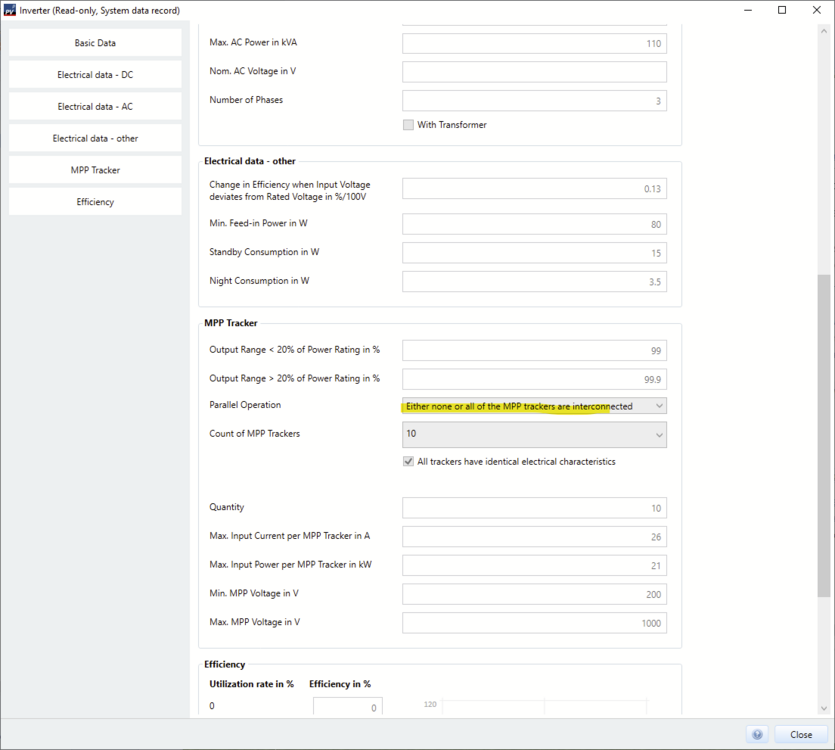
Hi Tazar, some inverters have the possibility to interconnect the MPP trackers. The inputs then share power electronics inside the inverter which can sometimes be of advantage. For instance, the allowed max current can be higher. We call that parallel operation. The Huawei SUN2000-100KTL-M1 however doesn't have that possiblity: So I don't know how you set up th examples that you mentioned. Also, if I try to connect 18 PV modules of type Jinkop JKM460M to one MPP tracker of the SUN2000-100KTL, the maximum voltage is exceeded. Could you provide screenshots of the two configurations that you want to learn more about? This would be really helpful in that case. Kind regards, Martin