Leaderboard


Popular Content
Showing content with the highest reputation since 08/22/2014 in all areas
-
1. More control when drawing lines: snap to 10cm or input to drive line length 2. Snap to mid point of line - the ridge of a roof is almost always in the middle 3. ctrl+Z to undo 4. better control when rotating the camera position 5. Higher resolution on panels when zoomed out 6. Default project image zoomed out enough to show whole array Keep up the good work PVSOL team.9 points
-
Hat schon jemand "UNDO" gesagt ?7 points
-
Good afternoon, I think it would be a good idea if Valentin software developers make a wish list in the Forum for the users so they can have a feedback of what is more important and required by the costumers/users and if they are mentioned very often try to include them in the following releases. Here are my wishes ? 1- More stand alone inverter/chargers/components brands, as Victron, Steca, Ingeteam, Solarwatt 2- Bigger area to develop bigger projects 3 - A better relation with 3D software as Sketch-up 4 - The possibility of include some images/pictures or even text in the final report (for clients would be interesting if we can include in one only document the pictures of a visit for example or special information) 5 - BIM/ifc files compatibility. Thanks for your attention. Kind regards6 points
-
As simple "ctrl Z" or undo button would be extremely nice! Greetz Johan6 points
-
Hallo, ein praktisches Feature wäre, wenn man in der 3D-Planung häufig verwendete Unterkonstruktionen Projektübergreifend abspeichern könnte. Dadurch müsste man diese bei verschieden Projekten nicht immer wieder neu erstellen. Ist hierzu etwas angedacht?5 points
-
Hallo Valentin-Software, für uns wäre es sehr sinnvoll, dass auch die Verbindungen zwischen den Modulen in einem String veränderbar sind. So könnten wir unseren Handwerkern genau zeigen, wo die DC-Leitungen auf dem Dach verlegt werden sollen.4 points
-
Idee Teilanlage als Bestand deklarieren und damit die Wirtschaftlichkeit einer Erweiterung transparent machen können. Sprich: Die Erzeugung der Teilanlage der Bestands-PV (Wechselrichter mit Module) wird zunächst von dem Lastprofil abgezogen, anschließend wird die Rechnung mit der Risiduallast durchgeführt wie gehabt.4 points
-
For us, a fixed (or at least globally adjustable) colour scale for the shade frequency analysis would be very useful. So that e.g. 5% of shading has always the same colour for every roof in every project. As it is right now, 5% or even 10% of module shading might appear as a vibrant green, just because a part of the roof (maybe even with no modules) might be shaded very strongly. Not ideal at all. This, along with an option to export these pictures with one press of a button would be very useful to our workflow. As of right now we have to screengrab each and every roof. Edit: exmple picture added.
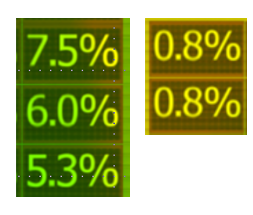 4 points
 -
- would like to see an undo button as discribed above. (or at least be able to lock a complex building and their surroundings, so one misclick doens't destroy your work) - need more options for EV. (e.g. distance travelled per week day, range according new WLTP system) - while the software perfectly suits my technical needs, it seems lackluster/old as a client proposal. - could we have a blanc page in the customer presentation where we can add project or installer specific additional information. - some presentation pages need additional (customizable) information. (while a graph or scheme or just some numbers wth a title above will be very clear for us, a customer most of the time doens't know what he is looking at) - file size of the presentation should be smaller, but pictures should still be high res. - would like to be able to send an electronic presentation to a customer with some analytics possibilities. (where do customers actualy look at?) - easier construction of "complex" buildings. (depth of building schould be addapted to the angle and dimensions of the roof area being used for the array)4 points
-
Abluftrohr als vollständiges, solides Objekt darstellen, anstatt als leerer Zylinder. Das auswählen ist sehr unpraktisch. Mit einer oberer Fläche würde es schon funktionieren, wie bei einem Kamin.
 3 points
 -
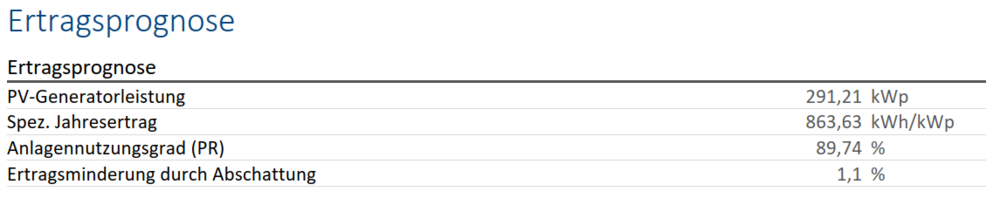
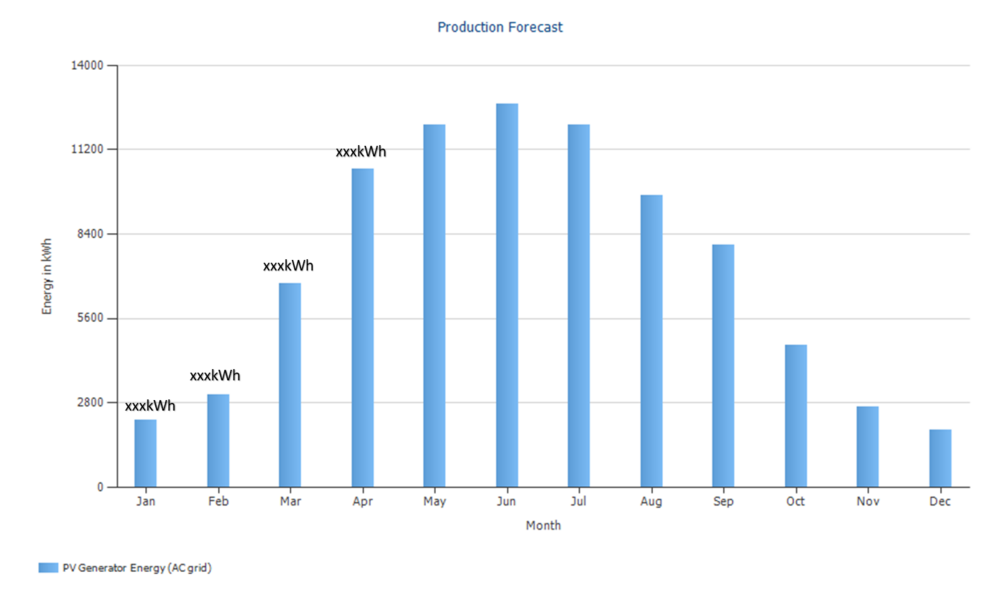
Der wird bei der Doku auf der Seite Ertragsprognose angezeigt. Hier beispielhaft (Wert ist gering, da es einen Teil Fassadenmodule gibt).
 3 points
 -
Hallo, der Import von IFC-Dateien wäre sehr hilfreich. Als Standard-3D-Austauschformat kommt dieses in unseren Projekten immer häufiger vor. Ein lästiges Nachbauen oder Umwandeln in andere bisher importierbare Dateiformate könnte entfallen.3 points
-
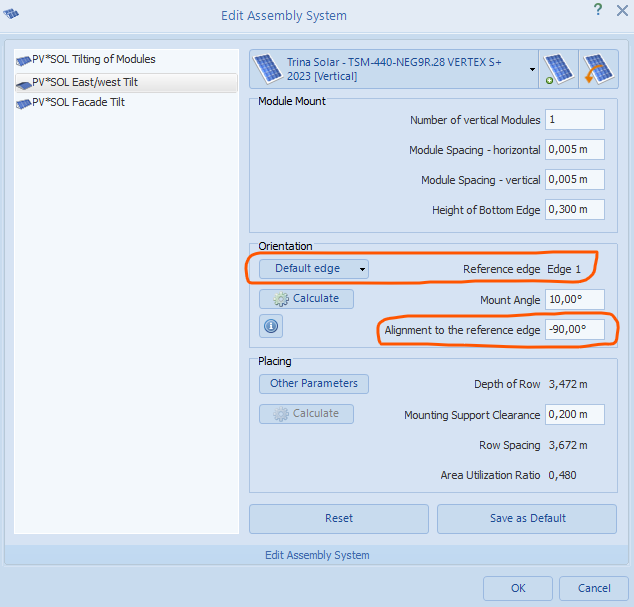
Try adjusting these two values and you will have it.
 3 points
 -
Ich bin ziemlich neu bei PVsol, aber das kann ich nur unterschreiben, die 3D-Navigation hat noch erhebliches Potential zur Verbesserung. Es fühlt sich einfach furchtbar hakelig an. Was eigentlich jedes CAD-Programm heute bietet (auch kostenlose wie z.B. Freecad): Drehpunkt der Ansicht wird vom Benutzer gewählt Wenn schon nicht wählbar, dann sollte er wenigstens sinnvoll liegen, z.B. im Volumenschwerpunkt des aktiven Gebäudes oder im Flächenschwerpunkt der Gesamt-Grundrissfläche) Beliebig weit rein- und rauszoomen Keine Drehwinkelbegrenzung, ich kann mir mein Objekt wenn ich will auch von unten angucken oder siebenmal linksrum drehen. "Autoscale" Button, um das Objekt bei maximaler Größe in die Mitte zu rücken (das kann sogar Paint) Umschalten zwischen orthogonaler und perspektivischer Ansicht In orthogonaler Ansicht sieht manches nicht so schick aus, aber es entfallen einige unangenehme Kopplungen zwischen Rotation und Translation beim Verschieben KEINE automatische Umschaltung des Blickwinkels beim öffnen einer anderen Workbench3 points
-
When rotating an object, deactivate collisions while doing so. I am often unable to rotate something because it hits another object while rotating. Also, it would be more intuitive if the object would rotate around it’s geometric centre, and not it's base point.3 points
-
Hallo zusammen, Ich sehe auch eine dringende Notwendigkeit darin, dass man Wärmepumpen zusätzlich als Verbraucher anlegen kann. Bei unseren Anlagen haben wir zu 80% Kunden, die eine Wärmepumpe haben oder planen eine anzuschaffen und ihren Bedarf in den Simulation berücksichtigt sehen wollen. Oder gibt es eine Möglichkeit das Problem zu umgehen? Würde mich über ein life hack von Valentin freuen. Gruß, Iza3 points
-
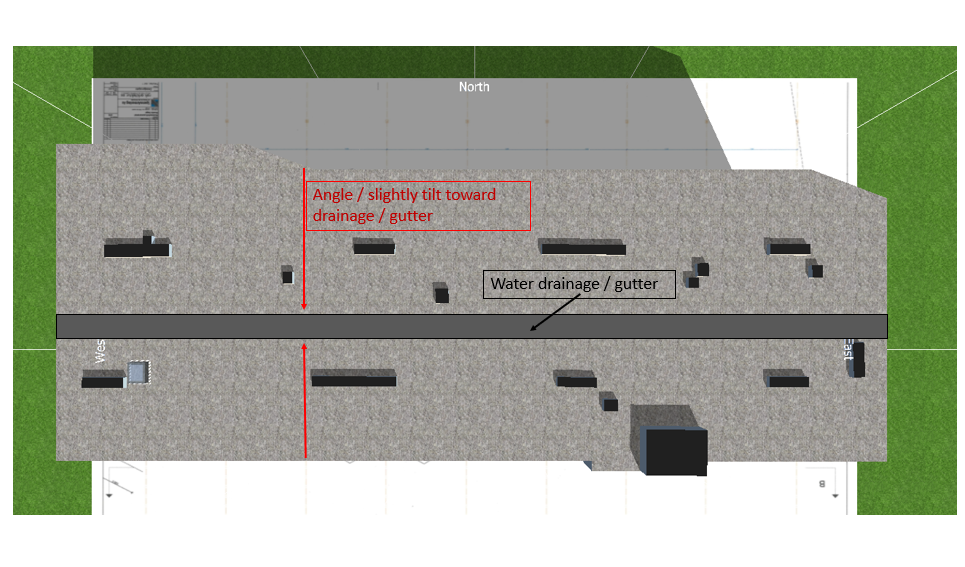
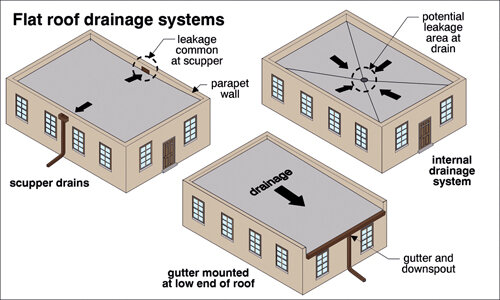
Many buildings have a lot of edges and must be drawn manually. But for these structures, it is not possible to add for instance tilting in several directions (which is possible for normal rectangular polygons that can be drawn). This is useful as most buildings have some tilt on the roof for water drainage: either with water chutes / gutter at the sides (like a gabled roof with low angle), or in the middle (opposite of gabled roof, as illustrated in the attached picture). Some buildings have several of these as well. PVSOL needs an option to add this, so that the correct incidence angle of irradiance on the PV modules is achieved.
 3 points
 -
Was ist der Unterschied zwischen Bibern und PV Sol? Biber verkraften mehr als 50 Bäume. Galgenhumor beiseite: - mein Wunsch: Begrenzungen von PV-Sol vergrößern. Ich meine sowas wie Modulanzahl, Bäume usw., das wär oft echt gut!3 points
-
Wir planen jetzt immer mehr Anlagen bei welchen ein Teil der Anlage als Überschusseinspeisung, und ein Teil für Volleinspeisung genutzt werden soll. Das bedeutet ein Dach, ein Netzanschluss, aber zwei verschiedene Vergütungen/Messkonzepte. Es wäre super wenn man dies auch in PV*Sol darstellen könnte, jetzt muss man zwei Anlagen planen, die Vergütungstaife per Hand anpassen, gemeinsame Kosten der Anlagen auf die beiden Simulationen aufteilen....3 points
-
Would be great for the Production Forecast graph to show specific kWh values each month. For example:
 3 points
 -
- Lizenzübertragung auf andere Geräte, ggf. mit Onlinezwang Ich arbeite gerade spontan notgedrungen aus dem Homeoffice mit Fernzugriff auf meinen PC im Büro per VPN wegen der Lizenz. Das ist grausam langsam und sporadisch stürzt leider auch das PV-SOL dabei mit den Grafikfehlermeldungen ab. Daher wäre es schön wenn die Lizens für einen Anwender auf mehreren Geräten laufen könnte. Es ist schwer zu erklären warum man zwei oder mehr Lizenzen für einen Anwender anschaffen soll, nur weil verschiedene Geräte an unterschiedlichen Orten durch einen Anwender genutzt werden. Da die Software beim Start sowieso nach Hause telefoniert, könnte auch der status aktiv/inaktiv protokolliert werden und bei Doppelnutzung eines Accounts der Start verwehrt werden. Oder habe ich eine andere Lösung für diese Anforderung übersehen?3 points
-
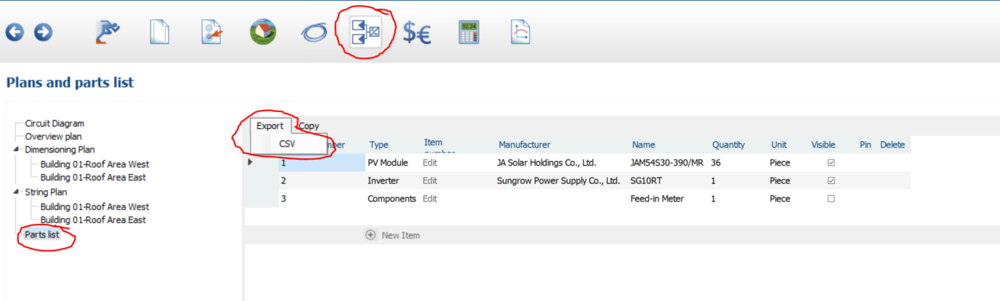
Hallo Daniel, Wenn ich Sie richtig verstehe (mein Deutsch ist nicht sehr gut, ich habe das übersetzt), möchten Sie die Stückliste in eine csv-Datei exportieren. Es könnte einfacher sein, wenn ich nur einen Screenshot zeige, wo Sie es tun. Mit freundlichen Grüßen, Jimmy
 3 points
 -
Hallo, es wäre praktisch wenn in der 3D-Visualisierung und einem geöffnetem Dialogfeld der Zoom mit dem Mausrad an der Stelle des Mauszeigers rein und raus zoomen würde anstatt an einer fixen Position. Also so, als ob das Dialogfeld nicht geöffnet wäre.3 points
-
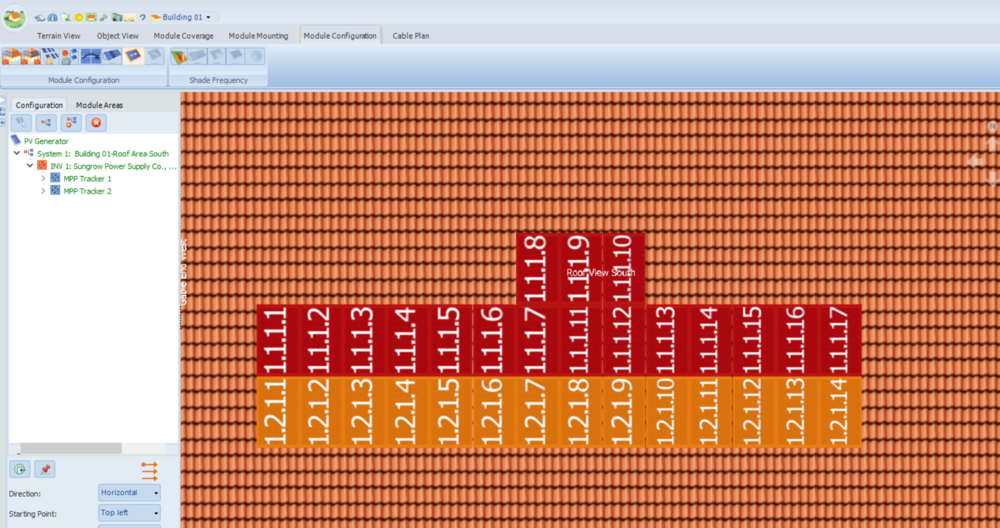
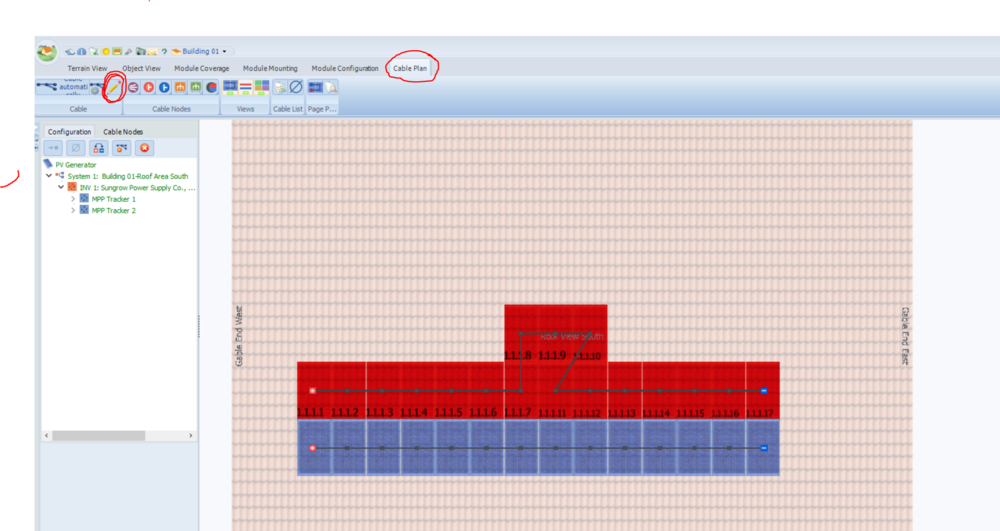
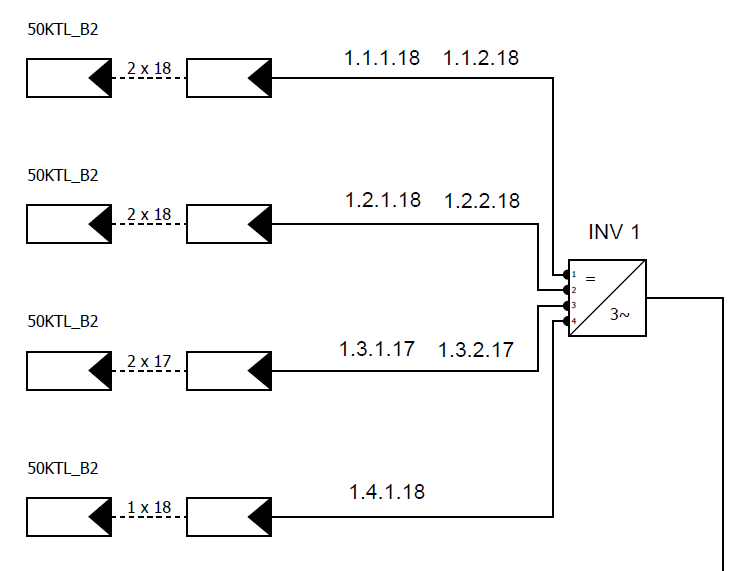
Hi Sondre. Yes. When you're in the "module configuration" view you're actually able to drag panels around. All panels are automatically numbered when you do the inverter config and they'll keep their number no matter where you move them. And the string go in order of panel number. Here's a screenshot of your desired result. An alternative method is in "cable plan" where you can use the "Sketch module cables" tool. Just select the tool and start at the first panel and draw the string going over each module in order. I prefer to move the panels in the module configuration view but I think both are equally valid.
 3 points
 -
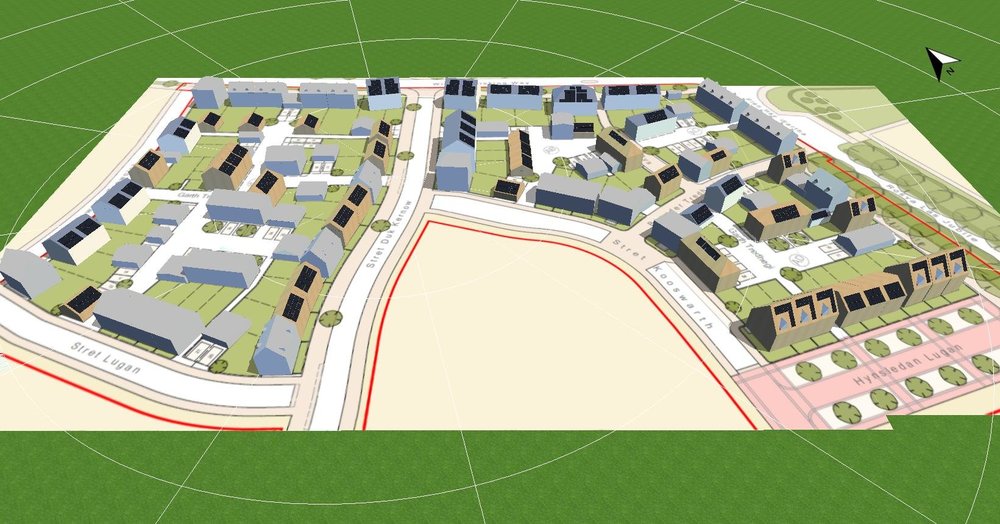
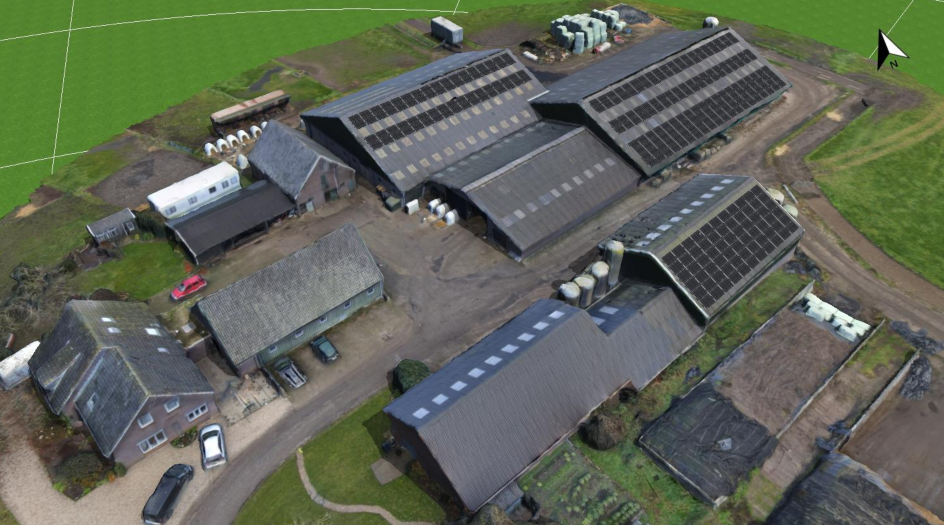
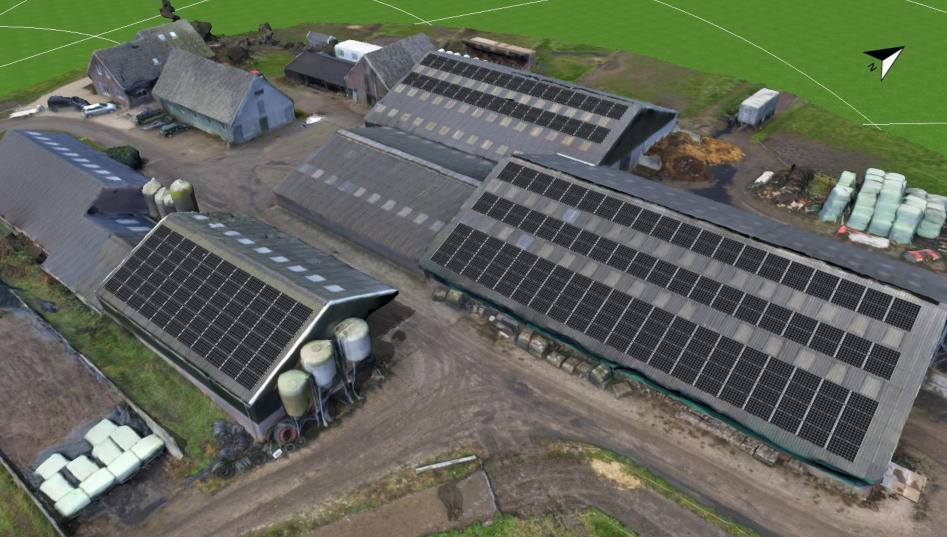
Hello everyone, please share your best image/design created with PV Sol. Why? - To show and explain the best ways to create visually attractive solar systems. This is mine created with amazing PV Sol; A new-build housing development in the UK - instead of roofing with attractive expensive Cornish slate, the contractor wants to reduce their material costs by installing in-roof panels and experiment with how 'green' they could get. We were able show the contractor thier project in PV Sol by;Importing the site plan, altering the orientation and referencing elevation plans to recreate the neibourhood. Orange buildings highlight PV systems within public view, lighter buildings highlight PV systems with limited public view, grey buildings highlight properties outside consideration. The image went down so well it was reported the contractor specially printed this at poster size to show and tell to Prince Charles of Wales.
 3 points
 -
Martin, I was genuinely thinking it was my fault the data was not being adopted, that I had done something wrong. It never crossed my mind this could be the intended behaviour by design. The logical approach (at least to me) would be to use 3D to take precise length measures and then adopt them into the 2D design. I always assumed this was the case. As it is it makes absolutely no sense at all, I can't understand why was this module designed like this, and I see it's not just me. What you're saying is that all of the trouble of designing combiner boxes, different cable sections, strings combined into arrays, etc, it all disappears into ONE SINGLE magic number. Just as @timgreen13 pointed out, one is expecting to see cable losses by section, see individual string lengths and losses, etc, because if not then what's the point of all that detailed "painting"? We need to check if individual strings and individual arrays are above our own loss thresholds, to be able to correct them if necessary. Having just one global loss number won't let you see that, you might even have 5% losses in one string branch and get 0,8% global losses in the system. Again I'm in the position of having this powerful software (PVSOL) I paid for that won't do basic functionality, and having to go back to freeware manufacturer software (SUNNY DESIGN) to get some of the design steps done. After fine tuning the strings and cable sections on SUNNY DESIGN I will have to go back to PVSOL and try to input MPPT equivalents... can you see how cumbersome this is? The more I work with PVSOL the more frustrated I get, really, it should be the opposite. You guys do the most difficult part, the math simulations, to unimaginable precision (congrats on that!), and then fail at the most basic functionality and design elements. Go figure...3 points
-
Hi Ahmad Elghobashy, the performance ratio is the ratio between the actual pv energy and the theoretical maximum pv energy. The actual pv energy is, as you have already mentioned, the "PV energy (AC) minus standby use", but the theoretical maximum is not the "Rated PV Energy", because there are already some influences on the radiation like soiling and reflection. The correct formula for the performace ratio (PR) is: PR = ("PV energy (AC) minus standby use") / (" Global Radiation at the Module" - "Reflection on the Module Interface") * module area * module efficiency )) In your case, that would be: PR = 114,960.40 kWh /[(2,041.7 kWh/m² - (- 33.13 kWh/m²)) * 414.11 m² * 0.1681] PR = 0.79594 = 79.6 % Kind regards, Marcel3 points
-
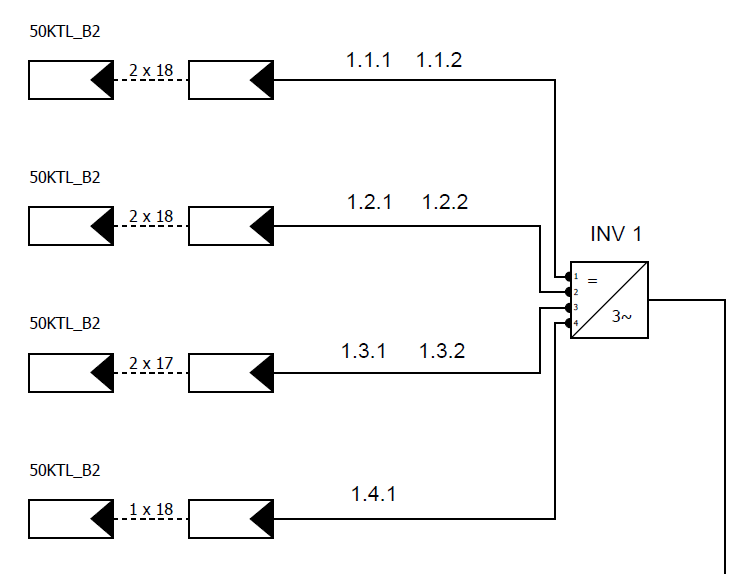
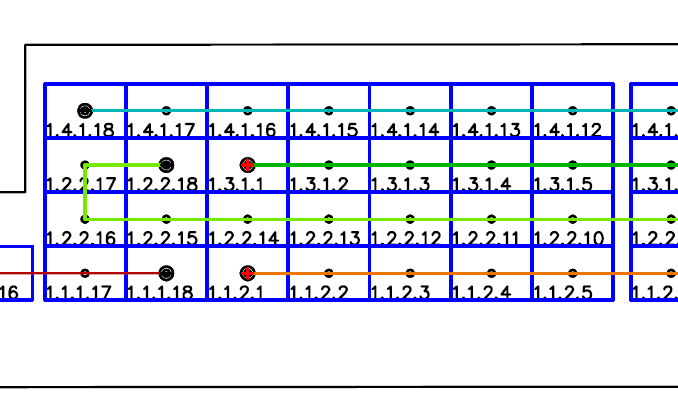
Dear Support, I have got some feedback from our technicians on site who got string plan from PVSol export. I have some requirements to improve docs to make it more readable. Please include string numbers and name of inverter in electrical plan like this: Is it feasible to change it? It is going to be clearlier. Next one is to make a bigger font on string plan like this: Your export is really unreadable for electricians. Thank you very much. Miroslav
 2 points
 -
Hi Boris, yes, no problem. You can download the setup file for PV*SOL premium 2024 R6 here: https://downloads.valentin.de/pvsol/setup_pvsolpremium_2024_6.exe You can also install R6 and R7 side by side if you choose a different installation directory. Kind regards, Martin2 points
-
Hey everyone, since there isn't much information about Intune and PV*SOL, I'd like to share some updated knowledge, for anyone in need: To Update PV*SOL you can simply run the setup file for the newer versoin on the machine with the older version. You can get the newest version here: Download Testversionen | Valentin Software (valentin-software.com) (If the License Key of the User is already registered on the machine, it will automatically run the licensed version) I've also had the issue of corrupted files, when I updated from 2024 R2 to 2024 R3. I simply fixed it by running the setup file twice on the machine. My install.cmd file which is the setup file for Intune: (Yes, it installs twice just in case) START /W setup_pvsolpremium_2024_3.exe /LANG=DE /VERYSILENT ECHO Back from setup_pvsolpremium_2024_3.exe START /W setup_pvsolpremium_2024_3.exe /LANG=DE /VERYSILENT ECHO Back from setup_pvsolpremium_2024_3.exe The Uninstall command: %programfiles(x86)%\Valentin EnergieSoftware\PVSOL premium 2024\unins000.exe" /SILENT This only deinstalls the specific version (depends on the year) inside it's path. Therefore you might want to uninstall the older version of the previous year, after the new version was successfully deployed. Detection Rule: The Developers created a text file of requiered files inside %programfiles(x86)%\Valentin EnergieSoftware\PVSOL premium 2024\RequiredFilesProgramData.txt if you want to make sure the program will run after a successfull installation, you might want to include one of these. Here are my Detection Rules: File Path: %programfiles(x86)%\Valentin EnergieSoftware\PVSOL premium 2024\ File or Folder: PVSOLpremium.exe Detection Method: File exists Associated with a 32-bit app on 64-bit clients: YES File Path: %programdata%\Valentin EnergieSoftware\MeteoSyn\meteonorm\8.2\ File or Folder: acsd_all4_mes_c.txt Detection Method: File exists Registry Path: HKEY_LOCAL_MACHINE\SOFTWARE\WOW6432Node\Microsoft\Windows\CurrentVersion\Uninstall\PVSOL premium 2024_is1 Value Name: DisplayVersion Detection Method: String Comparison Operator: Equals Value: 2024.3 Associated with a 32-bit app on 64-bit clients: YES → The Value of the Registry DisplayVersion changes with each update Dependencies: Photo Plan → automatically install To get Photo Plan to run I had to extract the MSI out of the setupPhotoPlan.exe from this Link https://downloads.valentin.de/photoplan/setupPhotoPlan.exe . Simply run setupPhotoPlan.exe and leave the Setup Window open. Afterwards you can find the Photo Plan.msi File in %localappdata%\Temp . Now you can package a Win32 App with the Photo Plan.msi as the setup file. Intune will fill out the remaining fields automatically. Reminder: If you mix Win32 Apps and Line-Of-Business-Apps in your ESP, Autopilot might fail. Have fun !2 points
-
Eine Wärmepumpe zusätzlich zur netzgekoppelten PV-Anlage mit elektrischen Verbrauchern, Elektrofahrzeuge und Batteriesystem hinzufügen zu können, wäre sehr wichtig. In der Auswertung sollte dann ersichtlich sein, wie viel kWh die WP von der PV über das Jahr unterstützt werden kann. Danke und Gruß Patrick2 points
-
Hi, sorry for re-heating the topic I have found a solution taht might help you with this. To produce 3d terrain I used SketchUp (geo location) it takes 30 seconds to produce as per this yt video https://www.youtube.com/watch?v=8jyc2CFolKY then you export it to .obj In pvsol in 3d you can simply add it if you use .obj instead of .3ds than it will save scale as well, from that point once you add it all you have to do is check box to say it is terrain model and you good to go Edit 02/08/2023 fixed scale of ground texture2 points
-
It would be nice to have a measuring tool. That is, "a ruler" tool to check different distances that cannot be found from object information.2 points
-
Hi reebal, nein, das ist derzeit leider nicht möglich. Wir haben das schon einige Zeit auf der Liste, aber zur Zeit kann ich leider keinen Ausblick geben, wann wir das Feature implementieren werden. Beste Grüße, Martin2 points
-
Hi Patrik I am using a DJI Mavic 2 enterprise and take a lot (>100) of overlapping pictures. Than I use WebODM to create a 3D model after that you need to clean up the model with Meshmixer for PV*Sol usage. For my purposes these 3D models arre sufficient. Greetz Johan
 2 points
 -
Hi chudy14, if it only for illustration purposes you could try to increase the limit of the maximum allowed number of modules. Close PV*SOL, open the ini file ("C:\Users\USERNAME\Documents\Valentin EnergieSoftware\PVSOL premium 2023\PVSOL.ini") and locate the line that says <MaxAnzModule>10000</MaxAnzModule> Try to change the value to a higher one and then re-open PV*SOL. Keep in mind that you may run into performance issues, but sometimes it works (depending on the machine and the actual project). Hope that helps, kind regards, Martin2 points
-
Hallo Akram Ich versuchs mal: Die Einspeisung kannst du nicht entfernen. Der Grund warum "nur" 40% der erzeugten Energie für den Eigenverbrauch verwendet wird ist, weil zum Zeitpunkt der Erzeugung schlicht nicht mehr selbst brauchen kannst. D.h. Tagsüber wenn die Sonne scheint erzeugst du mehr als du zu diesem Zeitpunkt selbst verwenden kannst. Und dieser Überschuss geht dann als Einspeisung ins Netz. Mindestens theoretisch könntest du ohne Einspeisung arbeiten wenn du immer weniger Erzeugen würdest als du selbst verbrauchst, in der Praxis ergibt das aber keinen Sinn. Viele Grüsse Oliver2 points
-
Hallo, danke für die Möglichkeit, Wünsche anzubringen. Hier meine Wünsche: DRINGEND: - IFC- oder REVIT-Import!!!!! - Performance Berechnung - Nutzung von mehr Ressourcen des PCs (CPU 15%, GPU 1%, RAM 30% -> Rechendauer >>100 Minuten) - Module tauschen ohne Verschaltung zu ändern - Balkone mit Möglichkeit für PV-Montage - Verschattung automatisch in Präsentation / Dokumentation einfügen Weiters: - Navigation in 3D-Ansicht verbessern - Gitternetz zur Ausrichtung einzelner Module / Modulflächen untereinander - Auswertung von Teilanlagen auch bei Polystring-Verschaltung - Inhaltsverzeichnis bei Dokumentation und Präsentation, mit Verlinkung im PDF - Info über geplante Verbesserungen und deren Priorität (zB im Reiter Hilfe->Info)2 points
-
Hello, I Have checked compatibility** from Enphase IQ-7A-72-2 with *SPR P3 385Wp panel. It says it is possible till 15A max. (Panels* are 10,63A Rated Current*** (Impp) & 11,3A Short-Circuit Current (Isc) (+/−3%). **https://www4.enphase.com/nl-nl/compatibiliteit-micros#results But in PV Sol after 10,2A it refuse to accept this combination. I know why this happen. Because the small letters from enphase datasheet: ""3. Maximum continuous input DC current is 10.2A."" Strange that Sunpower sells this combination with garranty.... how? And i cannot select this combination after copy this inverter and adjust limit settings in PV Sol from ***10,2A to 11A. First i thougt it was a fault in PV Sol. But now i see it is because the Enphase specs. I will contact them. Now PV sol will not suggests the Enphase micro inverter. Just someting to share. Where sometimes it gets stuck in work preparation. Regards, Martijn (OTG.energy)2 points
-
Hi Mihail, This is, as far as I know, a sparsely reoccurring issue for some users and the topic is raised every few month from users. I've had this issue myself in the 2019 version but then it got better and never happened again. Anyway, the fix that worked for me and seems to fix it the best is here (basically run as admin and select high DPI settings):2 points
-
Hi Turtles, Unless you need a good graphical presentation for a customer the easiest way would probably be to create a custom system in "module mounting". So basically a ground mount with the desired dimensions being pre calculated to a certain number of panels. Like this:
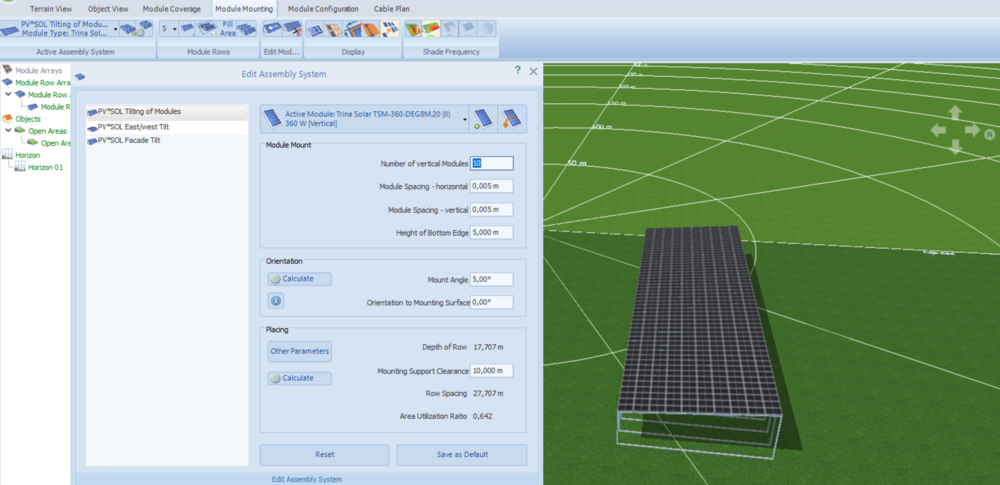 2 points
 -
HI Jimmy, yes this is possible. Please refer to this thread here: Kind regards, Martin2 points
-
Hi Robert, Unfortunately it isn't directly. But you can use a virtual machine to emulate windows which then can run PV*SOL. Here's a post asking the same with a developer response.2 points
-
Hi Marin! Regarding your number 2, I imported a terrain model (I have no need for this myself at the moment, just wanted to try it) and got it to work kind of good in 10 minutes. I'm sure that someone else can make this much better than what I have done in this mock-up. Just wanted to show that it's possible to do and that it may be easier than step #2 if the environment is complex.
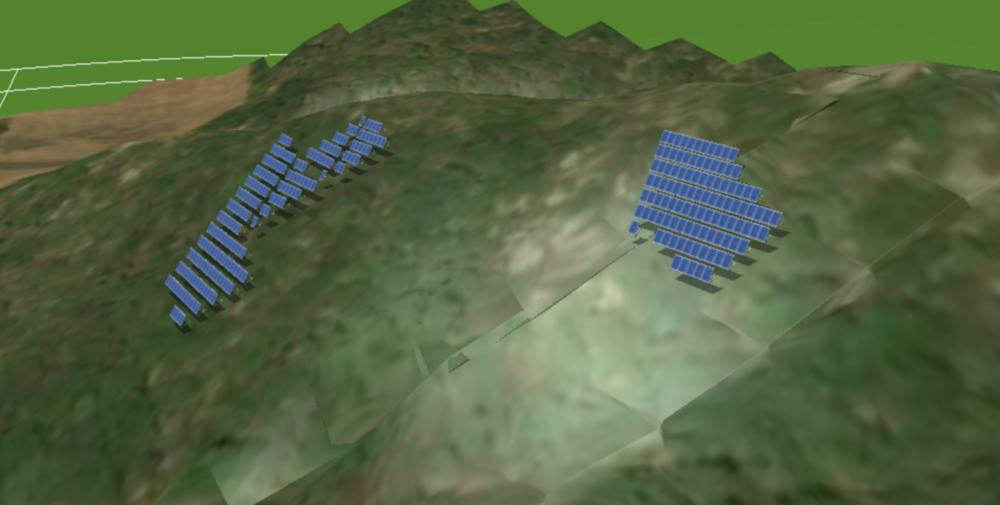
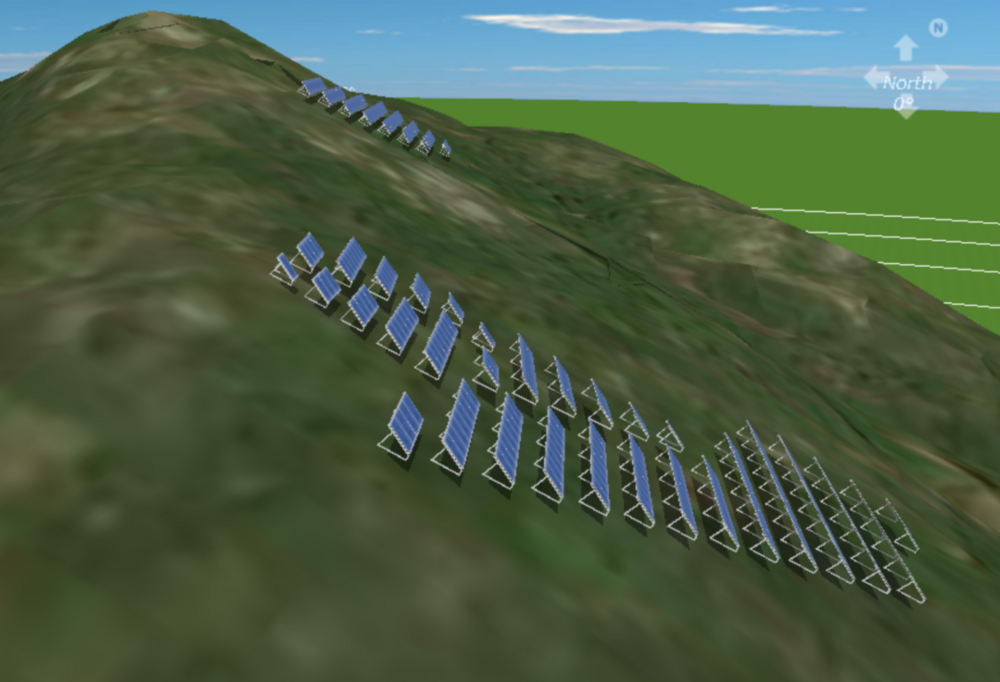 2 points
 -
If anyone else have this problem, I fixed it by exporting the Blender model as an .obj file. Thank you.2 points
-
The first point mentioned by Jon is an issue since back in 2013. And also the lack of the 3-D-Rotation is definitely not state of the art anymore. Especially for a program with a 4-digit-price. The software maybe was good in the 2000's, but today, 10 - 20 years later? Compare the value-for-money-ratio with AutoCAD or MatLab - PVSol's price is way too high for what is offered. The only good thing is the incredible database - but for somebody like me, travelling a lot and therefore often having problems connecting into the internet, the new policy with only online-database is now getting a pain in my furthest backward part. Overall I believe they are on a quite good way of loosing pace if they don't get into refurbishing their software and marketing policy. My only hope are people like you and me - explaining their needs and hopefully be understood as constructive critcizers.But to be honest... If the way they handled my requests on phone reflects their attitude, I have considerable doubts about helpful progressive changes.2 points
-
Dear Remu, there are a whole lot of reasons why simulation results differ between PVGIS and PV*SOL. 1. The climate data used is different. Most of all the irradiation data, which has the strongest influence on the results. The standard in PV*SOL are climate data from Meteonorm, while PVGIS uses its own compiled climate data. See these forum threads here: 2. The simulation models (and even the simulation approaches) are completely different. We follow a time-step based approach (in one-hour or one-minute intervals) that is simulating very accurately the irradiation on module, their temperature, shadows and so on, the electrical generation inside the PV module (with the two-diodes model), the interconnection of various modules and the superposition of their IV characteristics, the inverter behaviour, grid behaviour and what not. PVGIS is following a factor based approach, as you can read in their documentation. In the example you posted here, they just apply a loss factor of 15% to the results and that's it. I'd say, PVGIS is more a tool for a first good guess of the energy yield of a PV system. They do a really good job in integrating meteorological data from various sources, and the web interface is superb. You can click very easily on every point in Europe and see how much a average PV system would generate. PV*SOL is more a tool for designing and simulating PV systems that you are really going to build in real life. You can select real world PV modules, inverters, choose and modify their configuration and so on. You can't really compare the tools, as the scope and the input data used are so different. If you want to dig deeper in our simulation models, have a look here: https://help.valentin-software.com/pvsol/2020/calculation/ Here is also a link to the documentation of PVGIS: https://ec.europa.eu/jrc/en/PVGIS/docs/methods Hope that helps, Martin2 points
-
The topics of the webinar: - On-Grid system - with net metering and electric vehicle - MeteoSyn - Load profiles - Photo Plan, Roof view - Polymorphic configuration and power optimizers2 points
-
Dear Bernard, unfortunately this is not directly possible, no. But you could do the following: copy the data of the horizon line table to the clipboard, paste it in Excel subtract 180 from the azimuth values copy both azimuth and height values to a text file use space as a value separator save the file as *.hor Of course this would only include the horizon line and no near objects. May I ask the use case for the hor-export function? Perhaps we should consider implementing it in the future. Thanks, Martin2 points


.thumb.jpg.eb078af7709ed2f271b7d72c0f931a9a.jpg)