hotline_oh
-
Posts
649 -
Joined
-
Last visited
-
Days Won
39
Everything posted by hotline_oh
-
Dear J. Esteban, Thank you for your inquiry. Unfortunately, this is not possible. We will forward your suggestion to our development department.
-
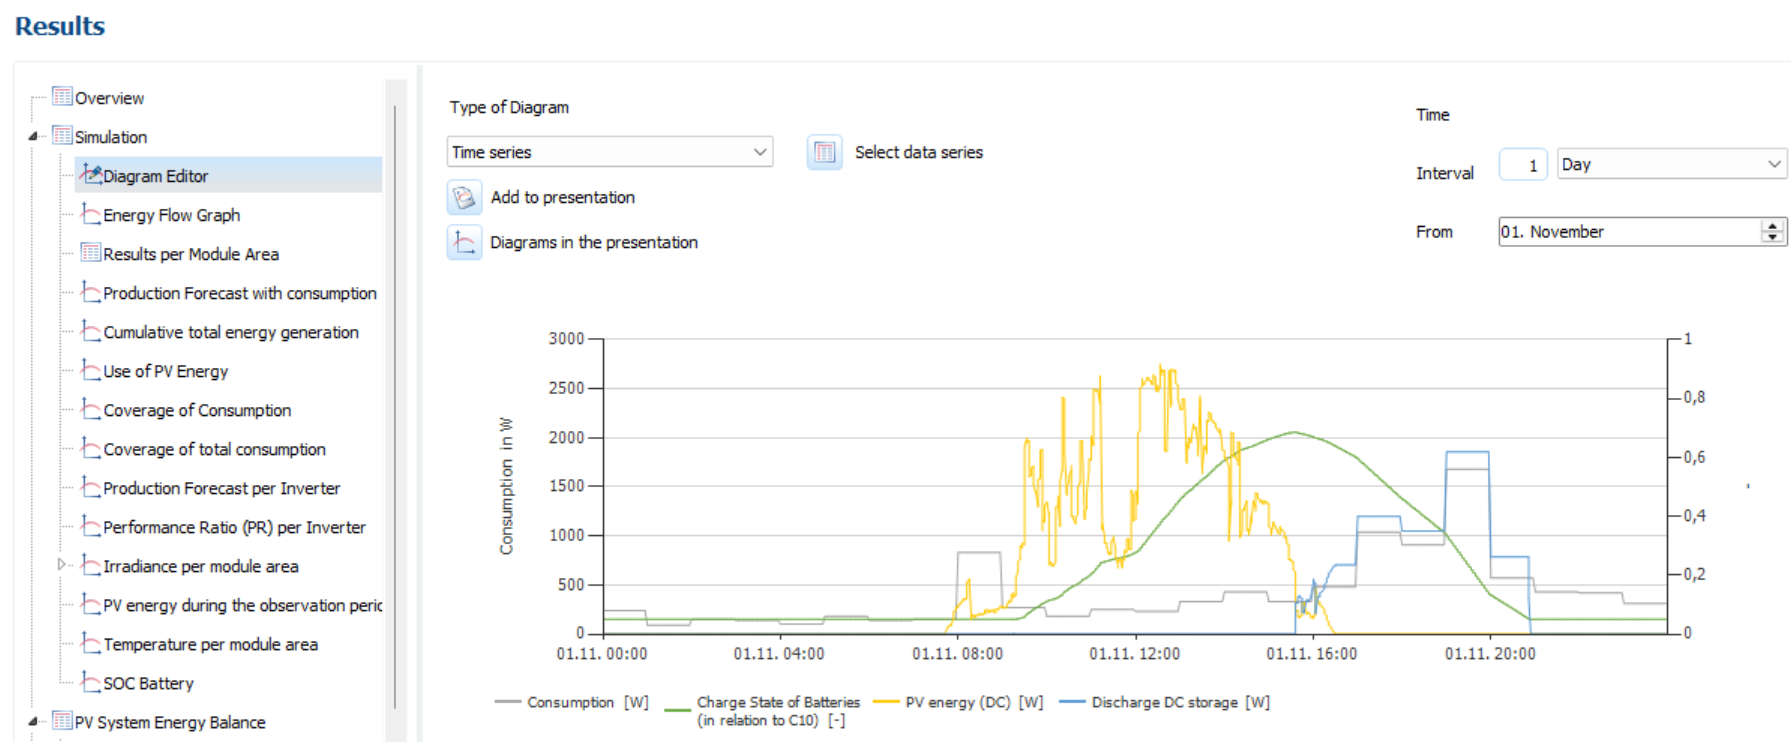
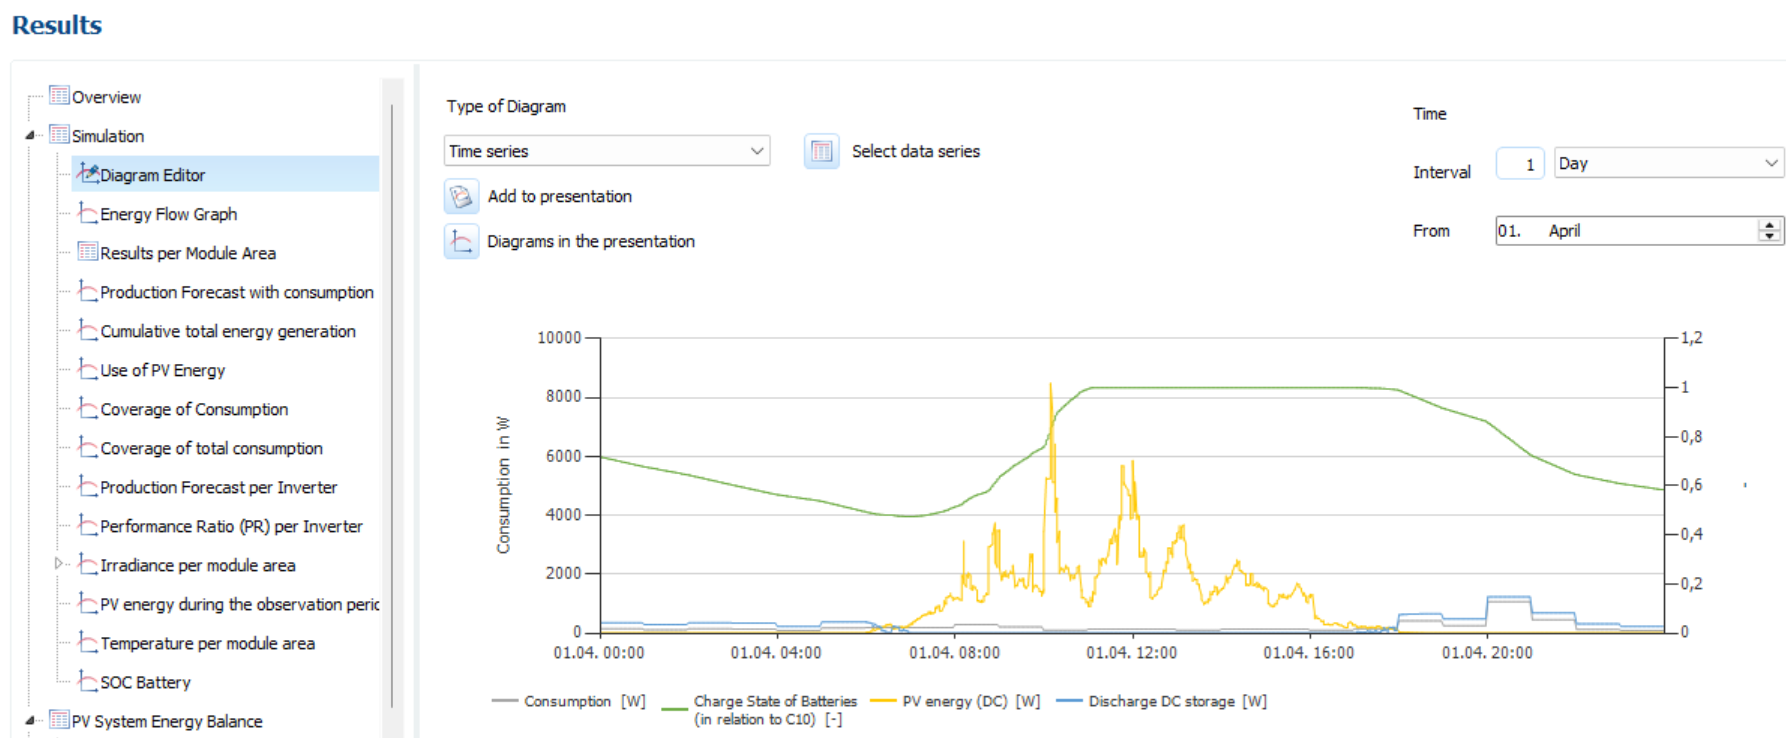
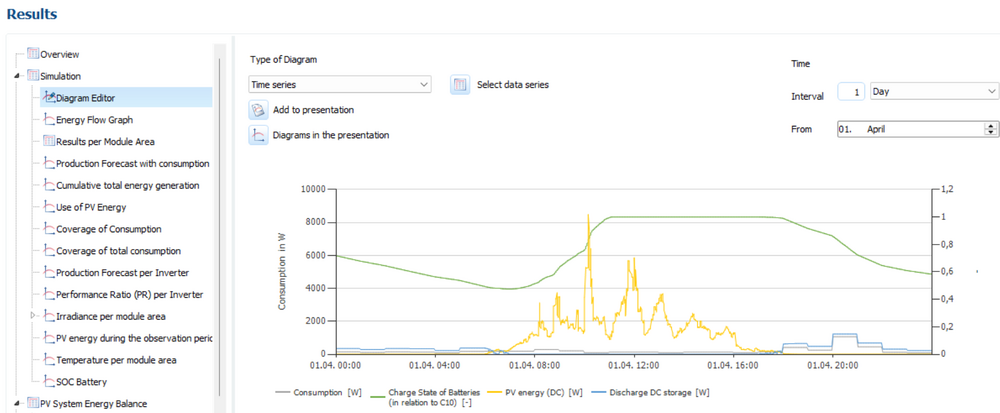
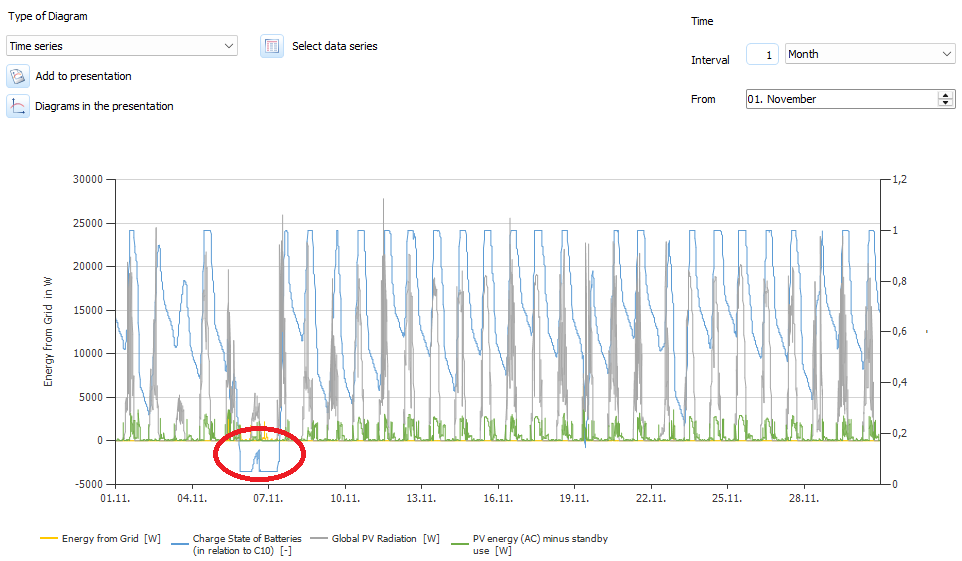
Dear Anders, Thank you for your inquiry. Average night consumption depends on the season and the amount of sunshine. The best way to visualize this is in the diagram editor of the sample project you sent: In April, battery discharge begins around 6 PM and ends around 7 AM the following morning. This is the night consumption that the battery can easily cover in April. In November, however, battery discharge begins around 4 PM. The battery is discharged around 9 PM. The night consumption must be covered by the grid until approximately 9 AM the following morning.

-
Dear Anders, Thank you for your inquiry. PV*SOL is planning software for designing PV systems, so unfortunately it is not possible to design a battery-only system. We will pass on your request to the development department.
-
Dear Nils Torbjørn, Thank you for sharing the project file. Unfortunately, we cannot reproduce the problem and we do not know the cause of the error. Updating the graphics card drivers might help.
-
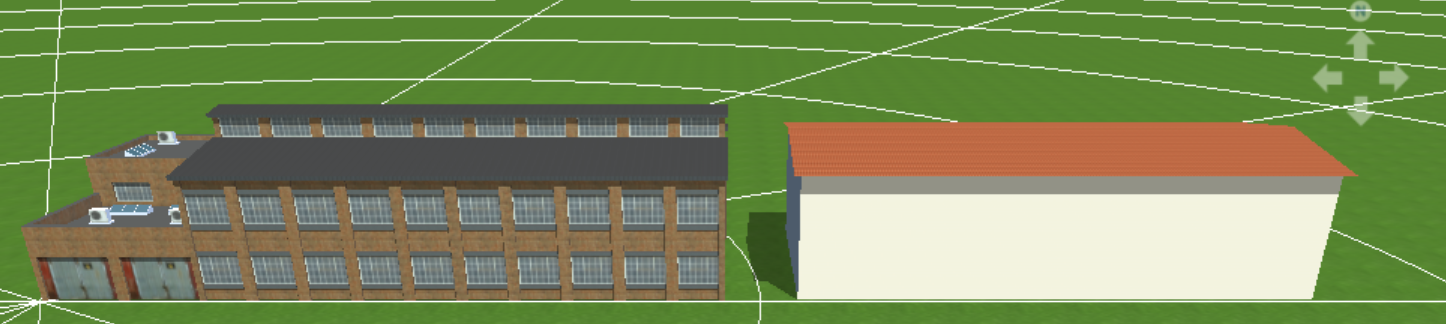
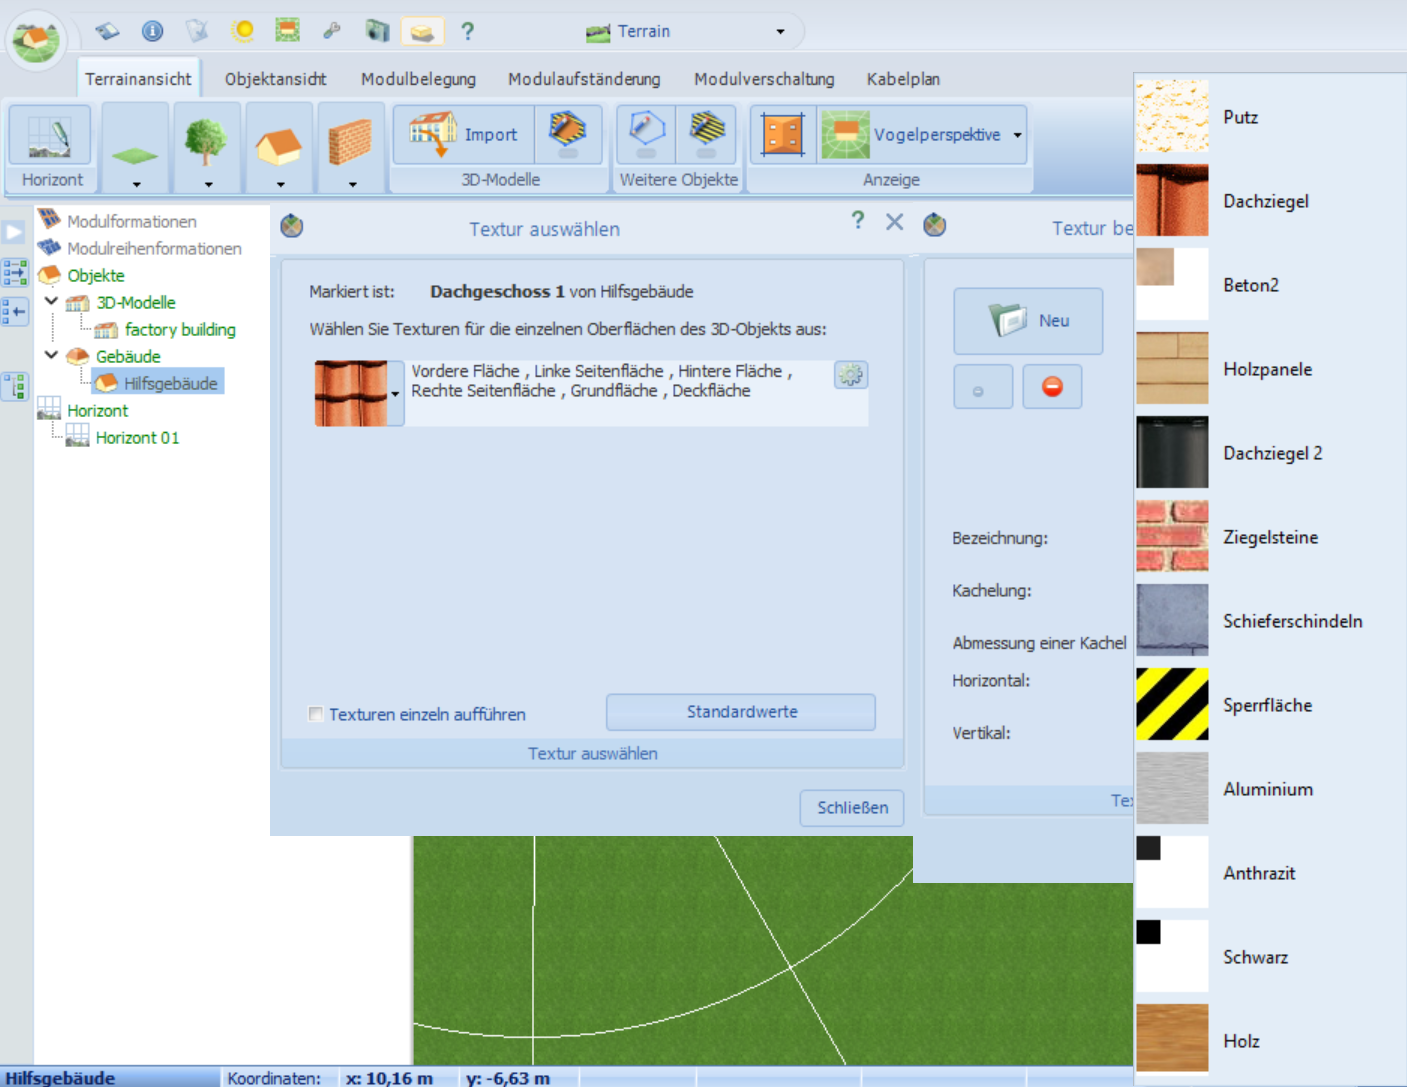
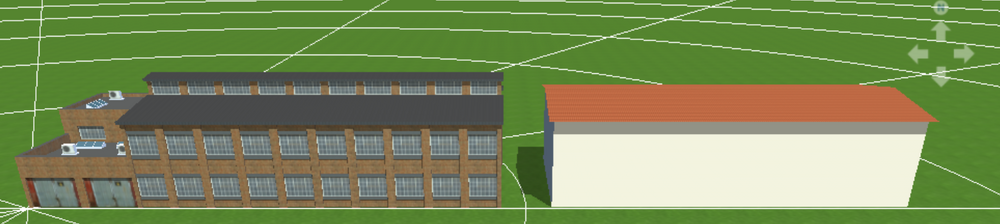
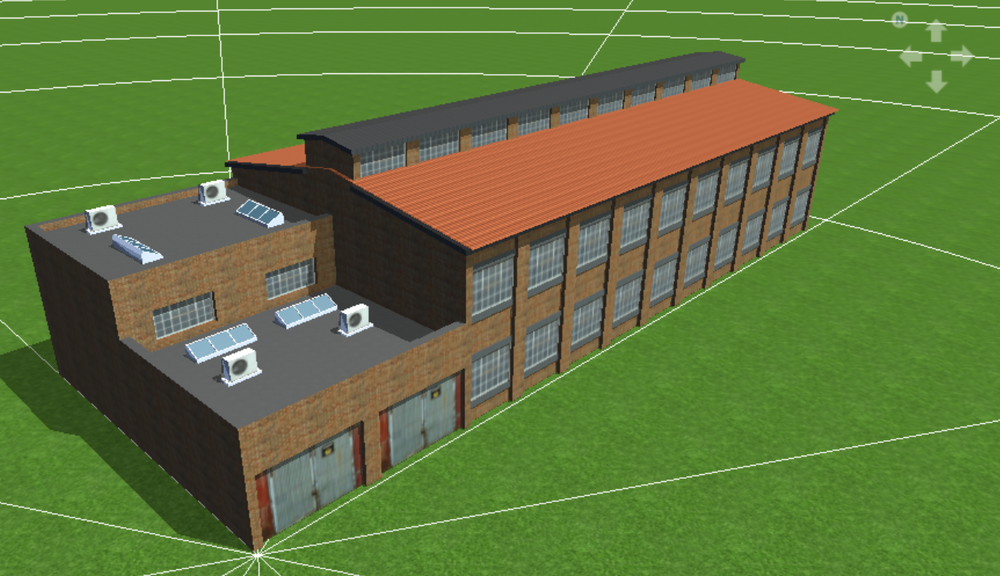
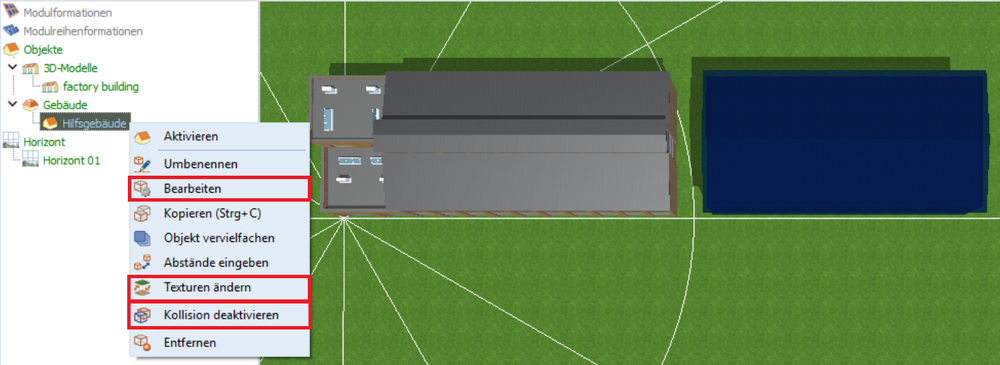
Hallo Sigi, vielen Dank für deine Nachricht. Für ein importiertes 3D-Modell kann in PV*SOL nachträglich nur der Maßstab, die Position und die Ausrichtung verändert werden. Eine Änderung der Textur ist leider nicht möglich, das muss vor dem Import in einem Bearbeitungsprogramm für 3D-Modelle gemacht werden. Falls dein Gebäude nicht allzu komplex ist, kannst du folgenden Trick probieren: Ziehe ein vorgefertigtes 3D-Modell auf deine Fläche, passe die Maße dieses 3D-Modells an die Maße deines importierten 3D-Modells an (Rechtsklick --> Bearbeiten) und deaktiviere die Kollision (Rechtsklick --> Kollision deaktivieren). Anschließend kannst du beide 3D-Modelle ineinanderschieben. Für das vorgefertigte 3D-Modell kannst du die Textur ändern (Rechtsklick --> Texturen ändern). Hier kannst du aus verschiedenen Materialien auswählen oder auch deine eigene Textur hochladen: Und nun sieht es so aus, als ob dein importiertes 3D-Modell eine neue Textur hat: 3D Mesh Import - changed texture VAL.pvprj

-
Hallo Sigi, vielen Dank für deine Nachricht. Leider wird es in der aktuellen Programmversion diese Funktion nicht geben. Wir arbeiten an einer neuen 3D-Umgebung, dort werden Kabelpläne uneingeschränkt nutzbar sein. Die Fertigstellung der neuen Programmversion wird aber noch etwas dauern.
-
Dear Zdena, Thank you for your inquiry. Unfortunately, there is no way to deactivate the space heating. Your only option is to select heat pump system number 2, enter a very small heated usable area of 1 m², and check whether this generates plausible results for hot water preparation.
-
Dear Zdena, Thank you for your inquiry. Cascade systems cannot be modeled in GeoT*SOL, and there are no plans to implement them in the near future. The simulation of a heat pump cascade can be approximated by multiplying the parameters. Other customers are certainly doing it this way.
-
Dear Nils Torbjørn, Thank you for your inquiry. Please send one of your project files (*.pvprj) to hotline@valentin-software.com, so that we can take a closer look at it.
-

Export von PV*Sol zu K2 Base aber falsche Adresse und Kundenname
hotline_oh replied to Eduard J.'s topic in PV*SOL
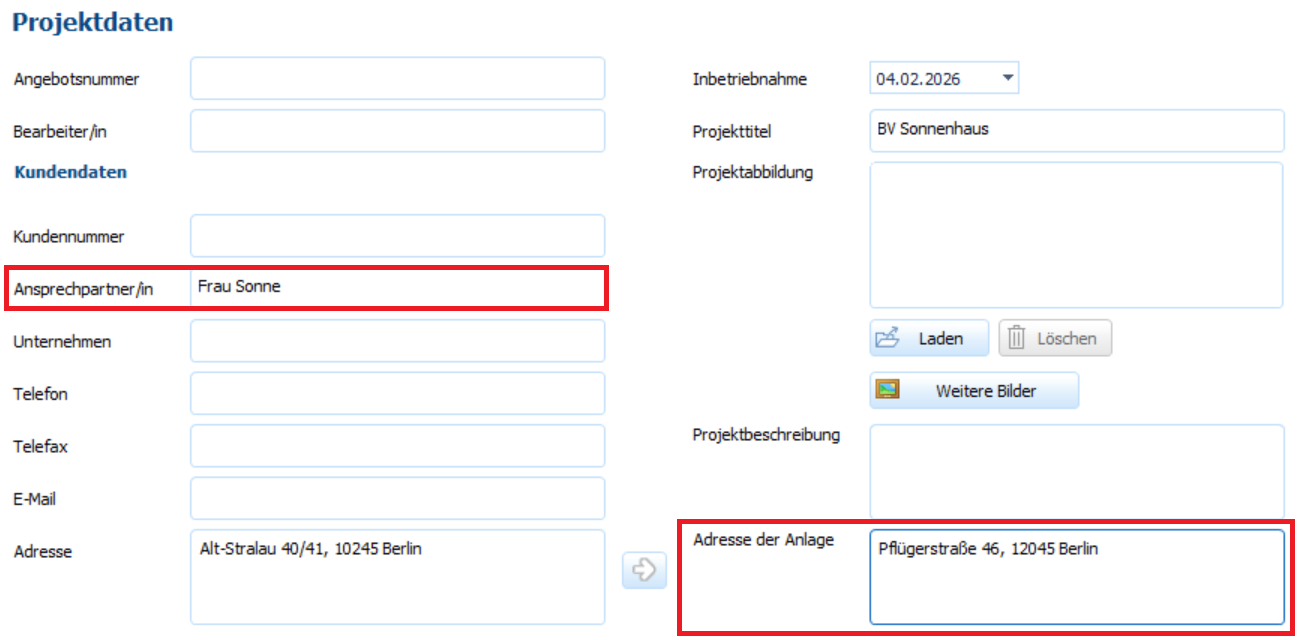
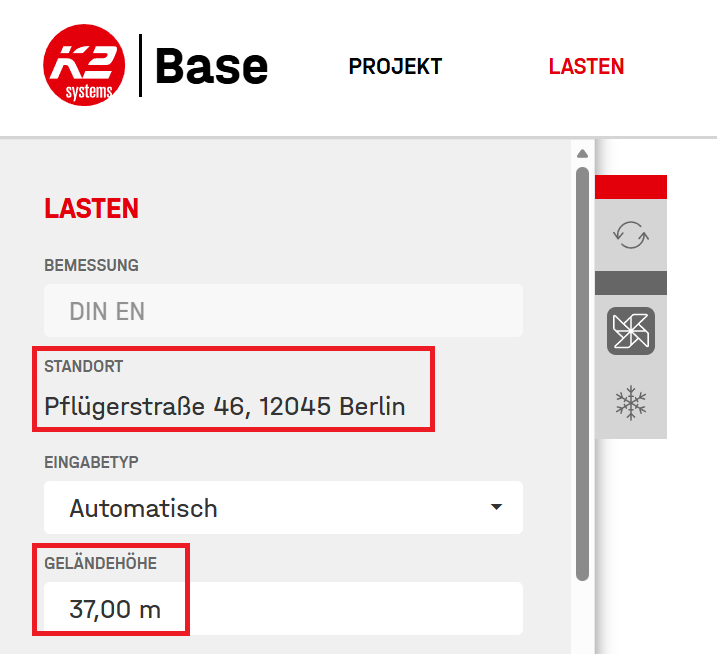
Hallo Jakob, vielen Dank für deine Anfrage. Mit welcher Programmversion arbeitest du? Das oben beschriebene Problem wurde behoben. Beim Export von PV*SOL premium 2026 zu K2 Base wird (von der Seite "Projektdaten") der Name des/der Kund/in sowie die Adresse des Anlagenstandorts übernommen: Welche Geländehöhe übergeben wird, hängt von der Planungsart ab. Bei der Planung mit Kartenausschnitt mit Klick in den Kartenausschnitt (egal ob mit oder ohne Nutzung der Google-Solar-API-Höhendaten) wird die Geländehöhe für die Adresse des Anlagenstandorts vom Kartenanbieter übernommen. Bei allen anderen Planungsarten (z.B. Kartenausschnitt geladen von der Festplatte, 3D-Modell-Import, klassische 3D-Planung mit vorgegebenen 3D-Modellen) wird die Geländehöhe des Klimadatenstandorts übernommen. Unabhängig davon, welche Geländehöhe übernommen wird, kann die Geländehöhe (im Unterschied zur Adresse des Anlagenstandorts) nachträglich in K2 Base editiert werden:
-
Hallo Peter-Solar, vielen Dank für deine Anfrage. Bitte sende uns die Projektdatei (*.pvprj) an hotline@valentin-software.com, dann sehen wir uns das mal an. Bitte schreib dazu, um welche Änderungen der Formatierung es geht.
-
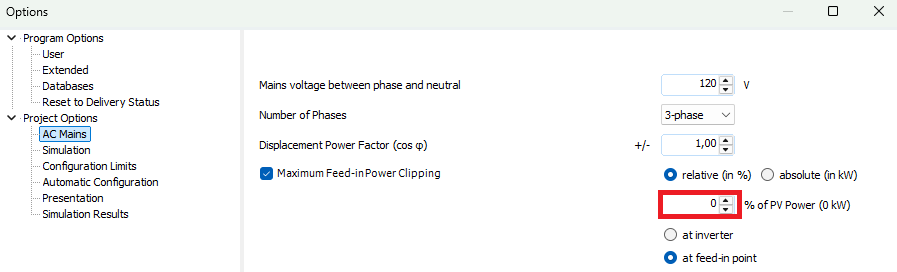
Dear Bendesa, Thank you for your inquiry. The planning of stand-alone systems in PV*SOL is based on the SMA Off-Grid Configurator, which we originally developed for SMA. This program contains the design rules that SMA specified for us. These rules cannot be changed or deactivated. For example, only systems with AC-connected battery systems can be planned; DC systems are unfortunately not possible. We understand that these rules may not necessarily apply to other manufacturers and may entail further limitations. For greater flexibility in component selection and improved transparency during the planning process, we recommend that you initially plan your stand-alone system as if it were a grid-connected system: 1. On the "System Type, Climate, and Grid" page, select a grid-connected system. 2. Set the maximum feed-in power to zero; then no energy will be fed into the grid. 3. The value under "Total Consumption Covered by Grid" indicates the energy that cannot be supplied by the PV system. This energy must (if you do not plan for an additional generator) "approach zero". Whether your chosen storage capacity can meet the demand depends on the availability of solar radiation. If your selected climate data set includes consecutive days with low solar radiation, a higher storage capacity must be selected to supply the required energy. In the chart editor (on the "Results" page), you can see how many days per year the battery is completely discharged due to insufficient solar radiation. The screenshot shows a sample project where the battery cannot meet the demand on two days in November: Feel free to send us your project file (hotline@valentin-software.com), and we will review your design and provide our optimization recommendations.

-
2026 Versions randomly restarts laptop during simulation
hotline_oh replied to Chloe G's topic in PV*SOL
Dear Chloe G, Thank you for your inquiry. Please send the log file and one of your crashing project files (*.pvprj) to hotline@valentin-software.com. The pvsolpremium.log can be found in the following directory: C:\ProgramData\Valentin EnergieSoftware\log Please note: ProgramData is normally a hidden folder. If it is not displayed, please enable the "Show hidden files and folders" option in the folder settings or enter the path in the path field of Windows Explorer. We would need the following files: pvsolpremium.log pvsolpremium.log.1 (if available) pvsolpremium.log.2 (if available) -
Dear tak, Thank you for your inquiry. Our software is backward compatible, meaning that files saved in older versions can be opened in newer versions, but not vice versa. With your 2022 program version, you can only open and edit files that you created with this version.
-
Hallo Sigi, vielen Dank für deine Anfrage. Grundsätzlich steht der Kabelplan für aufgeständerte Systeme sowie bei Verwendung der Polystring-Verschaltung und dachübergreifender Verschaltung nicht zur Verfügung. Stattdessen steht ein Strangplan zur Verfügung, der sich an der Sortierung auf der Seite Modulverschaltung orientiert.
-
Dear LFC, Thank you for your inquiry. Please send your project file (*.pvprj) to hotline@valentin-software.com, so that we can take a closer look at it.
-
Dear m.hall747, Thank you for your inquiry. The desired setting (maximum feed-in power of 100 kW at the inverter or at the feed-in point) can be configured under "Options" --> "Project Options" --> "AC Mains" (regardless of the inverter used).

-
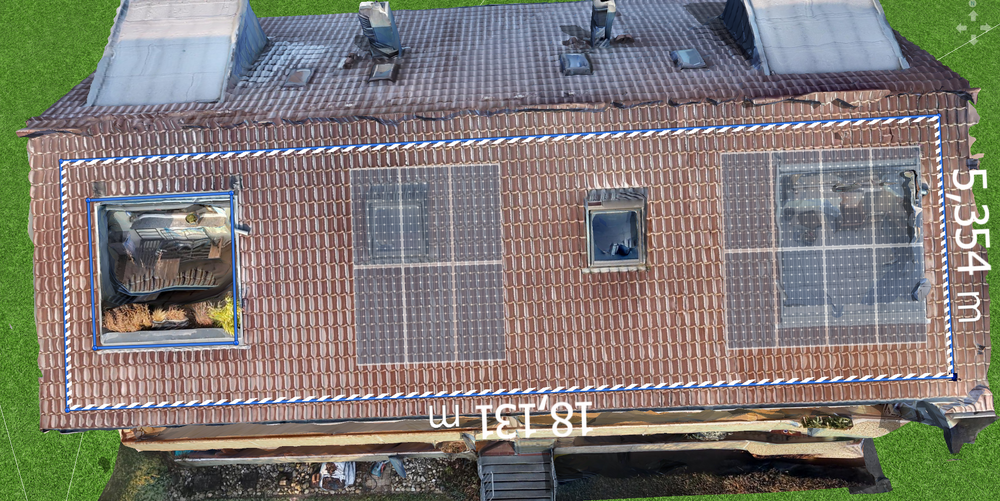
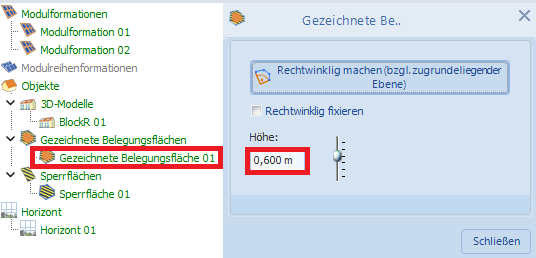
Die Unterkante des eingekreisten 3D-Moduls ist horizontal.
hotline_oh replied to Ray-AET's topic in PV*SOL
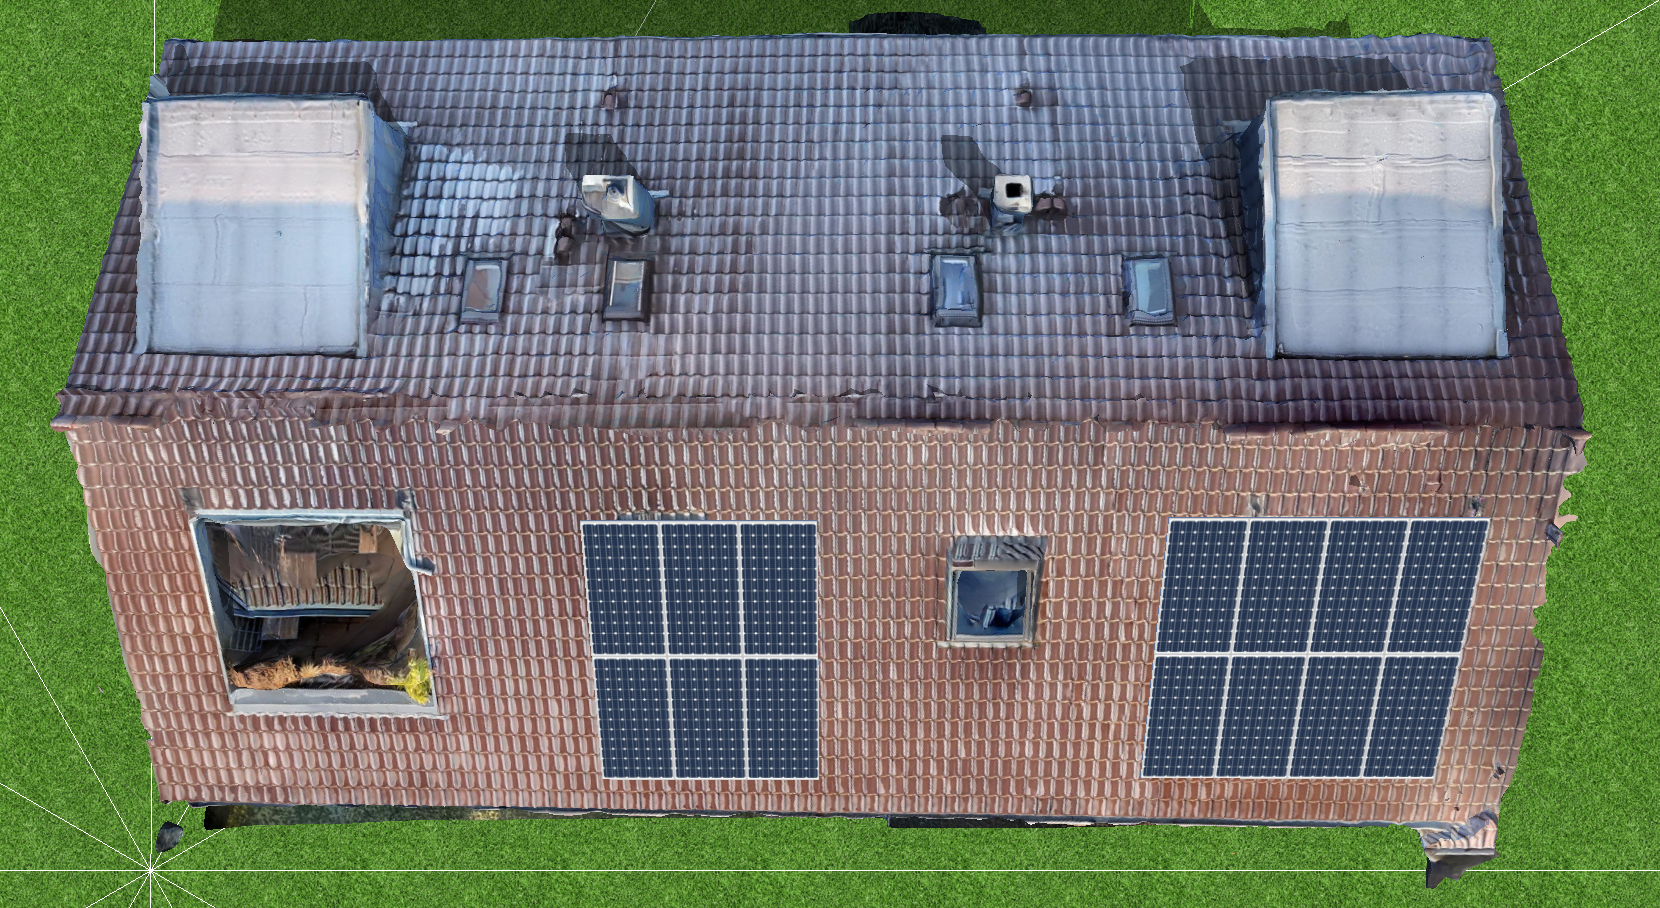
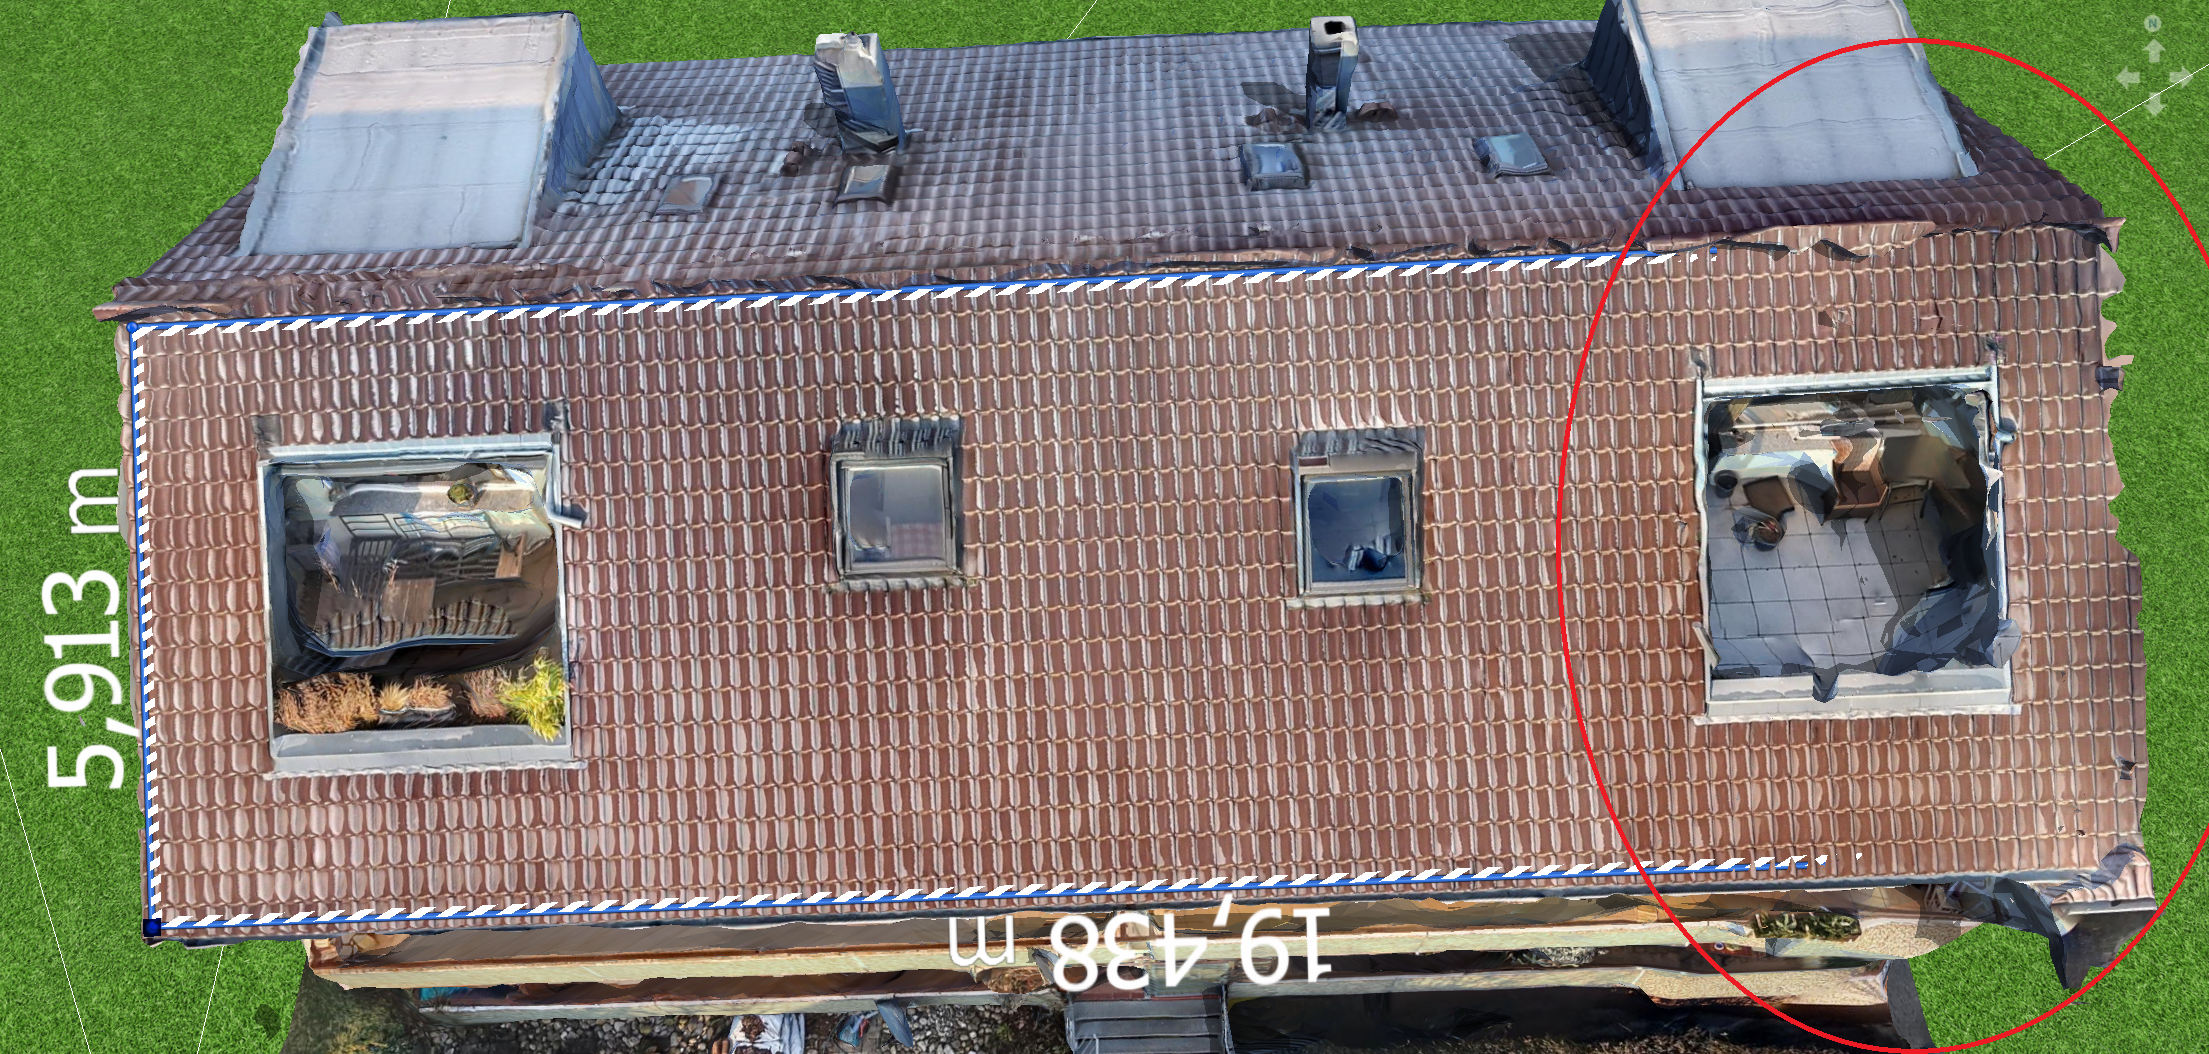
Hallo Ray-AET, vielen Dank für deine Anfrage. Die Qualität des 3D-Modells ist nicht die beste. Die Oberflächen sind teilweise uneben und die Kanten sind ausgefranst. Das erschwert das Einzeichnen der Belegungsfläche und es kann dazu führen, dass die Belegungsfläche in der Terrainansicht und in der Objektansicht unterschiedlich dargestellt wird. In deinem zweiten Screenshot ist zu erkennen, dass die rechte obere Ecke der Belegungsfläche außerhalb des Daches liegt: Wenn wir versuchen, eine Belegungsfläche zu zeichnen, verschwinden die rechte obere und die rechte untere Ecke im 3D-Modell, weil die Oberfläche des 3D-Modells nicht eben ist: Da du das Dach nicht vollständig mit Modulen belegen willst, empfehlen wir dir, die Belegungsfläche kleiner zu zeichnen. So ist die Wahrscheinlichkeit höher, dass die Eckpunkte tatsächlich auf dem Dach liegen: Die Sperrfläche wird bei uns korrekt dargestellt. Den 3D-Modell-Fehler in der rechten Modulfläche kannst du kaschieren, indem du die Belegungsfläche anhebst (Rechtsklick --> Bearbeiten): Dann musst du allerdings die Terrainansicht so wählen, dass die Höhe von 60 cm nicht sichtbar ist: Im Anhang findest du die von uns bearbeitete Projektdatei. Test 3D-Modell Belegungsfläche.pvprj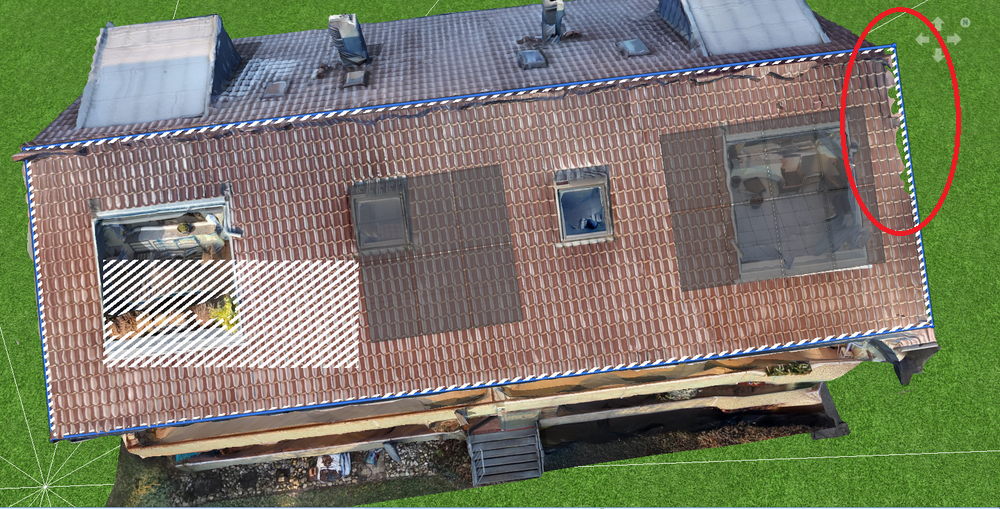


-
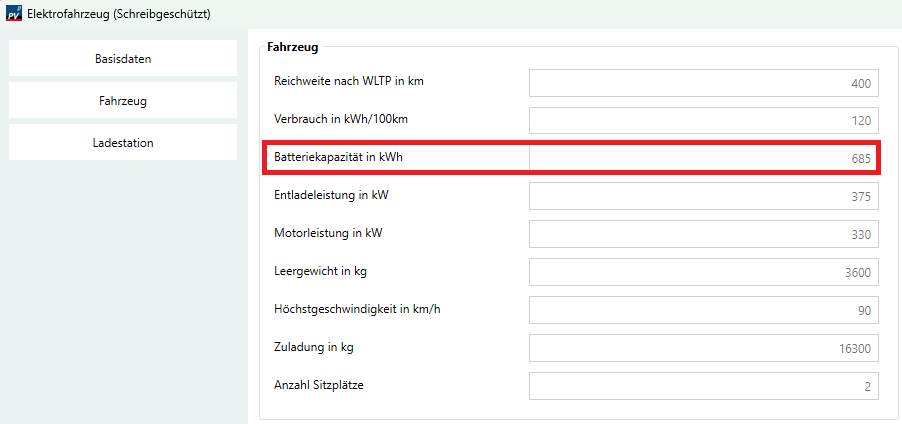
Hallo ADW, vielen Dank für deine Anfrage. Bei der Berechnung der Reichweite wird ein Ladezustands-Range zwischen einem SOC_min von 20 % und einem SOC_max von 90 % (Ende der Boost-Ladung) angenommen. Die berechnete Reichweite pro Ladung ist in deinem Fall also 400 km * (0,9 – 0,2) = 280 km. Der SOC_max kann leider nicht verändert werden. Du könntest den Datensatz kopieren und die Batteriekapazität auf 685 kWh erhöhen, wenn du die originale Batteriekapazität des LKW von 480 kWh nutzen willst.
- 1 reply
-
- 1
-

-
Dear Lime, Thank you for your inquiry. If you need to rotate a building retrospectively, the existing configuration is only retained for roof-parallel systems. For elevated systems, the configuration is unfortunately deleted. The wiring is deleted in both cases.
-
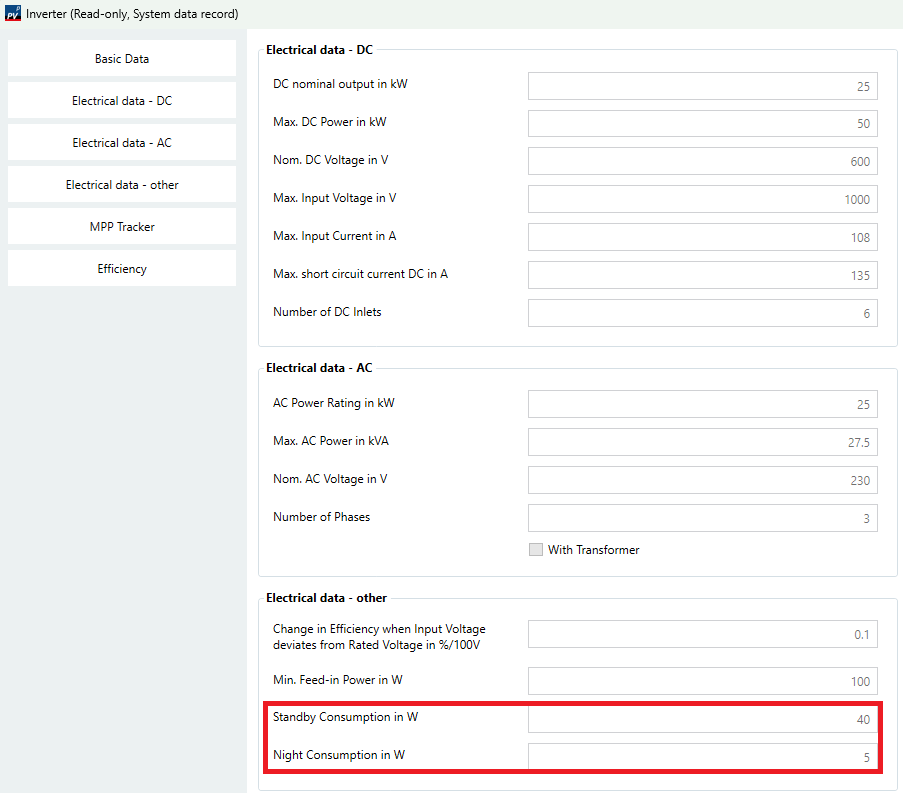
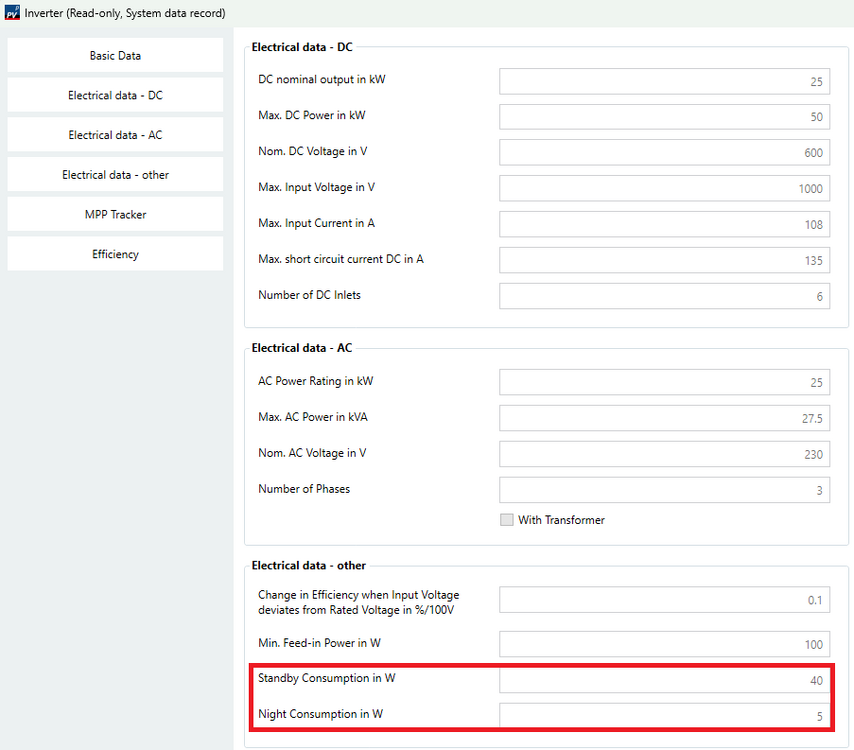
Dear said allaw, Thank you for your inquiry. The inverter SolaX X3-ULT-25K is stored in our database with a standby consumption of 40 W and a night consumption of 5 W. This energy is drawn from the grid. You have the option of copying the inverter data record and setting the standby consumption and night consumption to zero. Then no energy will be drawn from the grid.
-
Dear dalidhouib, Thank you for your inquiry. Unfortunately, there will be no undo function in the current program version. However, this feature is planned for the next version. You have the option of saving backup copies at shorter intervals in the 3D planning feature.
-
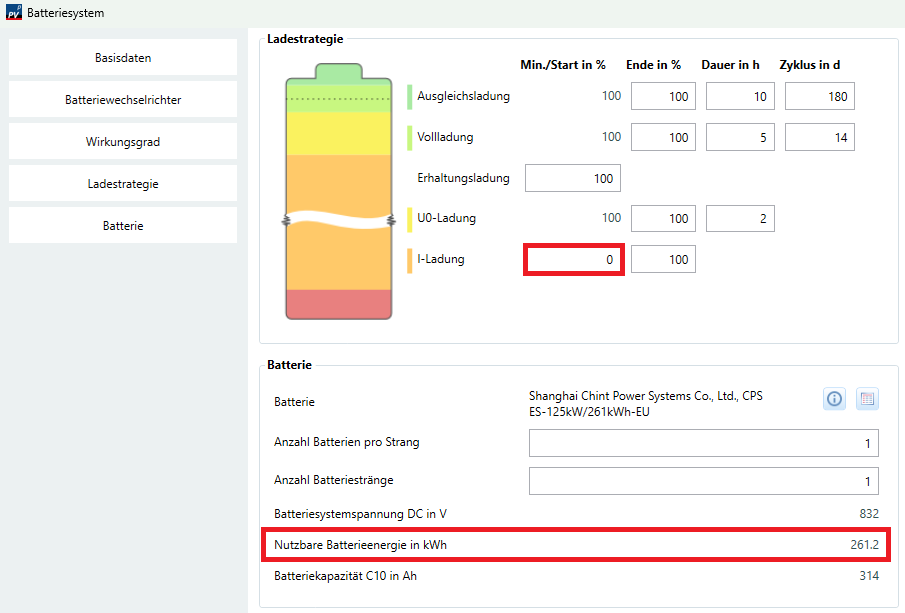
Sehr geehrter Herr Franz-Riegler, vielen Dank für Ihre Anfrage. Der Datensatz des Batteriesystems CPS ES-125kW/261kWh-EU wurde vom Hersteller angelegt, und zwar mit einer Entladetiefe von 99 % (mit der I-Ladung beginnend ab 1 %). Wenn Sie das Batteriesystem kopieren und neu abspeichern, können Sie die Entladetiefe auf 100 % setzen (I-Ladung beginnend ab 0 %). Dann wird Ihnen die Kapazität von 261 kWh angezeigt. Wir haben den Hersteller am 20. Januar angeschrieben und um Prüfung und ggf. Korrektur gebeten. Der Hersteller hat den Datensatz bisher nicht geändert, weshalb wir davon ausgehen, dass die Entladetiefe von 99 % beabsichtigt ist.
-
DRINGEND_Wirtschaftlichkeitsberechnung: Leistungspreis
hotline_oh replied to mdeniz17's topic in PV*SOL
Hallo Jens Beermann, vielen Dank für Ihre Anfrage. Das Datenbank-Update mit den neuen Einspeisetarifen ist heute erfolgt. -
Wie kann ich ein eigenes Logo im Projektbericht verwenden?
hotline_oh posted a question in FAQ (Nur lesen)
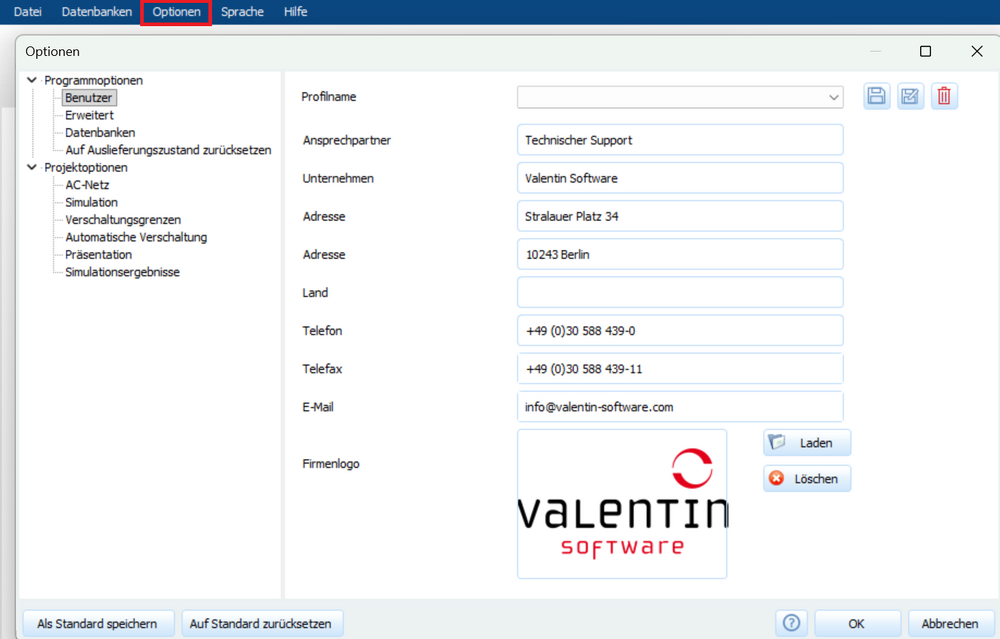
Sie können Ihr Logo unter "Optionen" --> "Benutzerdaten" importieren. Die Dateiformate *.gif, *.bmp, *.png oder *.jpg können verwendet werden.