hotline_oh
-
Posts
677 -
Joined
-
Last visited
-
Days Won
41
Everything posted by hotline_oh
-
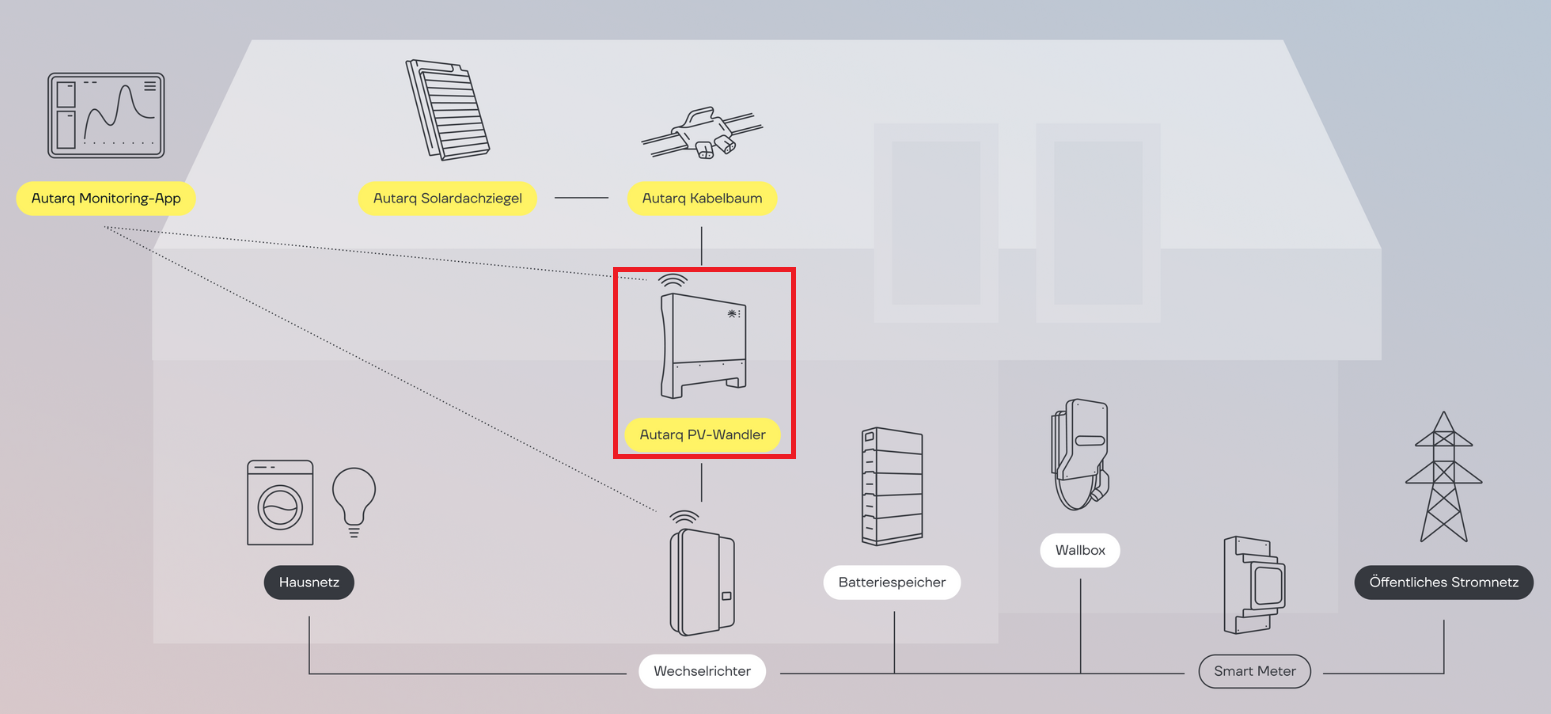
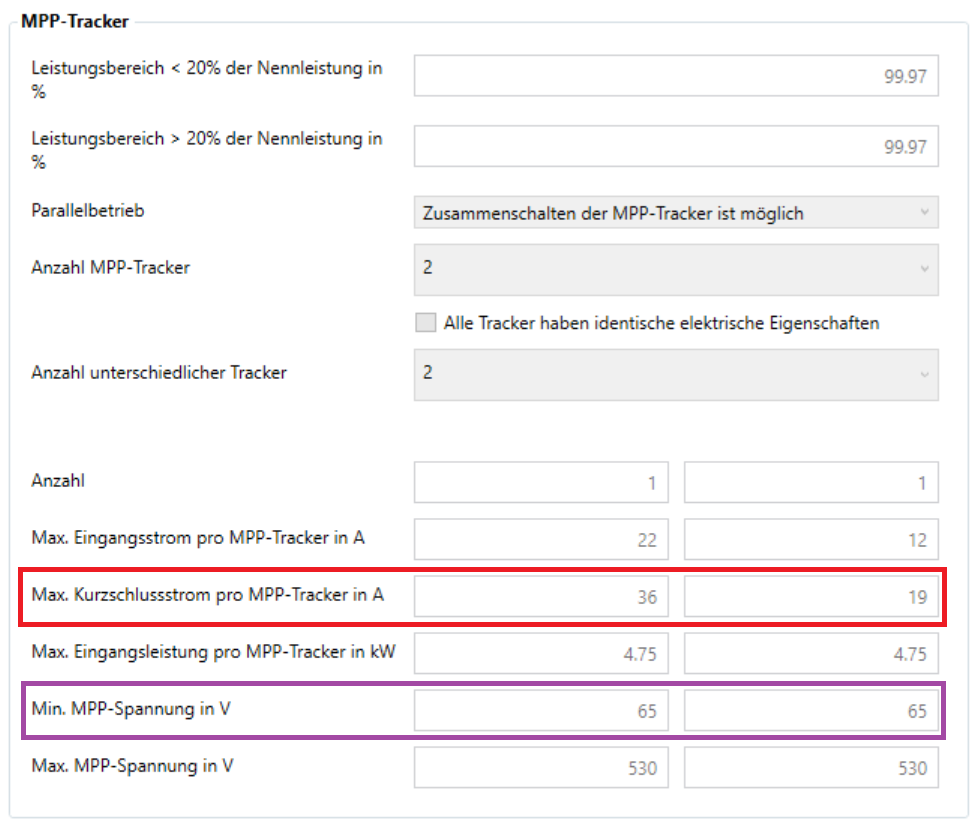
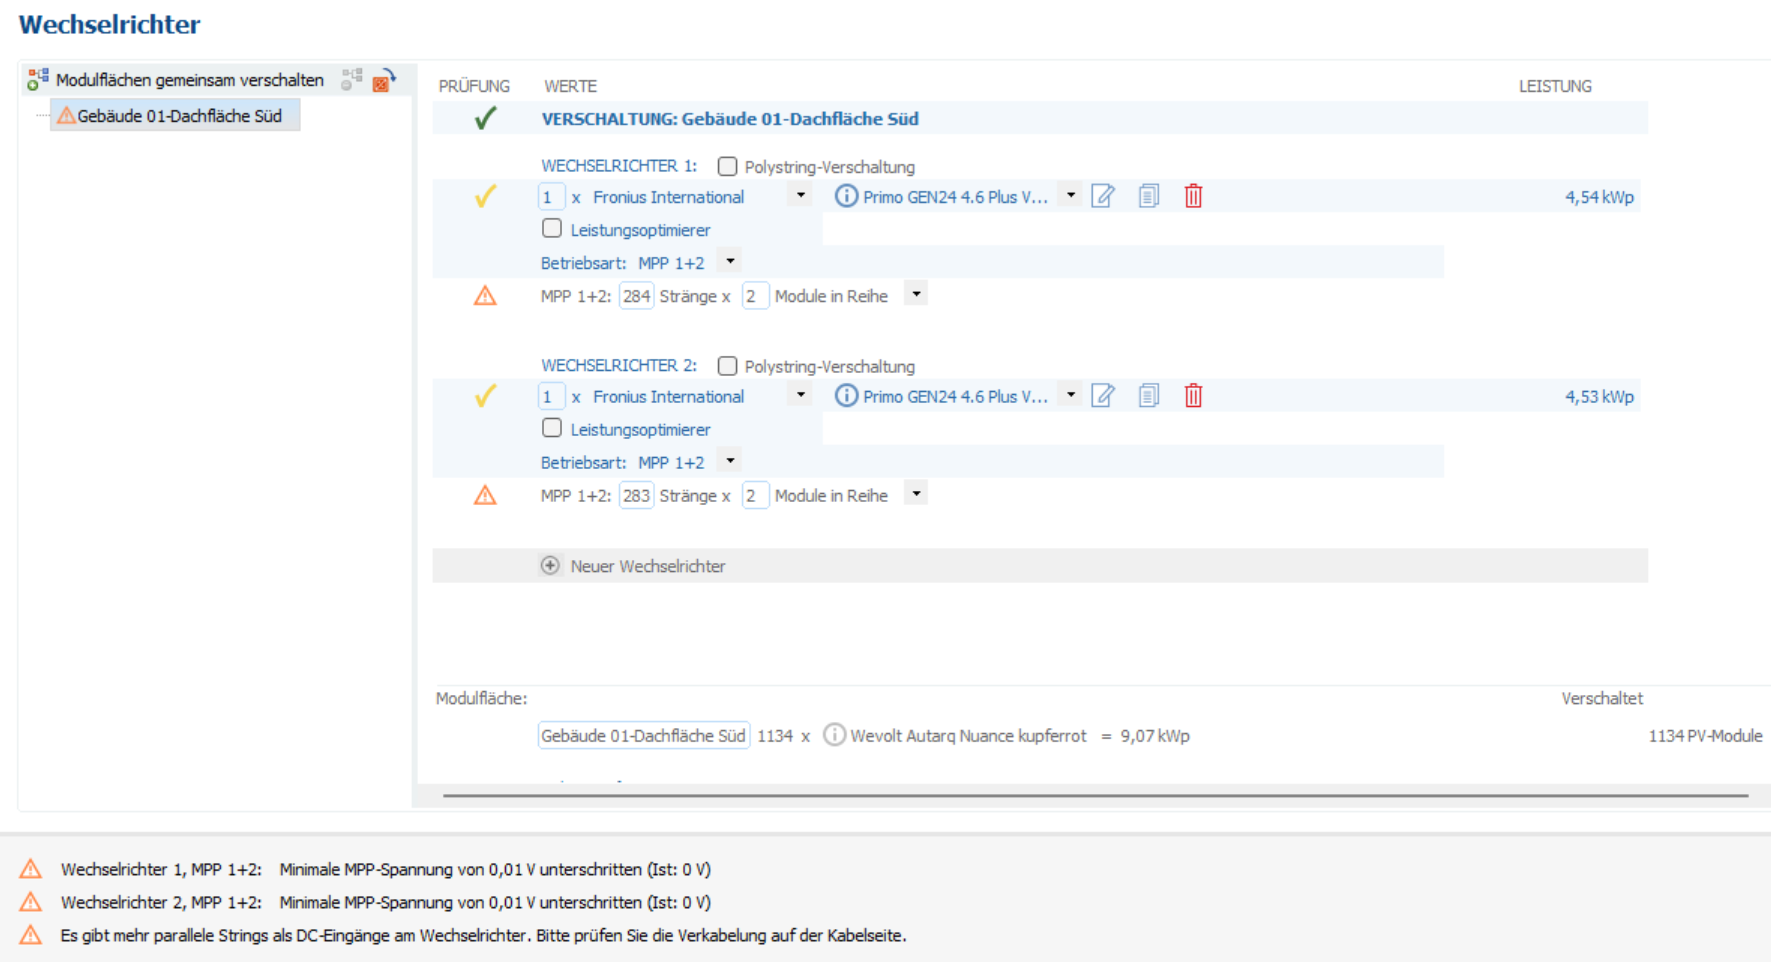
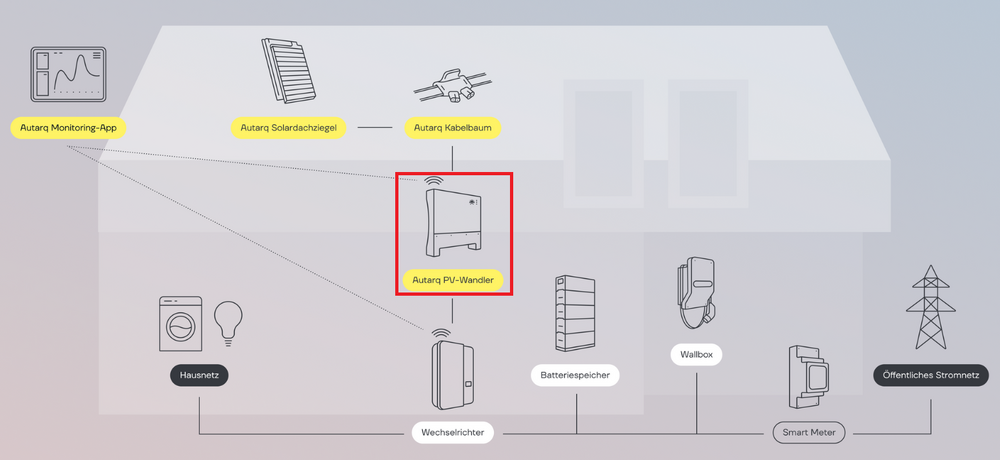
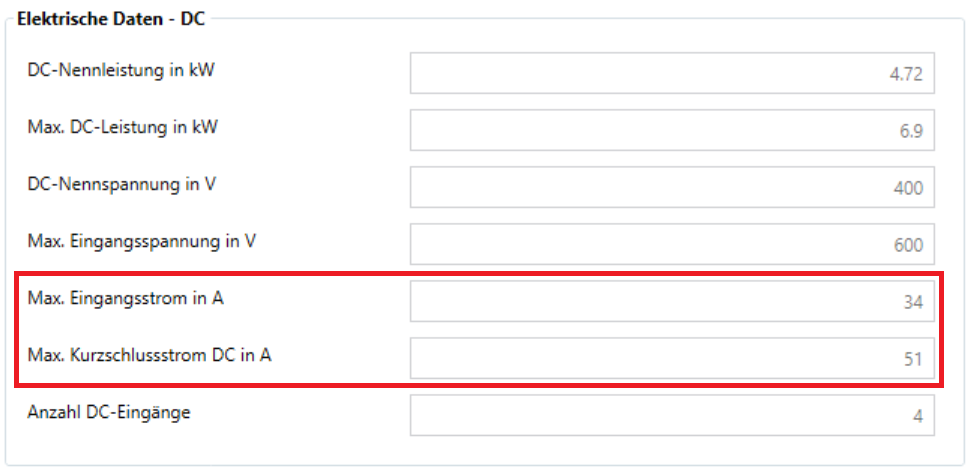
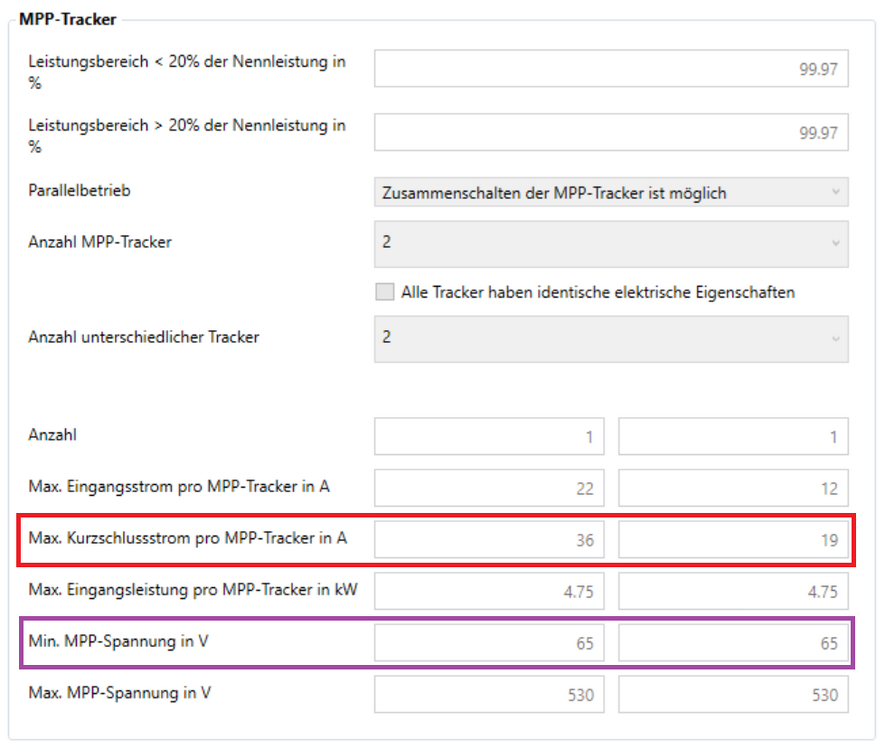
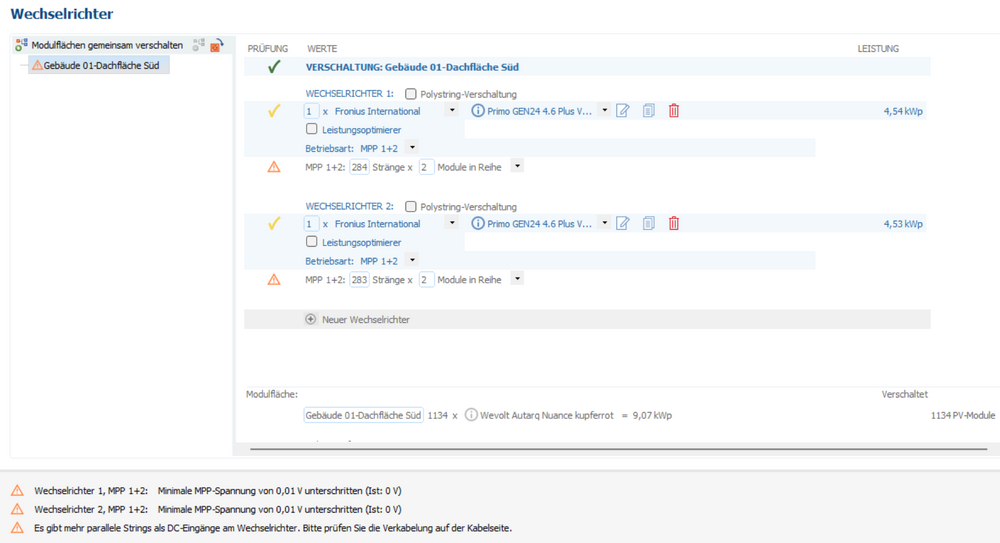
Vielen Dank für die Zusendung der Projektdatei und des Datenblatts. In einem Autarq-System werden nicht alle Ziegel parallel verschaltet, sondern immer zwei Ziegel in Reihe. Dadurch verdoppelt sich die Nennspannung von 41 V auf 82 V und die Leerlaufspannung von 49 V auf 98 V. Zwischen den Solarziegeln und dem Wechselrichter befindet sich ein PV-Wandler, an dem je zwei in Reihe geschaltete Ziegel parallel verschaltet werden. Der PV-Wandler wandelt die von den zwei in Reihe geschalteten Ziegeln erzeugte Gleichspannung (60-120 VDC) in die Eingangsspannung für den Wechselrichter (200-450 VDC) um. Dabei werden gleichzeitig die hohen Stromstärken in den passenden Eingangsstrom für den Wechselrichter umgewandelt. Bedauerlicherweise kann der PV-Wandler in PV*SOL premium nicht abgebildet werden. Sie können sich möglicherweise behelfen, indem Sie den Datensatz des Wechselrichters kopieren und so anpassen, dass die elektrischen Eigenschaften des PV-Wandlers (niedrigere Eingangsspannung, höherer Eingangsstrom) mit berücksichtigt werden. Die Verschaltung könnte so aussehen: Die Simulation kann durchgeführt werden, aber dass die Simulationsergebnisse realistisch sind, können wir nicht garantieren, da auch der PV-Wandler Verluste verursacht, die nicht berücksichtigt werden.
-
Guten Tag, vielen Dank für Ihre Anfrage. Welche Ziegel und welchen Wechselrichter wollen Sie verwenden? Damit eine reine Parallelschaltung möglich wäre, müssten die Ziegel hohe Spannungen und niedrige Stromstärken haben. Außerdem müsste der Wechselrichter in einem niedrigen Spannungsbereich arbeiten und hohe Stromstärken zulassen. Bitte senden Sie uns die Projektdatei (*.pvprj) an hotline@valentin-software.com, dann sehen wir uns das an.
-
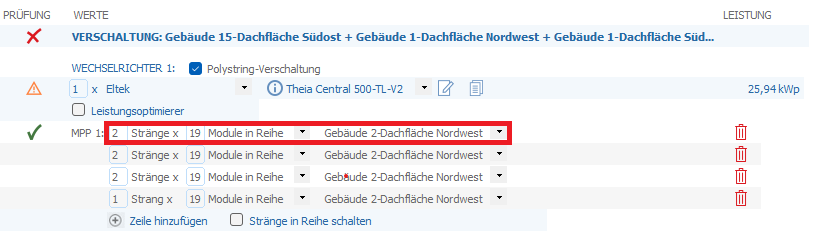
 Dear Mona, Thank you for your message. Yes, it is possible to combine both, for example: But with around 60 strings and a 500 kW inverter, such as the one you intend to use, things might get a bit confusing. Without Polystring configuration, you can keep track of everything, as the configuration is simply 60 × 19 modules. With Polystring configuration, each string is listed individually and you must take care not to mix up the numbering and order of the strings.
-
Hello, Thank you for your inquiry. We have sent you a message with the download link. Instructions on how to release the serial number can be found in our FAQ.
-
Hallo Tim, vielen Dank für die Zusendung der Projektdatei. Es handelt sich um einen Bug. Unsere Entwicklungsabteilung arbeitet an einer Lösung. Kurzfristig hast du leider nur die Möglichkeit, den Schaltplan zu exportieren und die Kabelanzahl in einem Bildbearbeitungsprogramm anzupassen.
-
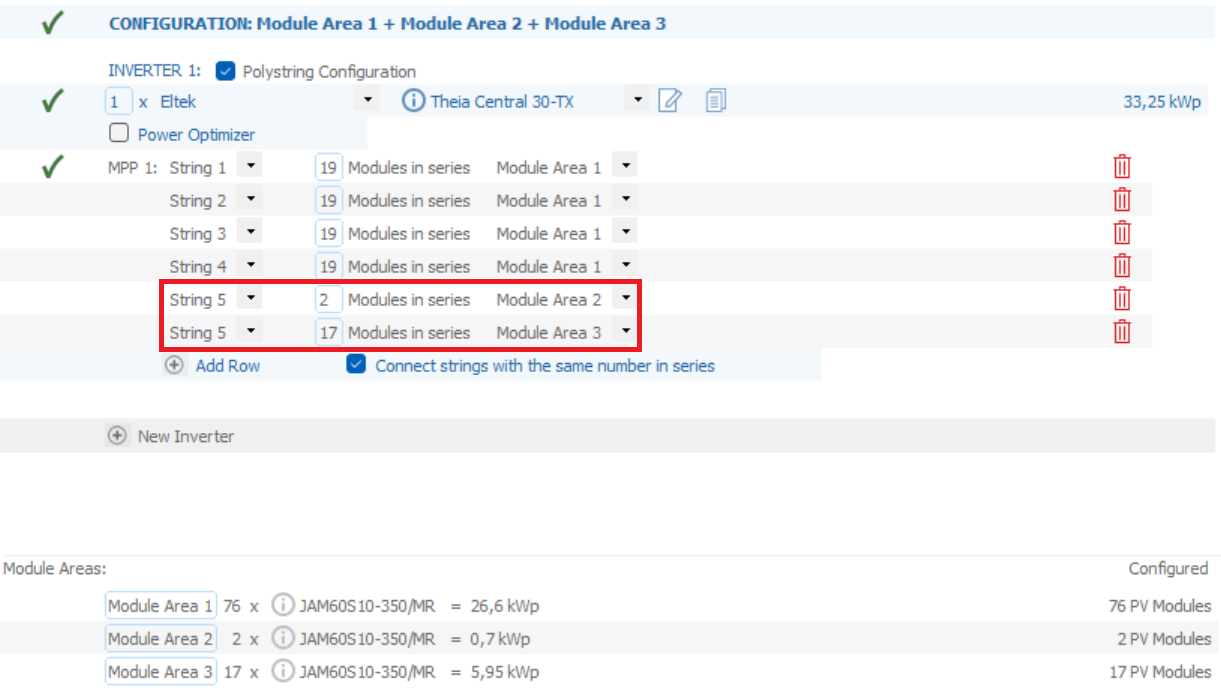
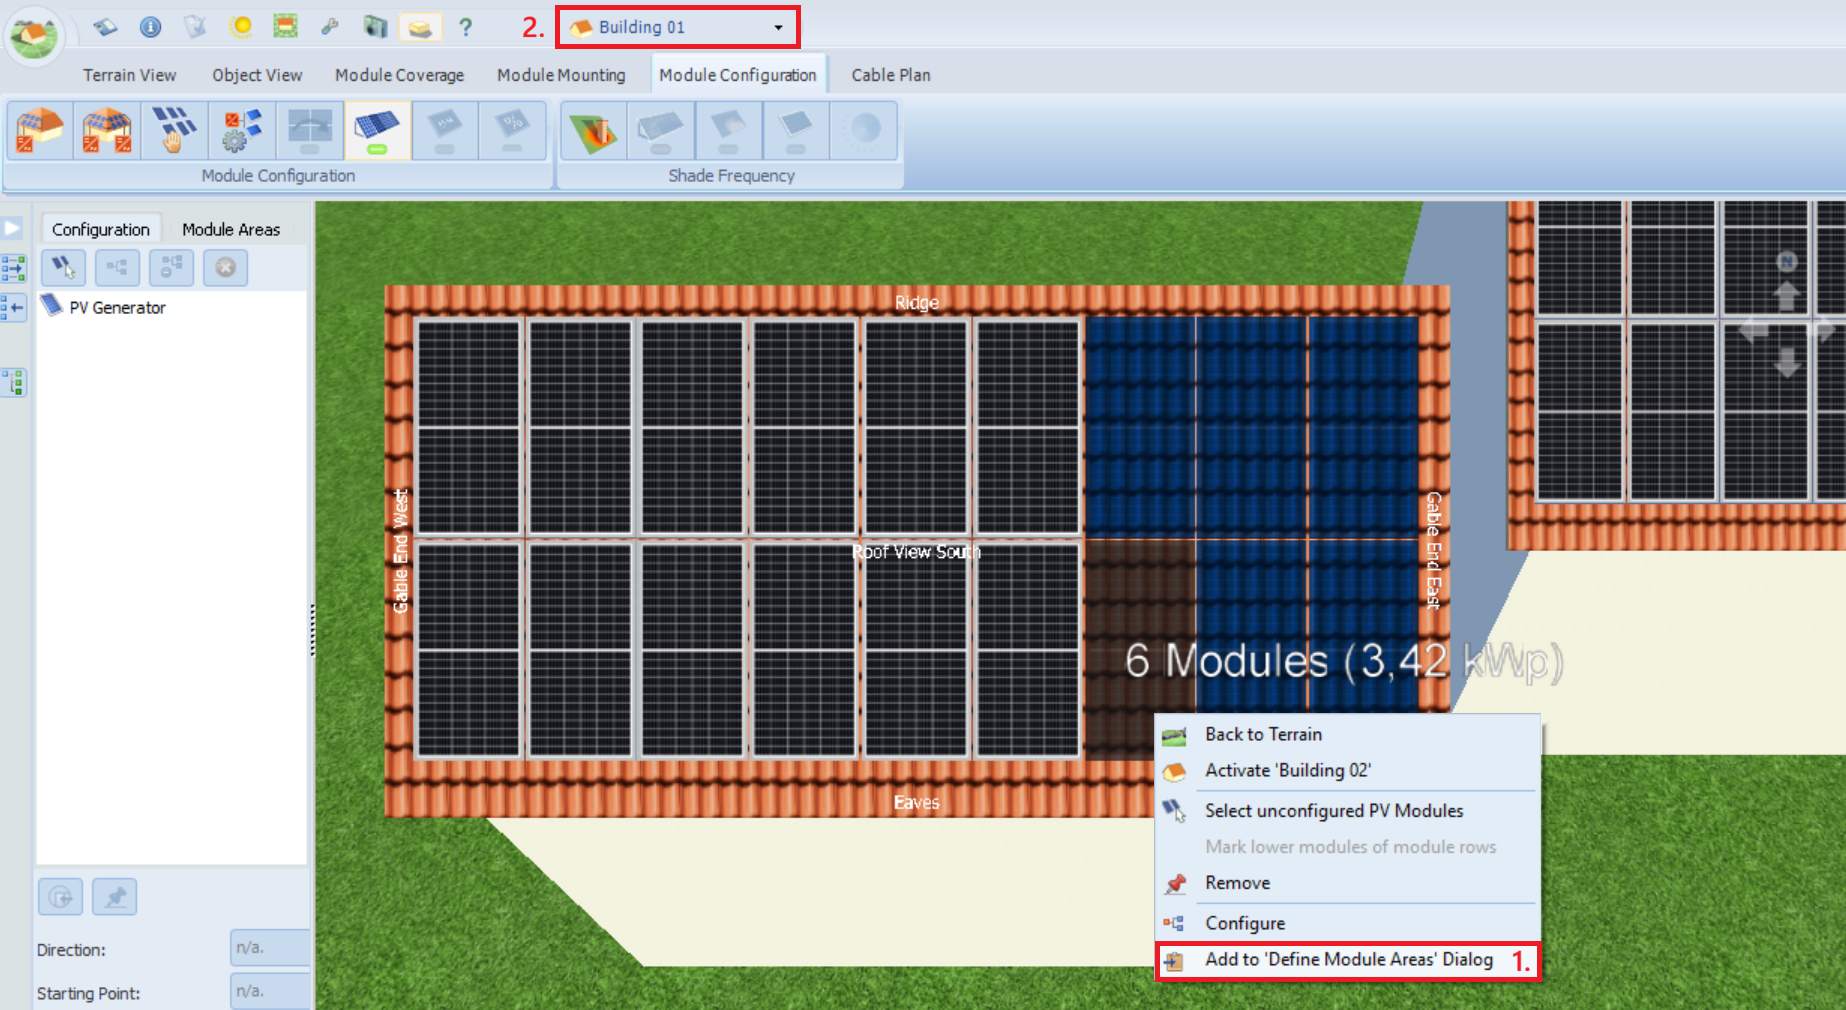
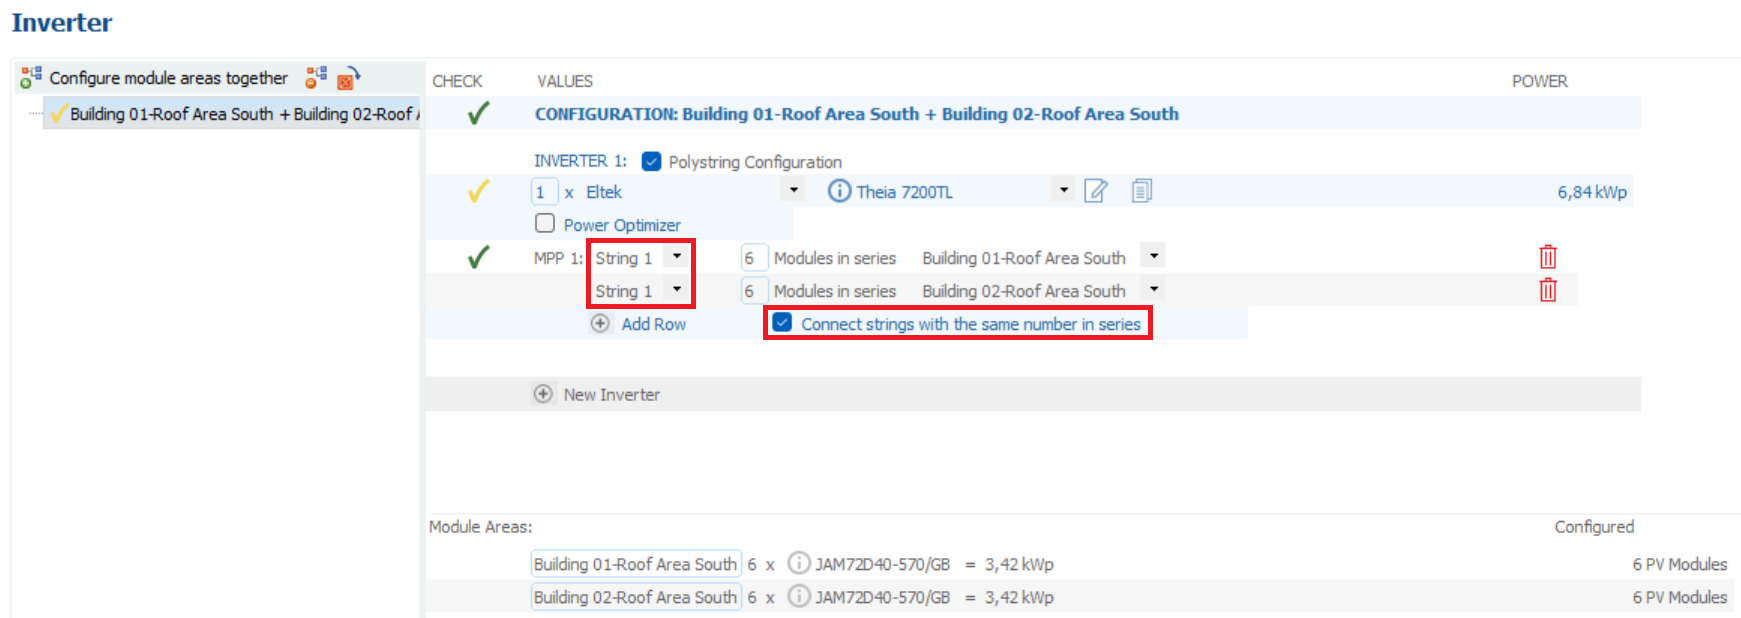
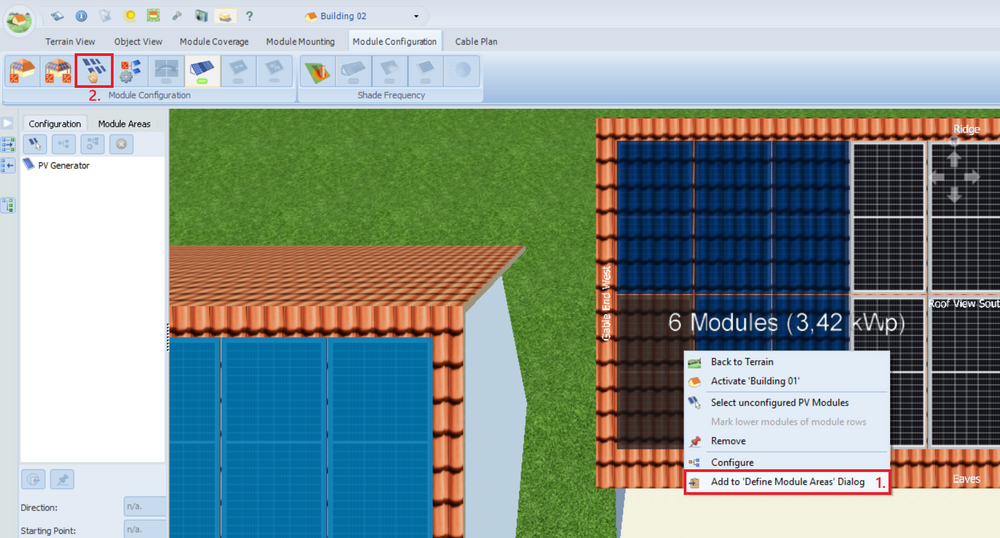
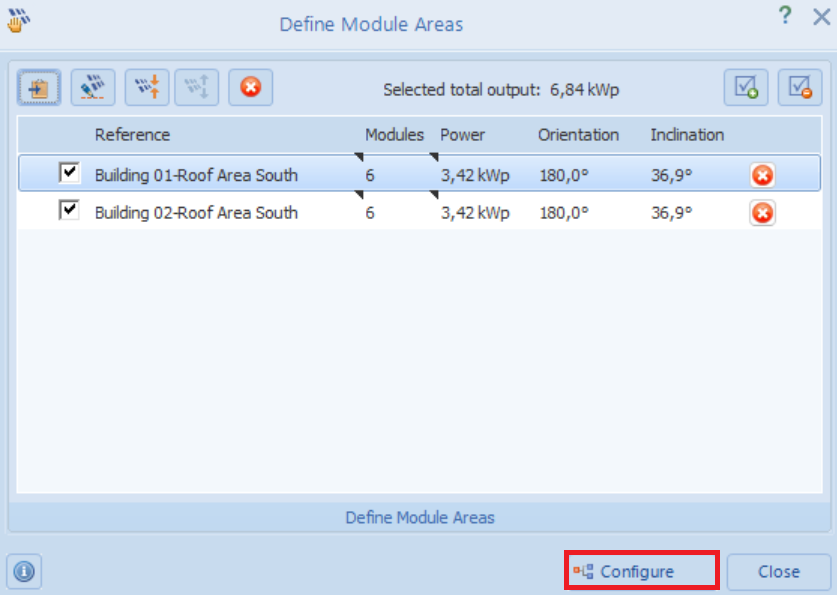
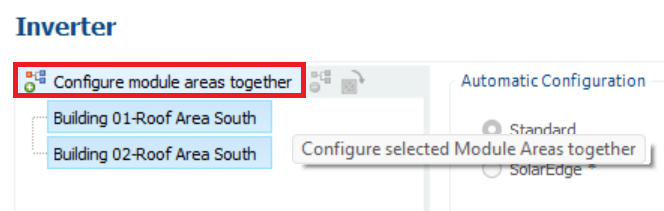
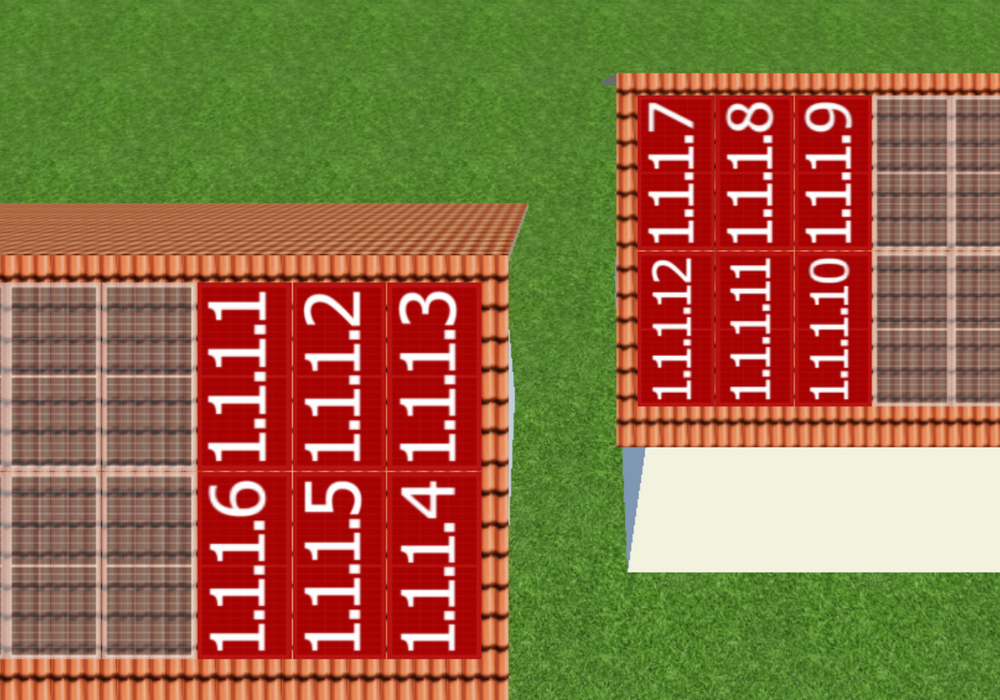
Hello, Thank you for your inquiry. You can configure multiple module areas on different roof areas together. First, define which modules should be configured together. Select the desired modules from the first module area, right-click on the selected modules, and choose "Add to 'Define Module Areas' Dialog." Then use the dropdown menu in the top menu bar to switch to the second building. Now select the desired modules of the second module area, right-click on the selected modules, and choose "Add to 'Define Module Areas' dialog." Then click the "Define Module Areas for Configuration" button: You can rename the module areas if necessary (right-click → Rename). Then click "Configure": In the inverter configuration window, select both module areas and click "Configure module areas together": Select both checkboxes for "Polystring configuration" and "Connect strings with the same number in series," and assign both module areas to string 1: String 1 now runs across two separate roof areas: You have already implemented the parallel configuration of two strings, each with 19 modules, on the same roof area:


-
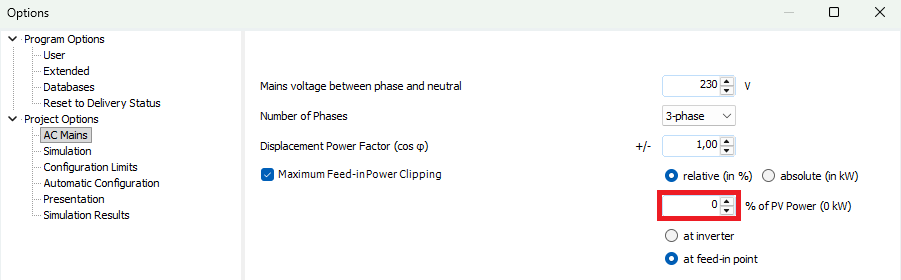
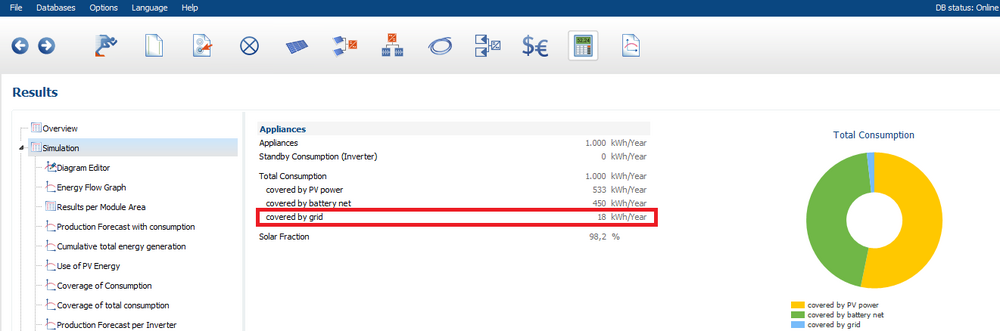
Hello, Thank you for your inquiry. On the "System Type, Climate and Grid" page, you can select the "Stand-alone PV System" (with and without a backup generator) system type. Planning stand-alone systems in PV*SOL is based on the SMA Off-Grid Configurator program, which we originally developed for SMA. This program contains the design rules that SMA has specified for us. These rules cannot be changed or deactivated. For example, only systems with AC-coupled battery systems can be planned; DC systems are unfortunately not possible. We understand that these rules may not necessarily apply to other manufacturers and may entail further limitations. For greater flexibility in component selection and improved transparency during the planning process, we recommend that you initially plan your stand-alone system as if it were a grid-connected system: On the "System Type, Climate and Grid" page, select a grid-connected system. Set the feed-in limit to zero; then no energy will be fed into the grid: The value under "Total consumption covered by grid" indicates the energy that cannot be covered by the PV system. This energy must be provided by the backup generator or (if you are not planning on a backup generator) "approach zero".
-
Advice needed – modeling a complex multi-plane roof in PV*SOL (beginner)
hotline_oh replied to Greentechbau's topic in PV*SOL
Hello, Thank you for your message. Registration on the Rexplorer website is not required. You can generate an API key within the PV*SOL premium 3D environment. If you do not yet have an API key for Rexplorer, or if you have not yet entered it in PV*SOL premium, only the button for managing the API key will appear. Clicking the button will take you to the window where you can manage the API key. In this dialog, you can manage your Rexplorer API key. If you don’t have a Rexplorer API key yet, simply leave the API key field blank. An account will then be automatically created on Rexplorer using the email address displayed above, and an API key will be generated. When you sign up, your email address will be transmitted to Rexplorer’s servers. Rexplorer’s Privacy Policy and Terms of Use apply. If you already have an API key from Rexplorer, you can simply enter it here. If you have forgotten your API key, you can retrieve it in the Rexplorer portal. You can find further information about the Rexplorer API and managing the Rexplorer API key in our help section. -
Hallo Tim, vielen Dank für deine Anfrage. Bitte sende uns die Projektdatei (*.pvprj) an hotline@valentin-software.com, dann sehen wir uns das an.
-
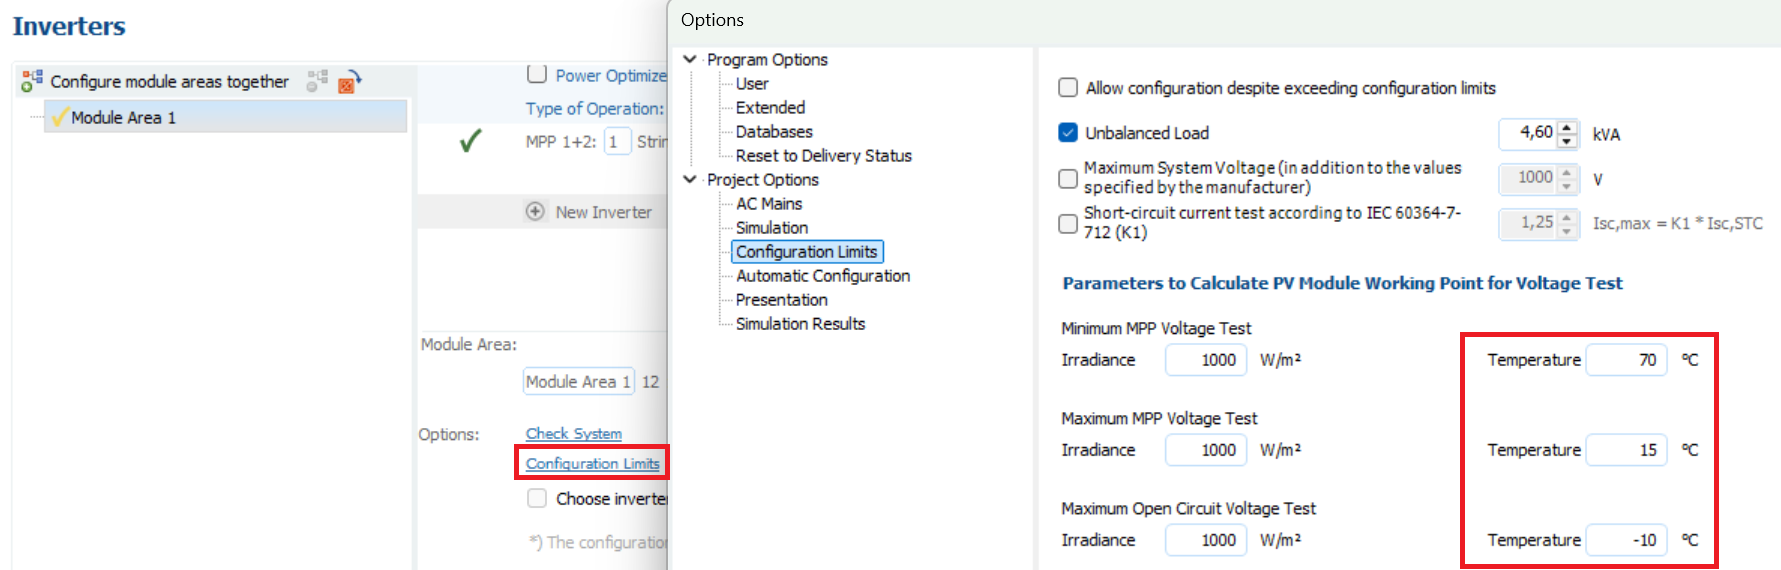
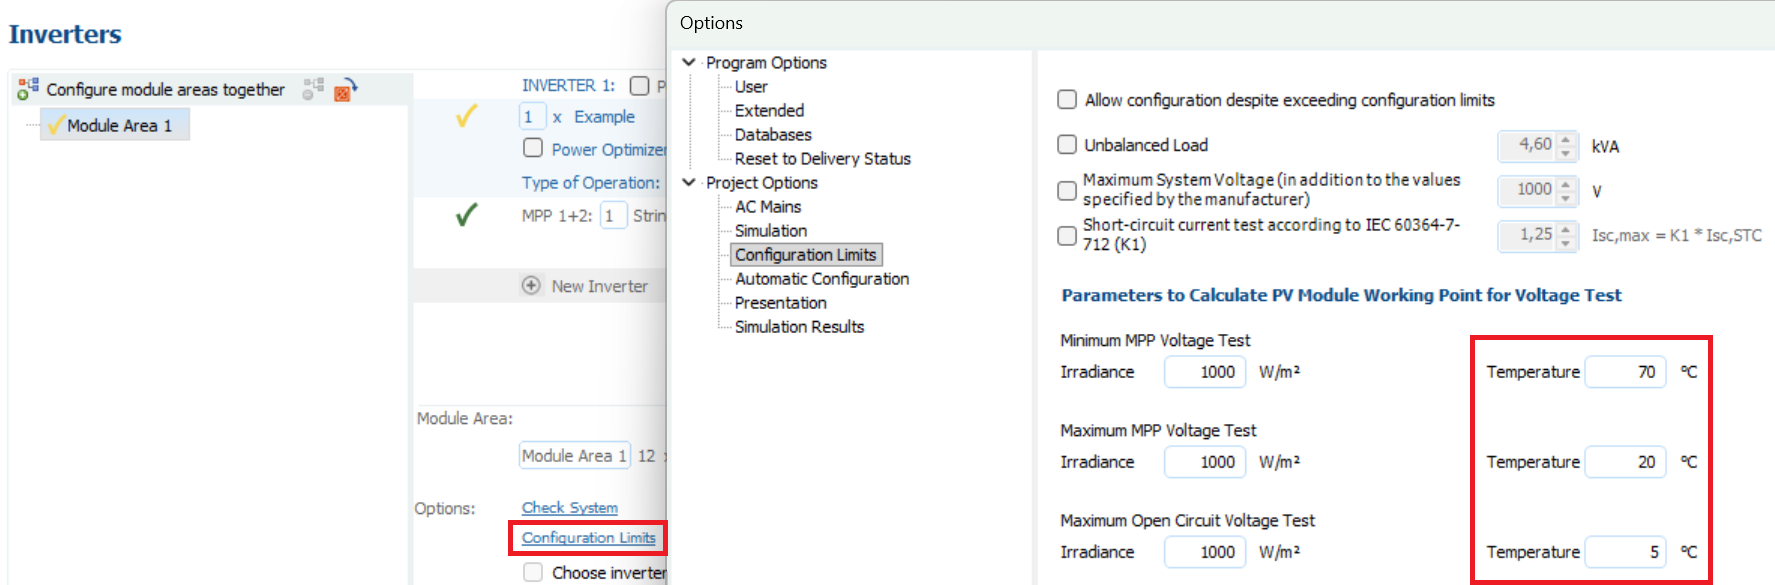
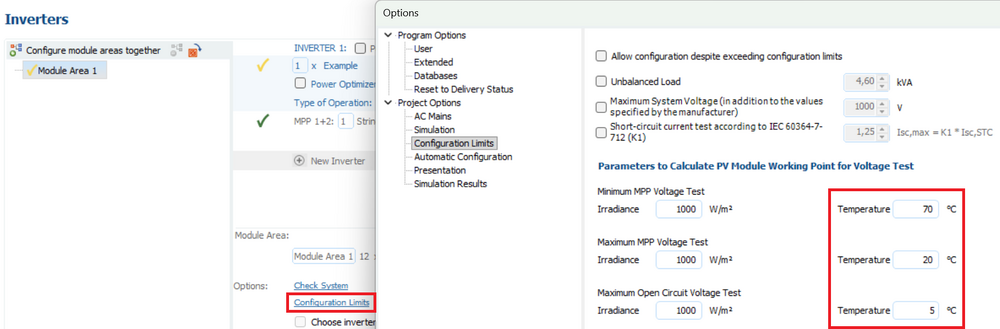
Dear Mark, Thank you for your inquiry. Open-circuit voltage is temperature-dependent. This temperature dependence is defined by the temperature coefficient, which can be found on the module data sheets. The configuration limits take into account a minimum temperature of -10°C, as encountered in temperate latitudes. If you are planning a system in subtropical or tropical regions, you can adjust the lower and middle of the three temperature limits upwards. For example, if the outdoor temperature in Namibia fluctuates only between 9°C and 34°C throughout the year, you would set the lower temperature limit to 5°C and the middle limit to 20°C:

-
Dear Mark, Thank you for your message. Yes, we confirm that you must use the exponent 1.3278 instead of 0.55.
-
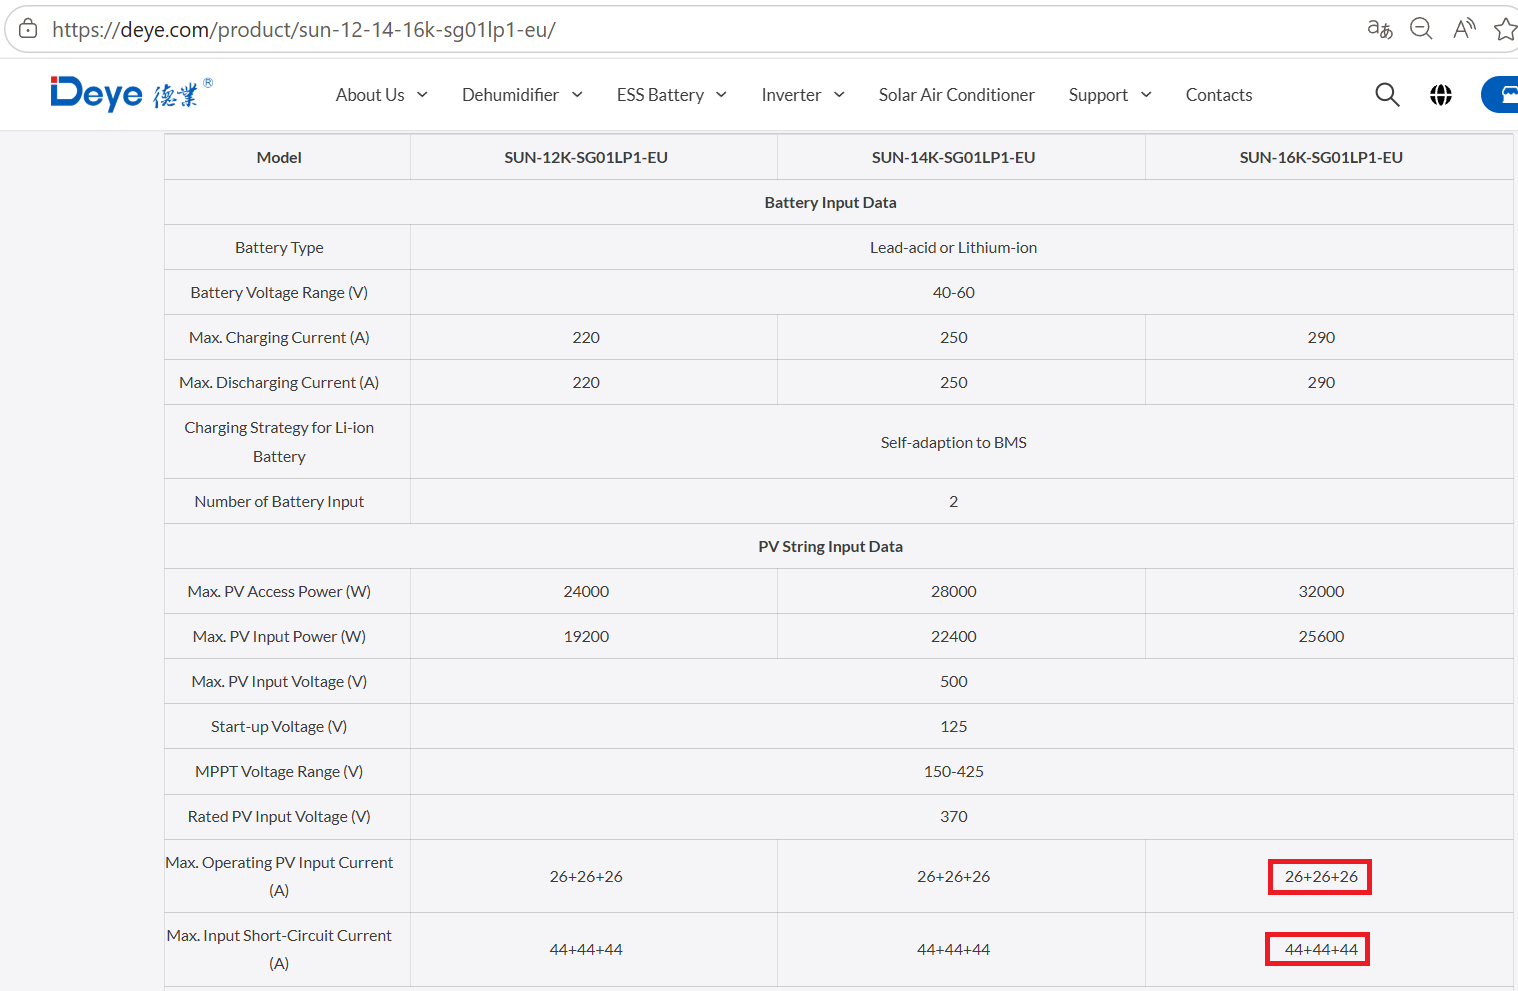
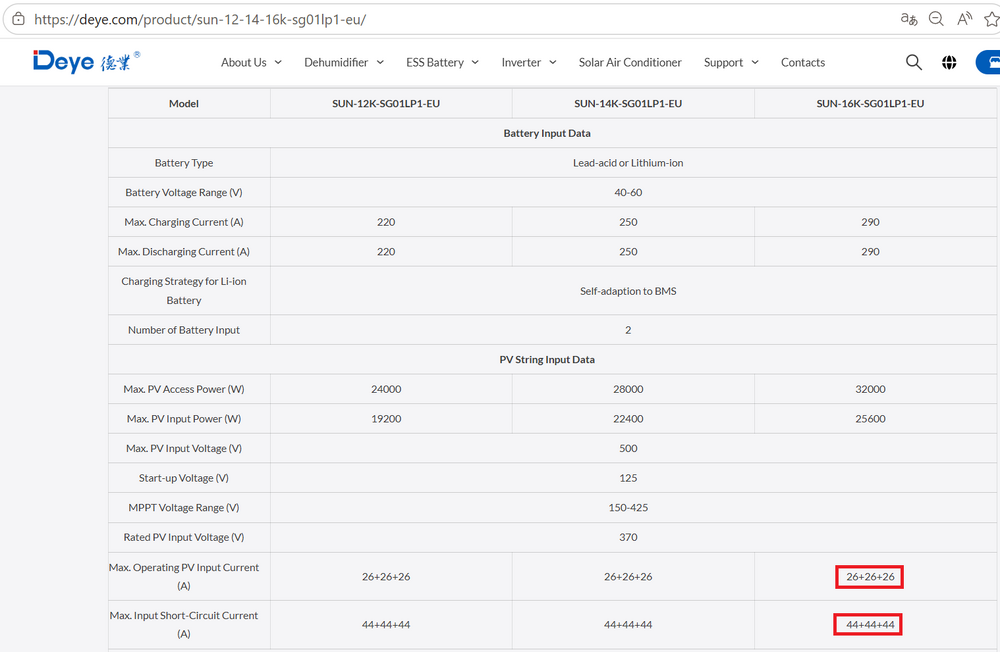
Hello, Thank you for your inquiry. Your datasheet appears to be outdated. The official Deye website lists the maximum operating current as 78 A and the maximum short-circuit current as 132 A.
-
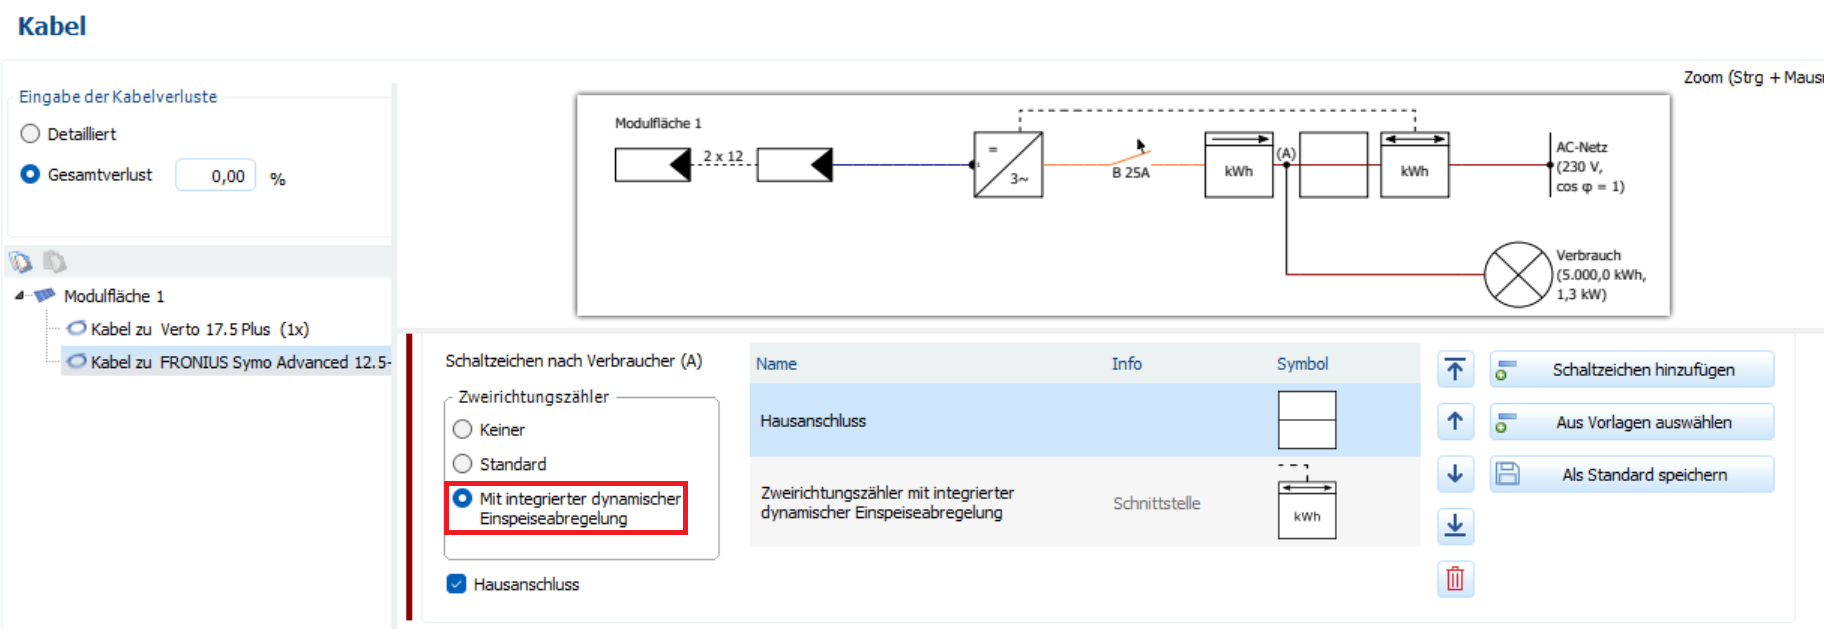
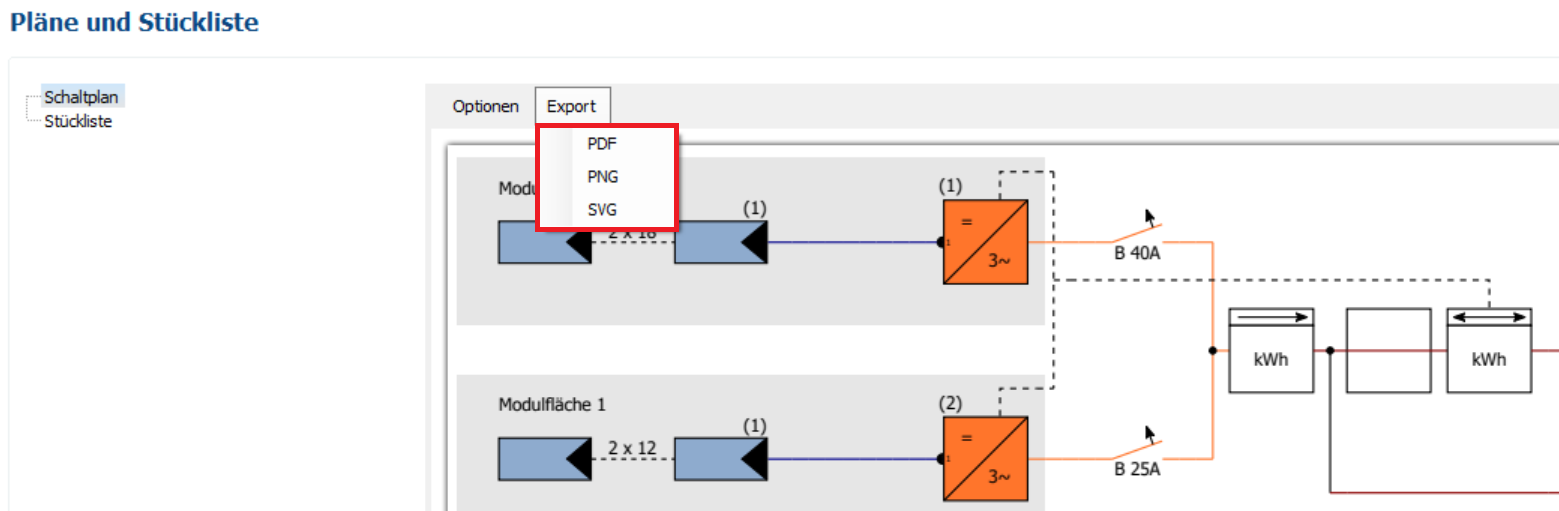
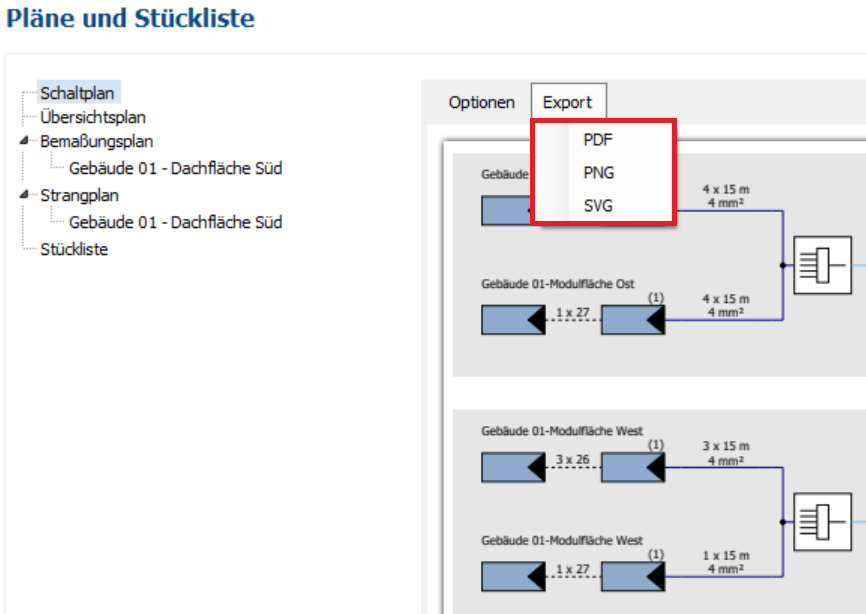
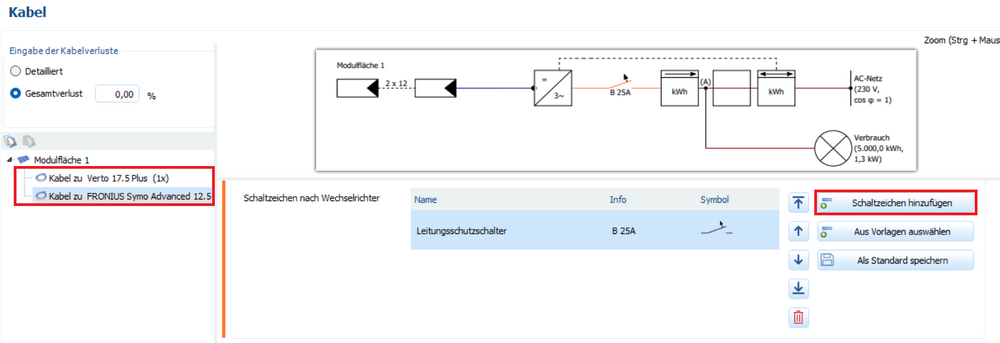
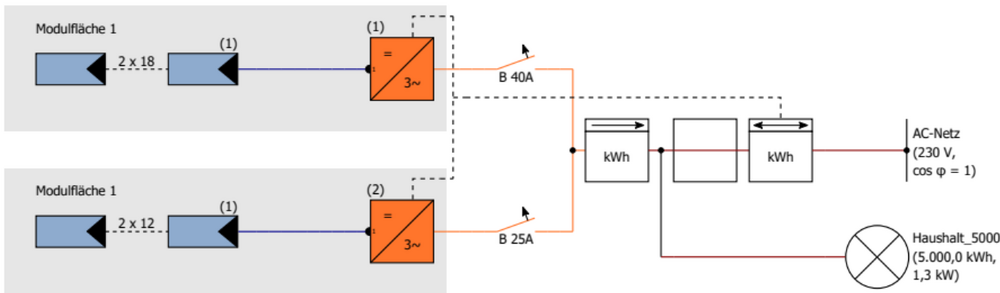
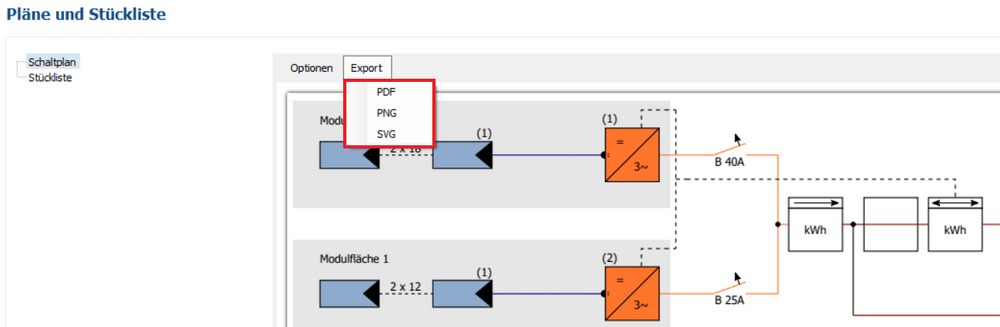
Hallo, vielen Dank für deine Anfrage. Auf der Seite "Kabel" navigierst du in der linken Baumansicht zum gewünschten Wechselrichter und fügst je ein Schaltzeichen für den Leitungsschutzschalter ein: Für den Funkrundsteuerempfänger findest du in der Liste der Schaltzeichen verschiedene Möglichkeiten. Den Zweirichtungszähler mit integrierter dynamischer Einspeiseabregelung findest du unter "Schaltzeichen nach Verbraucher": Es werden beide Wechselrichter abgeregelt: Wenn du darstellen willst, dass nur einer der beiden Wechselrichter abgeregelt wird, bleibt dir nur die Möglichkeit, den Schaltplan in ein Bildbearbeitungsprogramm zu exportieren. Der Schaltplan kann in den Formaten PDF, PNG und SVG exportiert werden.

-
Hello, Thank you for your inquiry. Please send your project file (*.pvprj) to hotline@valentin-software.com so that we can take a closer look at it.
-
Dear Mark, Thank you for your message. The formula is correct, but the exponent (0.55) is not a standard constant; it varies depending on the battery type and even within a single battery type. PV*SOL Premium uses a value of 1.3278; this value models lithium iron phosphate batteries with sufficient accuracy. Unfortunately, we are unable to model higher accuracy (using variable exponents).
-
Hello, Thank you for your inquiry. You are currently registered in the license portal as both the license manager and the license user for your license. Please log in to the license portal and set up a new license manager and a new license user. Then, deactivate your own license usage and activate the second license user for your license. You can find further information on the roles of license manager and license user in our online help.
-
Advice needed – modeling a complex multi-plane roof in PV*SOL (beginner)
hotline_oh replied to Greentechbau's topic in PV*SOL
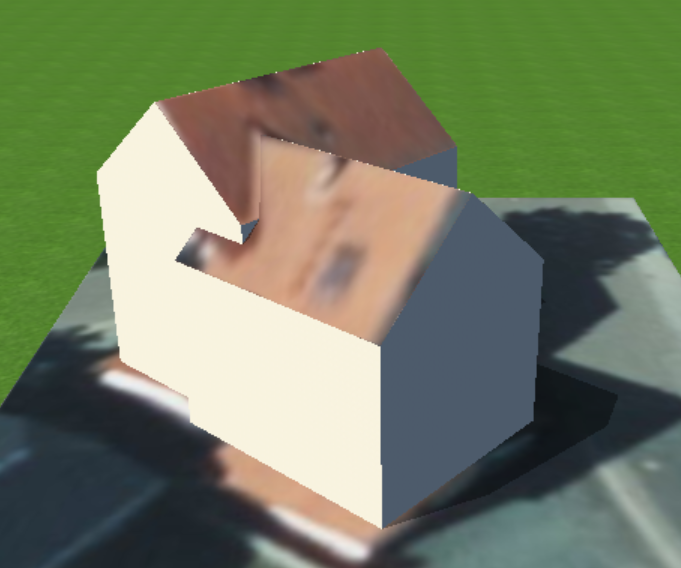
Hello, Thank you for your inquiry. Two planning methods are rather unsuitable: - Using the Rexplorer API, because the L-shaped building (two intersecting gable roofs) is unfortunately not rendered correctly. (However, you can use this method effectively to retrieve building and roof dimensions by drawing layout areas onto the 3D models and displaying their measurements; please see the attached project file.) - Using the Google Solar API, because the image quality is rather poor. We would therefore recommend importing a Bing Maps section, as the image quality is significantly better and allows you to easily position the various obstructions (roof windows, chimney, etc.) based on the texture. We would: - extrude two gable roofs, - adjust the building dimensions accordingly, - disable building collision, and - overlap the two building sections. In this video tutorial, we demonstrate how to assemble a complex roof from multiple roof sections using an L-shaped bungalow as an example. (Please use the English subtitles for translation.) The disadvantage of planning with a Bing Maps section (compared to the Rexplorer API and Google Solar API) is that you cannot automatically account for shading caused by the church tower and the tree (located northwest of the house). In this case, you must manually insert the objects that cause the shading. Rugendorf with Bing Maps and extrusion.pvprj Rugendorf with Google Solar API.pvprj Rugendorf with Rexplorer.pvprj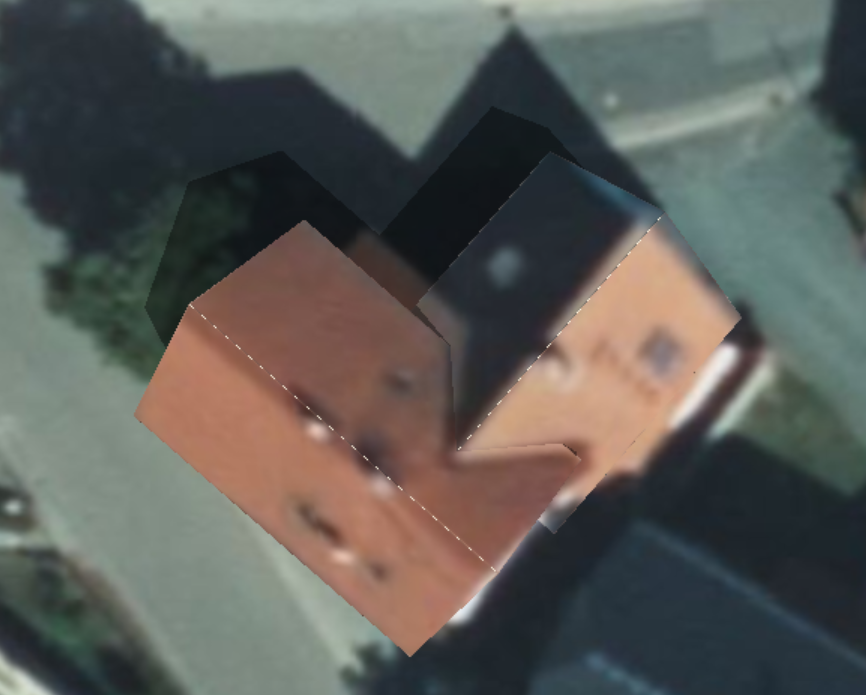
-
Hello, Thank you for your inquiry. If you wish to position elevated modules in an open space or on a flat roof, you must first define the mounting system. You cannot rotate the mounting system. If you wish to position a second module table next to the first one with a different orientation, create a second mounting system with the new orientation. We explain how to define and position a mounting system in this video tutorial, starting at the 4-minute mark:
-
Freifläche (Kartenausschnitt) wird nicht dargestellt
hotline_oh replied to Daniel-Elektro's topic in PV*SOL
Hallo, vielen Dank für die Zusendung der Projektdatei. Wir konnten Ihr Projekt reparieren, indem wir einen neuen Kartenausschnitt eingefügt haben. Die reparierte Projektdatei haben wir Ihnen per E-Mail zugeschickt. -
Hallo, vielen Dank für deine Anfrage. Die Kombination von elektrischem Verbraucher, Batteriesystem, Elektrofahrzeug und thermischem System wird ab der Version PV*SOL premium 2027 R1 möglich sein, die wir im November 2026 veröffentlichen.
-
Freifläche (Kartenausschnitt) wird nicht dargestellt
hotline_oh replied to Daniel-Elektro's topic in PV*SOL
Hallo, vielen Dank für Ihre Anfrage. Bitte senden Sie uns die Projektdatei (*.pvprj) und das Bild (den Kartenausschnitt) an hotline@valentin-software.com, dann sehen wir uns das an. -
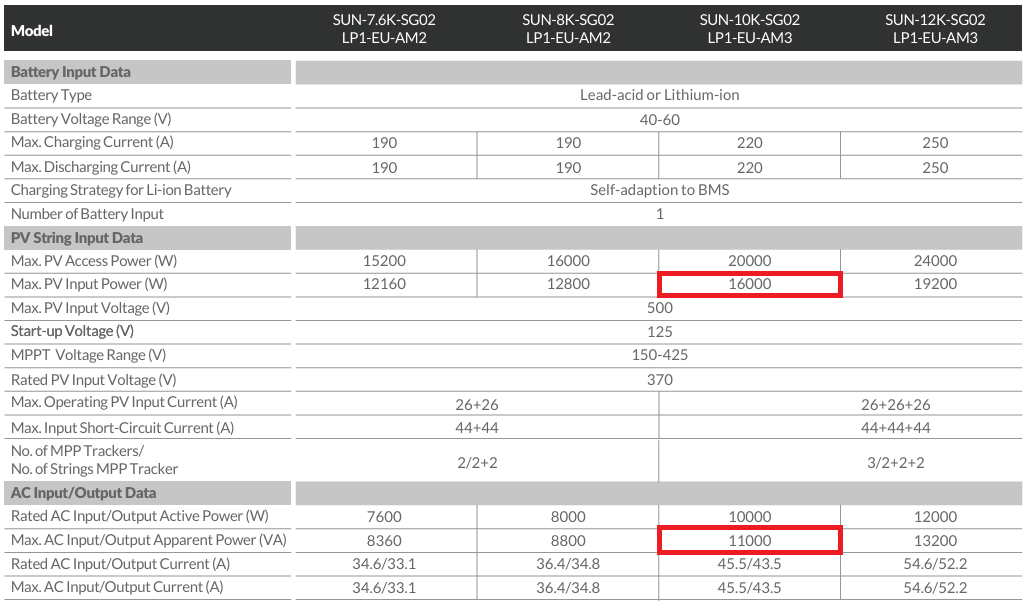
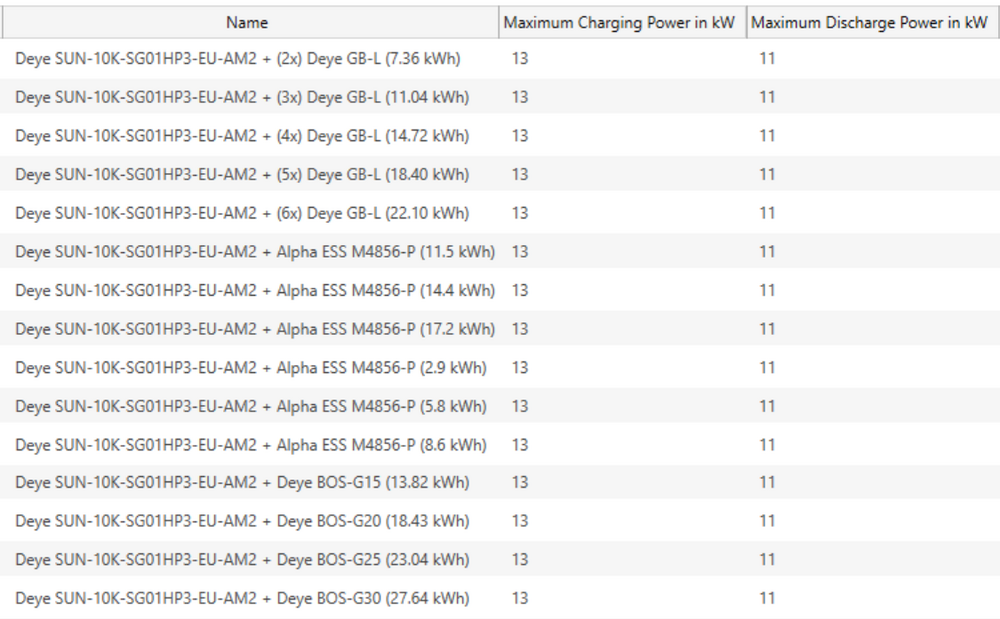
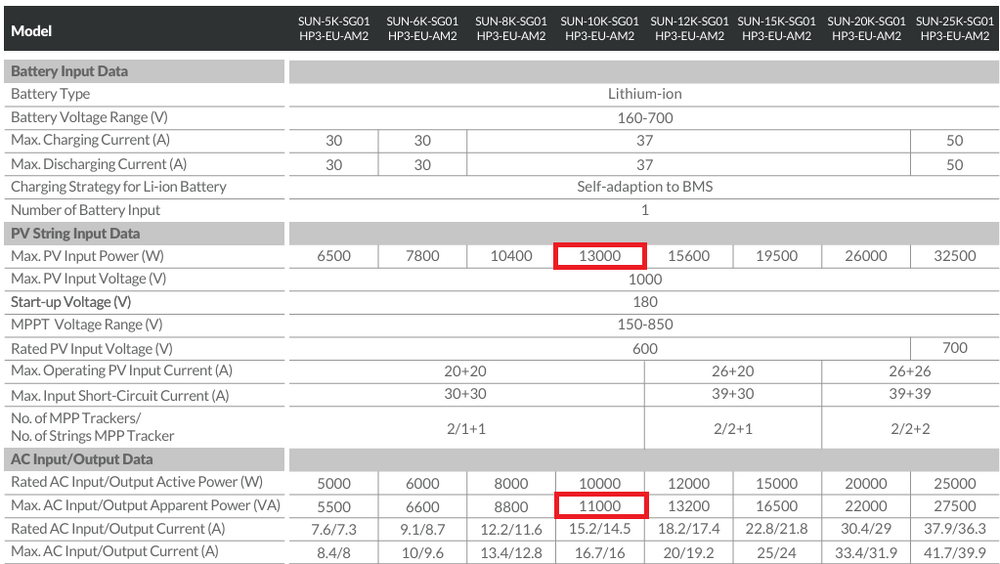
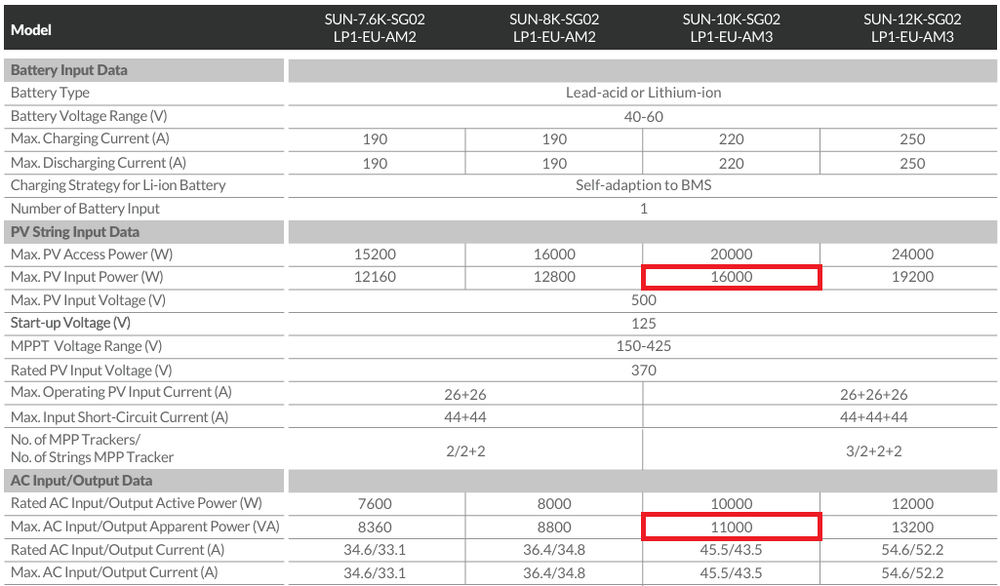
Hello, Thank you for your inquiry. The maximum charge and discharge power of a battery system is limited by either the inverter or the battery storage unit. We will contact the manufacturer, Deye, and ask them to supply the missing SUN-10K-SG02LP1 battery systems. For comparison: The SUN-10K-SG01HP3 battery systems have a maximum charging power of 13 kW and a maximum discharge power of 11 kW. Consequently, the SUN-10K-SG02LP1 battery systems would have a maximum charging power of 16 kW and a maximum discharging power of 11 kW.
-
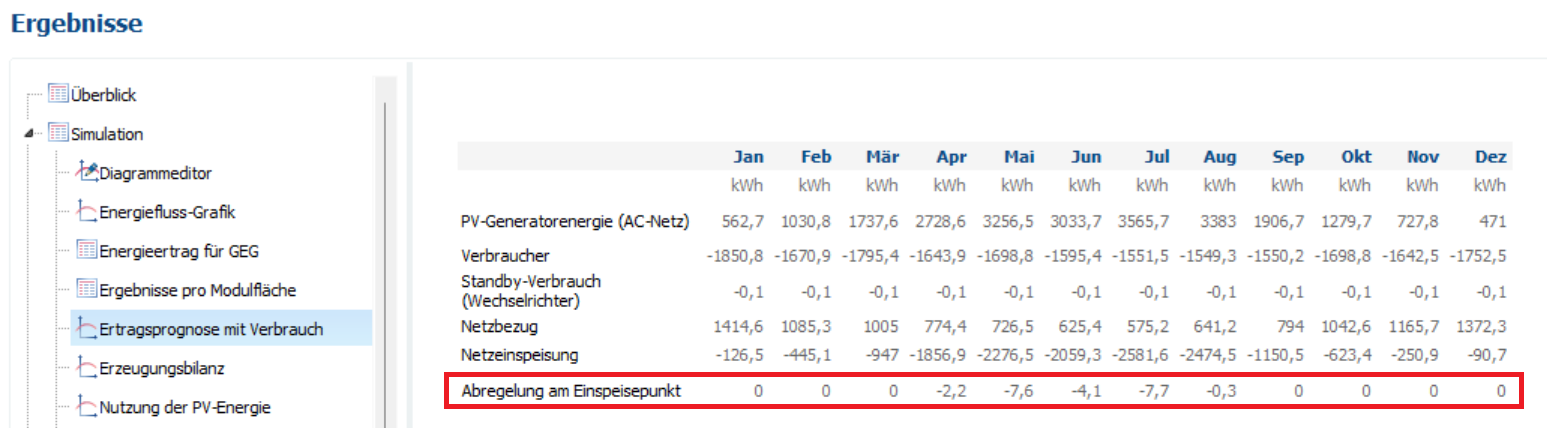
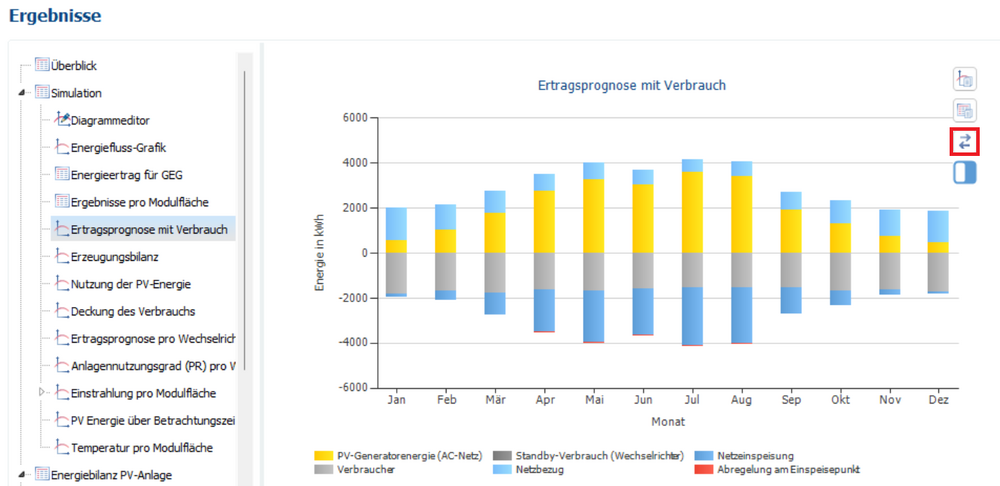
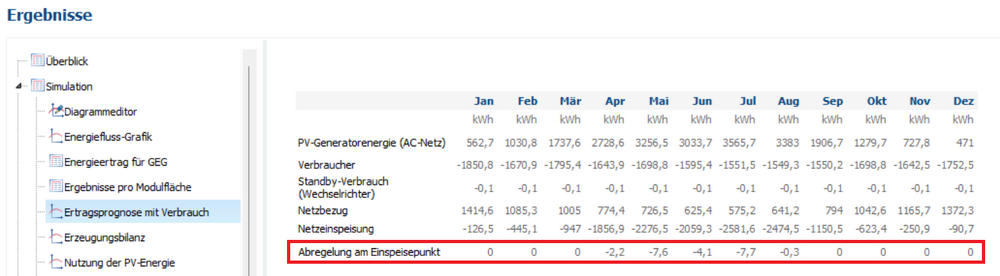
Hallo, vielen Dank für deine Nachricht. Rechts neben dem Diagramm "Ertragsprognose mit Verbrauch" findest du den Button "Zur Tabelle wechseln": Die Abregelung am Einspeisepunkt wird in kWh pro Monat ausgegeben:
-
Dear Sharjeel, Thank you for your inquiry. When creating a new inverter dataset, you typically face the issue of not knowing the inverter's efficiency curve, as it is not published on the datasheet. On May 29, Sungrow updated the SG125CX-P2 and added the new SG125CX-P3. Which inverter are you missing? Please provide the exact model designation or send us a datasheet. We will then contact the manufacturer to request that the information be added or updated.
-
Dear Mark, Thank you for your message. For lithium iron phosphate batteries, the reference value used to calculate discharge cycles is based on a DoD of 40%. This results in the following factors for the discharge cycles: DoD Value 0.2 2.206563 0.4 1 0.6 0.598166 0.8 0.397315