hotline_oh
-
Posts
650 -
Joined
-
Last visited
-
Days Won
39
Everything posted by hotline_oh
-
Guten Tag, vielen Dank für Ihre Anfrage. Der Hersteller hat die neuen Produkte in unsere Datenbank eingetragen und sie stehen Ihnen mit dem Datenbank-Update vom 15. Mai zur Verfügung.
-

Keine Anzeige der Abregelung obwohl negative Strompreise angegeben sind
hotline_oh replied to NWRIW's topic in PV*SOL
Guten Tag, vielen Dank für deine Anfrage. In den Zeiten mit negativen Strompreisen wird nicht abgeregelt. Es wird weiter eingespeist, nur eben nicht vergütet. Laut Solarspitzengesetz gibt es dafür dann einen Kompensationszeitraum, für den im Anschluss an die 20 Jahre die Einspeisevergütung noch weitergezahlt wird. Das wird in der Software automatisch berücksichtigt und in den Ergebnissen ausgegeben. Weitere Informationen dazu findest du in unseren FAQ. -
Wie erstelle ich ein Gebäude mit Zwei unterschiedlich hohen Dächern?
hotline_oh replied to Rio55's topic in PV*SOL
Hallo, vielen Dank für deine Anfrage. Ein solches Gebäude setzt du aus zwei Pultdächern zusammen: Zum gemeinsamen Verschalten wählst du im Reiter "Modulverschaltung" den Button "Alle unverschalteten Module verschalten" und im Fenster für die Wechselrichterverschaltung wählst du "Modulflächen gemeinsam verschalten", wie in unseren FAQ beschrieben.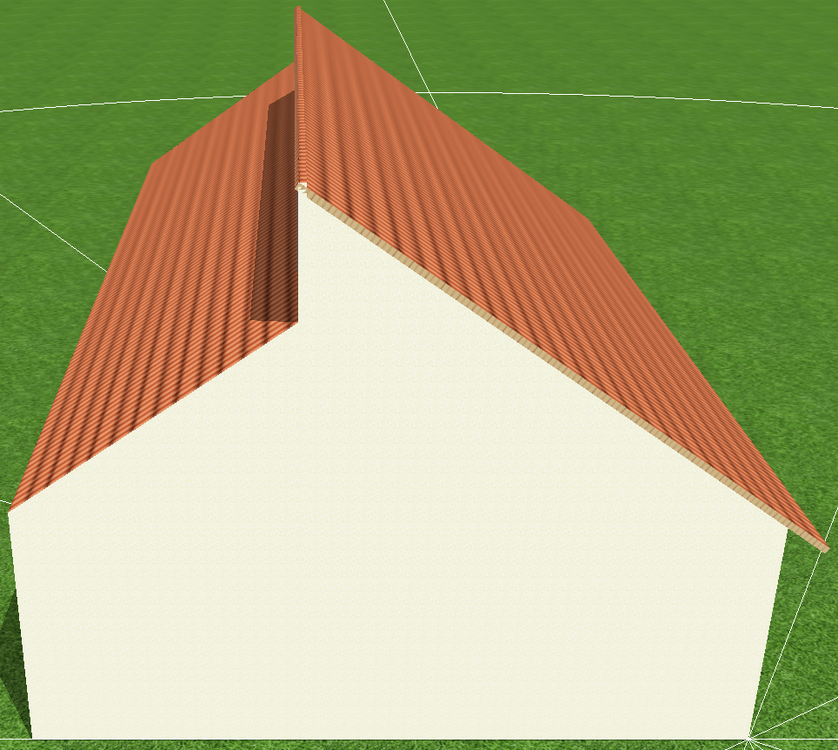
-
SUN-8K-SG04LP3-EU Daten in der Datenbank evtl. falsch
hotline_oh replied to Sven Weber's topic in PV*SOL
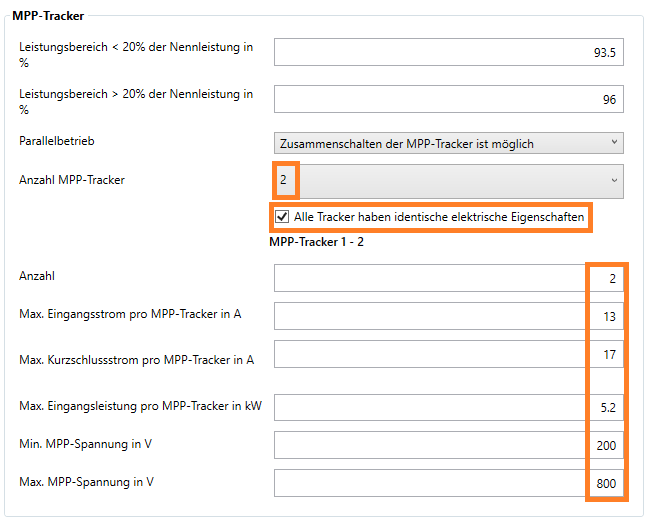
Guten Tag, vielen Dank für deine Nachricht. Wir geben dir recht, dass die Daten des Deye SUN-8K-SG04LP3-EU teilweise fehlerhaft eingetragen worden sind. Laut Datenblatt hat der Wechselrichter einen max. Kurzschlussstrom von 34 A nur zwei DC-Eingänge nur zwei MPP-Tracker (mit identischen elektrischen Eigenschaften) einen max. Eingangsstrom pro MPP-Tracker von 13 A einen max. Kurzschlussstrom pro MPP-Tracker von 17 A eine max. Eingangsleistung pro MPP-Tracker von 5,2 kW Wir werden den Hersteller kontaktieren und um Korrektur der Daten bitten. Du hast die Möglichkeit, den Wechselrichter-Datensatz zu kopieren. Im neu abgespeicherten Datensatz kannst du die Änderungen manuell vornehmen.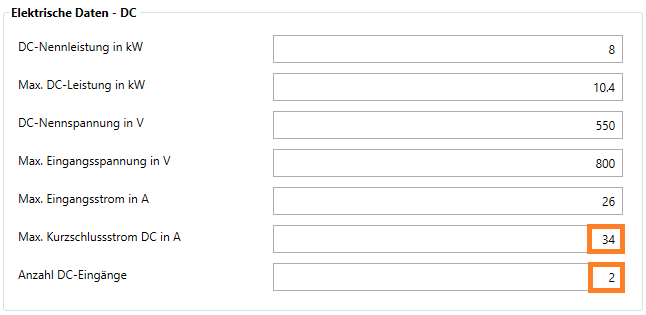
-
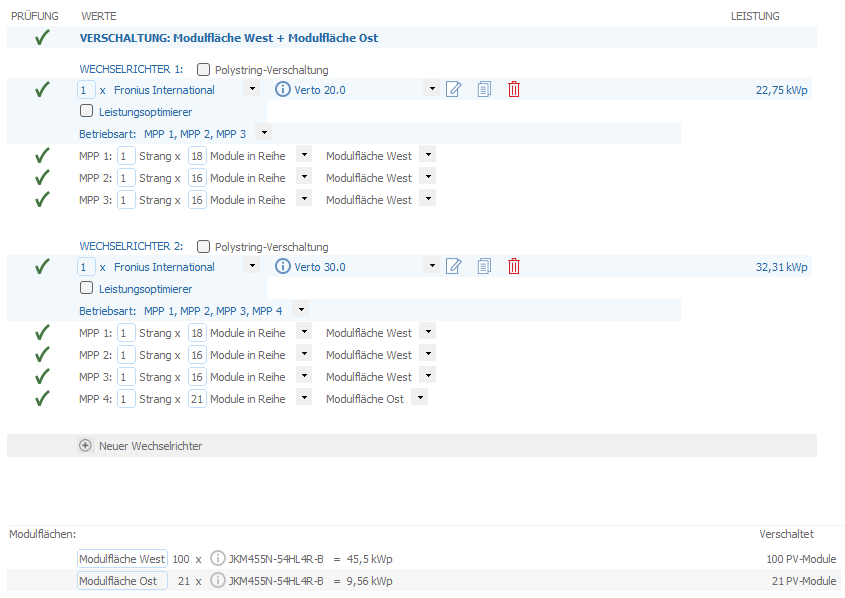
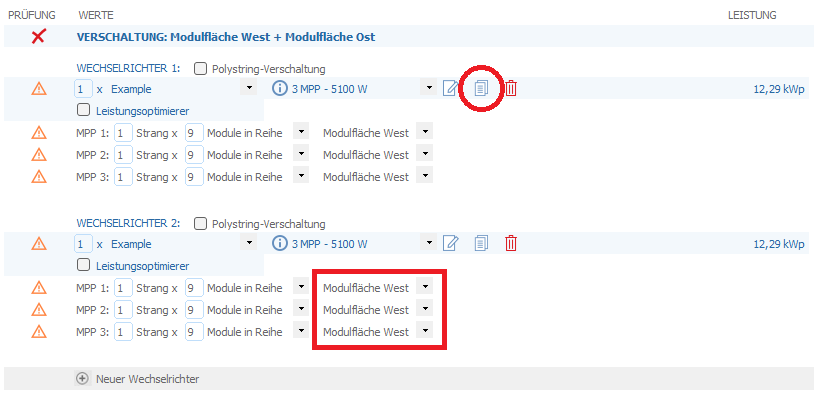
Hallo Russell, vielen Dank für deine Anfrage. Mit welcher Programmversion arbeitest du? In der Version 2026 R1 gab es einen Bug, dass beim Verschalten mehrerer Modulflächen ab dem zweiten Wechselrichter keine Modulflächen mehr zugeordnet werden konnten. Dieser Bug wurde mit der Version 2026 R2 im Januar 2026 behoben. Wenn du keine Möglichkeit hast, ein Update durchzuführen, kannst du den ersten Wechselrichter duplizieren: Wir würden allerdings davon abraten, Module unterschiedlicher Ausrichtung an einen gemeinsamen MPP-Tracker anzuschließen. Diese Verschaltung beispielsweise kommt ohne Polystring-Verschaltung aus:
-
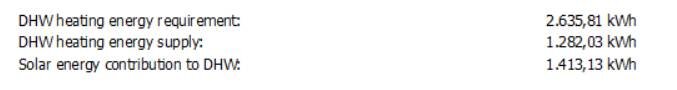
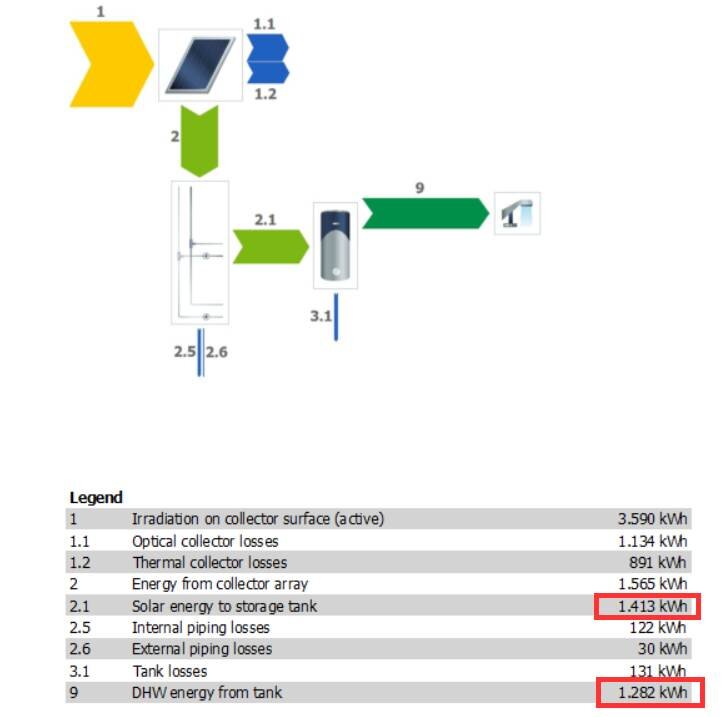
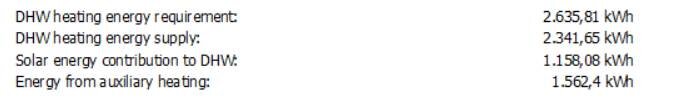
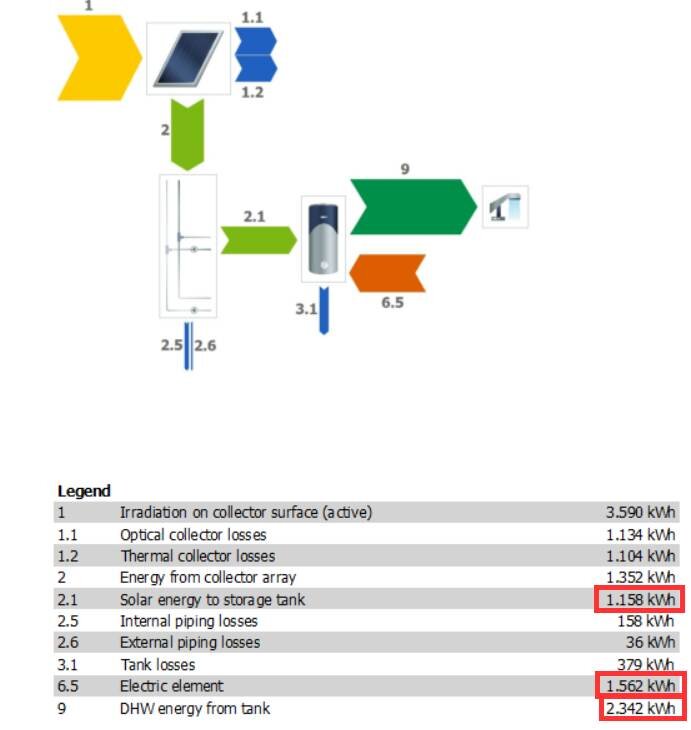
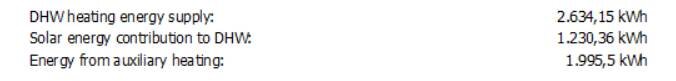
Dear Koffi, Thank you for your inquiry. Demand and supply are only shown separately if there is a shortfall. If both are the same, everything is covered, and only one value is displayed. Example 1: Small storage tank without heating element Demand = 2635 kWh/year Solar energy supplied to storage tank = 1413 kWh/year Storage tank supplied to domestic hot water = 1282 kWh/year 1400 kWh shortfall Example 2: Small storage tank with small heating element Demand = 2635 kWh/year Solar to storage tank = 1158 kWh/year Heating element = 1562 kWh/year Storage tank to DHW = supplied 2342 kWh/year There is still a shortfall of approximately 300 kWh, therefore "Requirement" is also displayed. Example 3: Large storage tank with large heating element Solar (1230) + Heating element (1996) = Energy consumption (3226 kWh) Energy consumption (3226) – Storage losses (592) = Energy delivered (2634 kWh) The "Requirement" value is no longer displayed, as the demand has been met. If you have further questions, please let us know the exact TSOL version and send us screenshots and, ideally, the project file (*.tsprj).
-
Dear Ryan, Thank you for your inquiry. Unfortunately, it is not possible to change the order of the two tracker types. We will forward your request to our development team.
-
Dear José Cabrera, Thank you for your inquiry. In PV*SOL, a battery system always consists of a battery inverter and a battery. If you are using a hybrid inverter that you already selected when configuring the modules, then select the same device a second time when selecting the battery system. We contacted the manufacturer and asked them to add the missing battery system. Unfortunately, the manufacturer has not yet replied. We are also unable to set up the battery system ourselves because we lack information about the inverter that is not included in the data sheet. We will contact the manufacturer again.
-
Volleinspeisung & Überschusseinspeisung zusammen planen
hotline_oh replied to Tempest's topic in PV*SOL
Hallo Steve, vielen Dank für deine Anfrage. Derzeit ist es leider noch nicht möglich, beide Varianten gemeinsam in einem Projekt abzubilden. Beide Anlagenteile müssen in zwei separaten Projekten simuliert werden. -
Dear Mark, Thank you for your inquiry. Unfortunately, the editing options for the single-line diagram are limited. You can only make the desired changes manually using other software. You have the option to export the single-line diagram as a PDF, PNG, or SVG file. We have forwarded your requests to our development team.
-
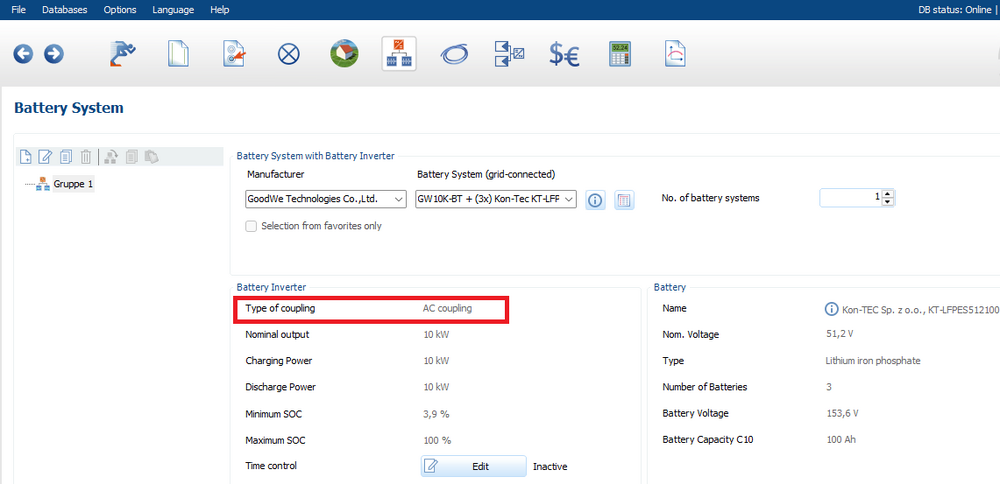
Dear Mark, Thank you for your inquiry. In PV*SOL, we distinguish between DC-coupled and AC-coupled battery systems. We assume you intend to use a hybrid inverter with an AC-coupled battery system. You must select the hybrid inverter twice in the program: once when configuring the modules (as the PV inverter) and again when selecting the battery system. When selecting the battery system, please ensure you choose a battery system with AC coupling.
-
Verluste durch Laden/Entladen nicht nachvollziehbar
hotline_oh replied to Dr.Klein's topic in PV*SOL
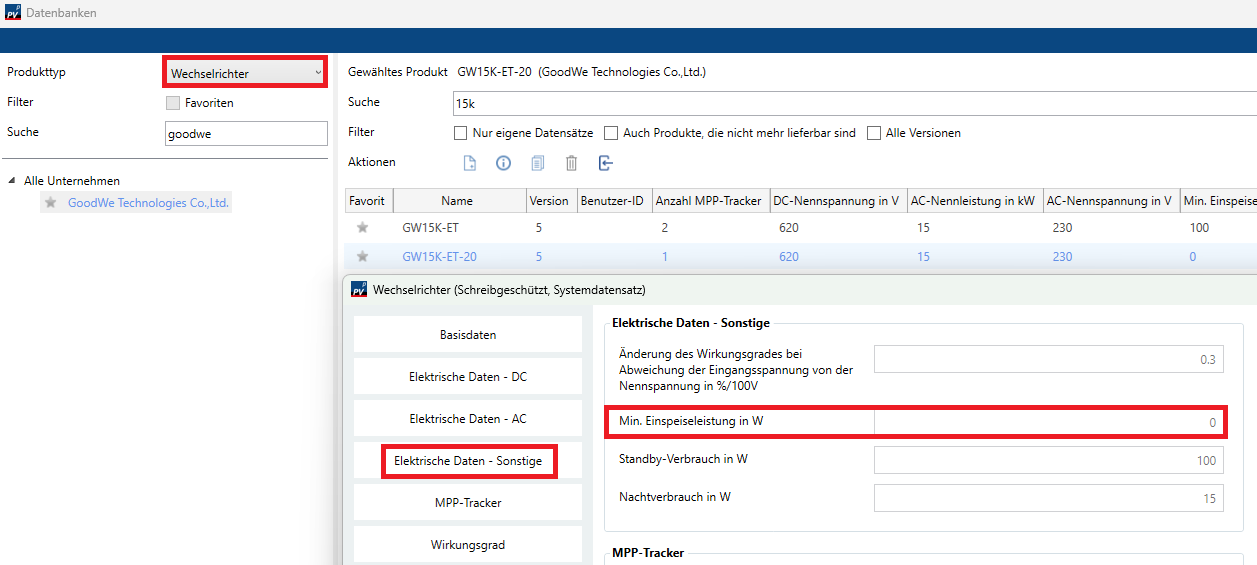
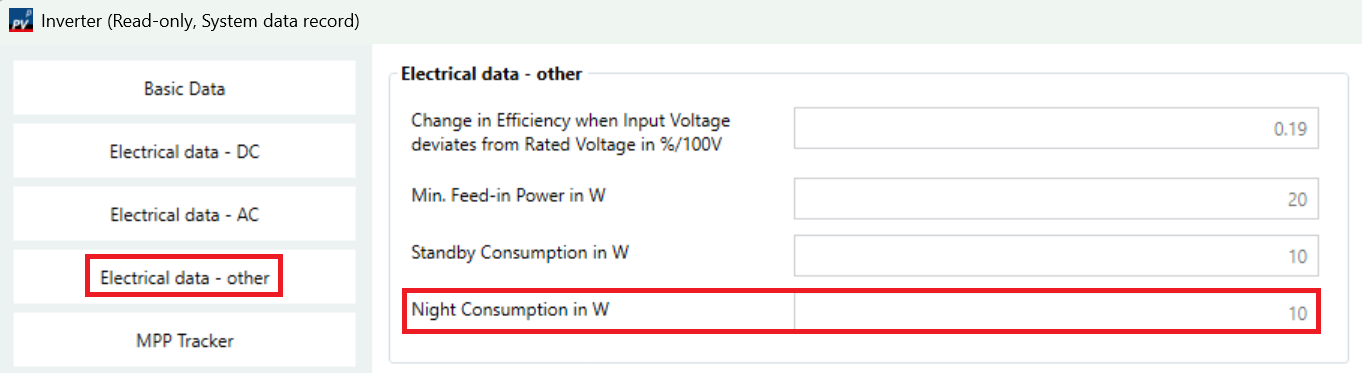
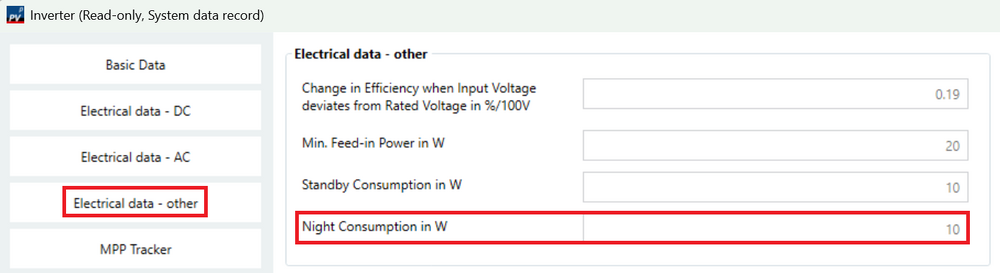
Hallo Oliver, vielen Dank für deine Nachricht. Es handelt sich um Batteriesysteme mit DC-Zwischenkreis-Kopplung, deshalb muss der Wechselrichter in Betrieb sein, wenn Energie aus der Batterie bezogen werden soll. Bei sehr kleinen Verbräuchen, die (wie du schreibst) jede Nacht auftreten, arbeitet der Goodwe-Wechselrichter mit einem sehr schlechten Umwandlungswirkungsgrad. Die Batterie wird unnötig weit entladen. Zu einem späteren Zeitpunkt steht entsprechend weniger Batterieenergie zur Verfügung, weshalb im Goodwe-Szenario mehr Netzstrom bezogen werden muss als im Fronius-Szenario. Den Parameter "Min. Einspeiseleistung in W" findest du nicht in der Batteriesystem-Datenbank, sondern in der Wechselrichter-Datenbank, unter "Elektrische Daten - Sonstige":
-
Dear Anders, Thank you for your message. The development team reads along in this forum, and you can enter feature requests directly into this list.
-
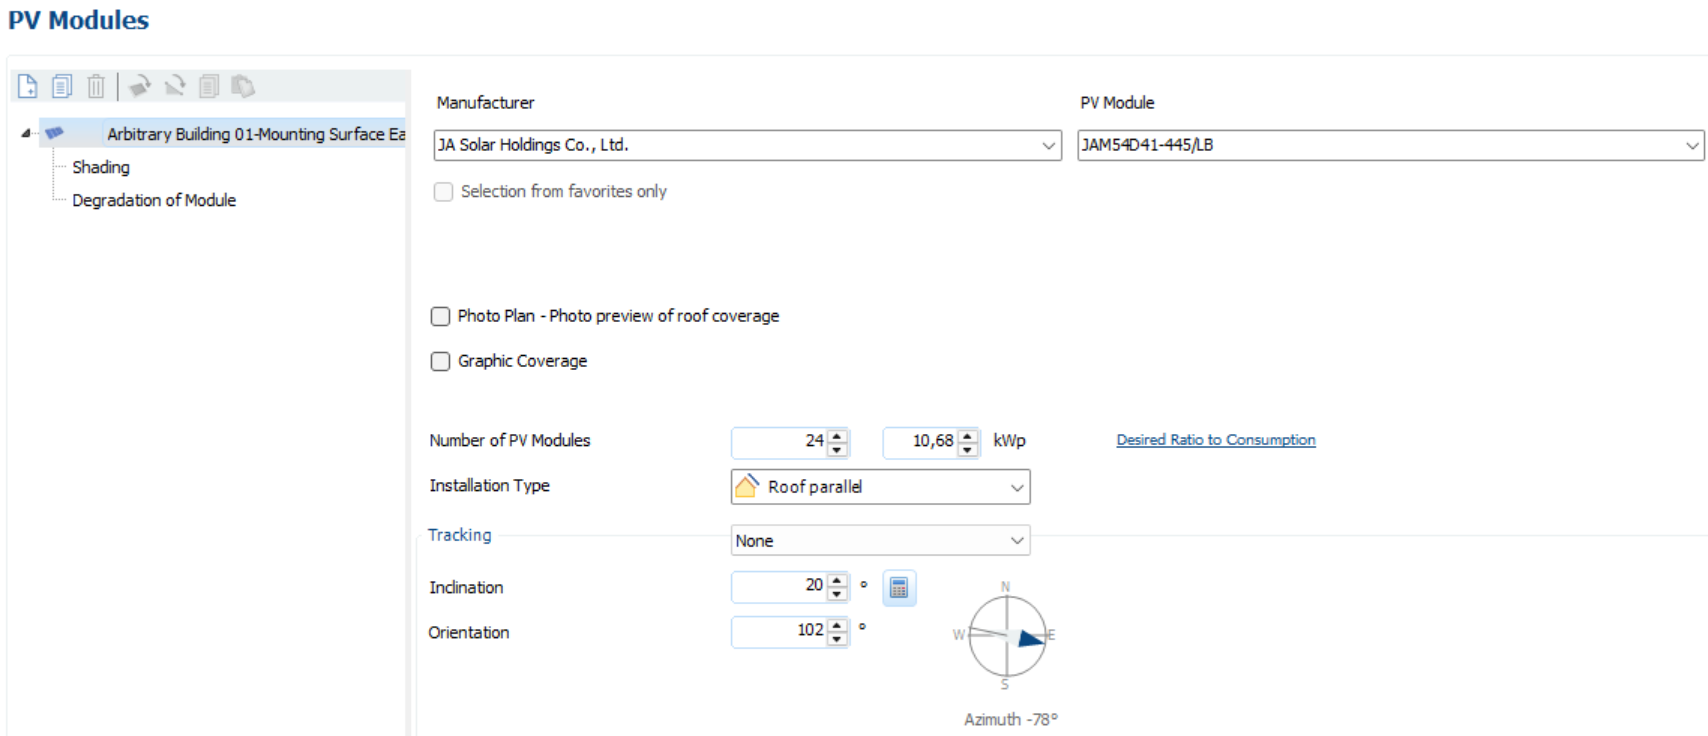
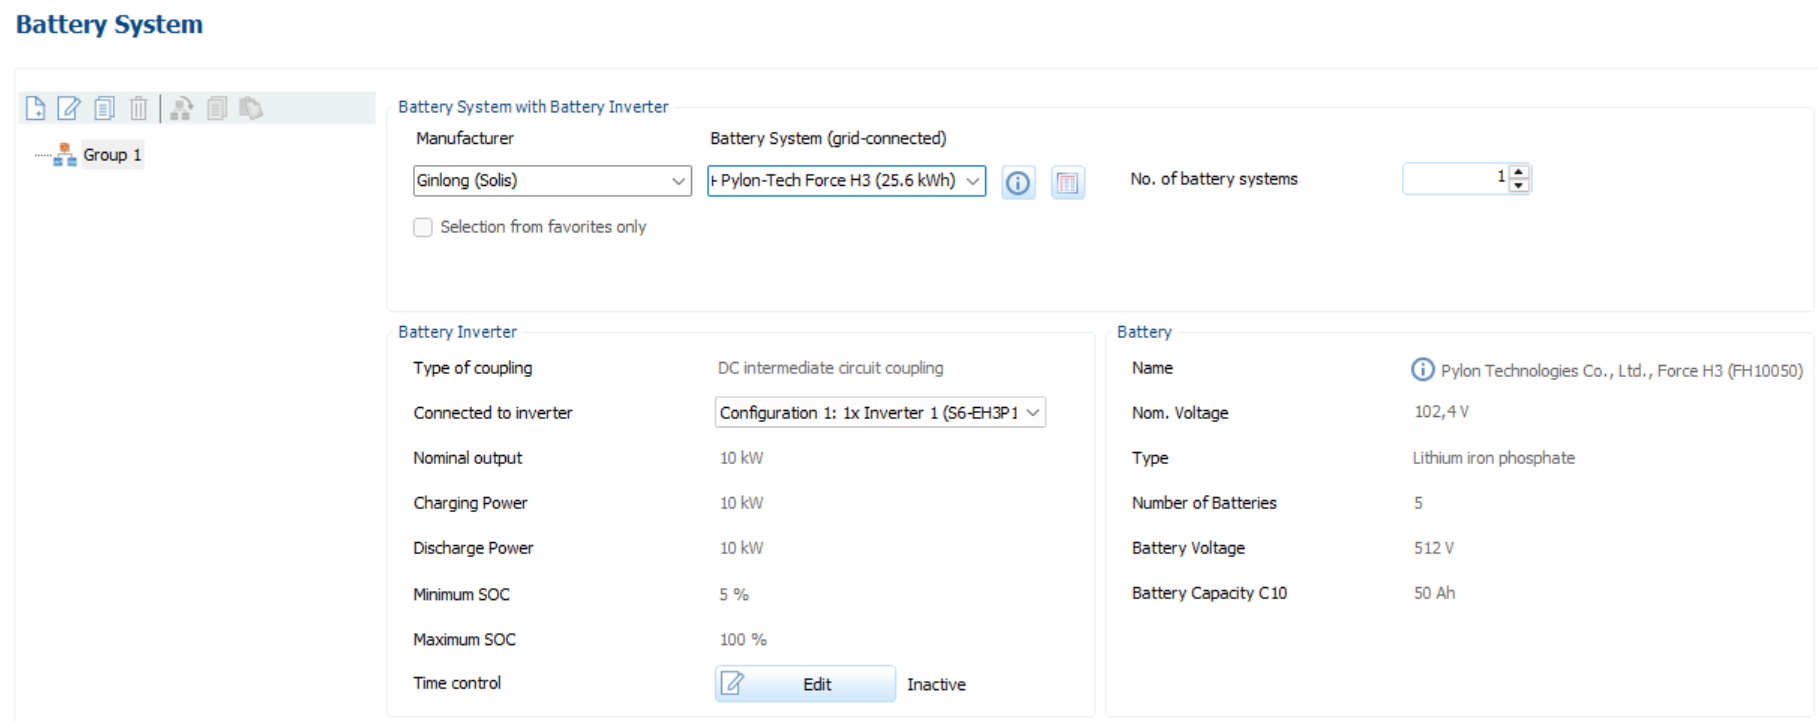
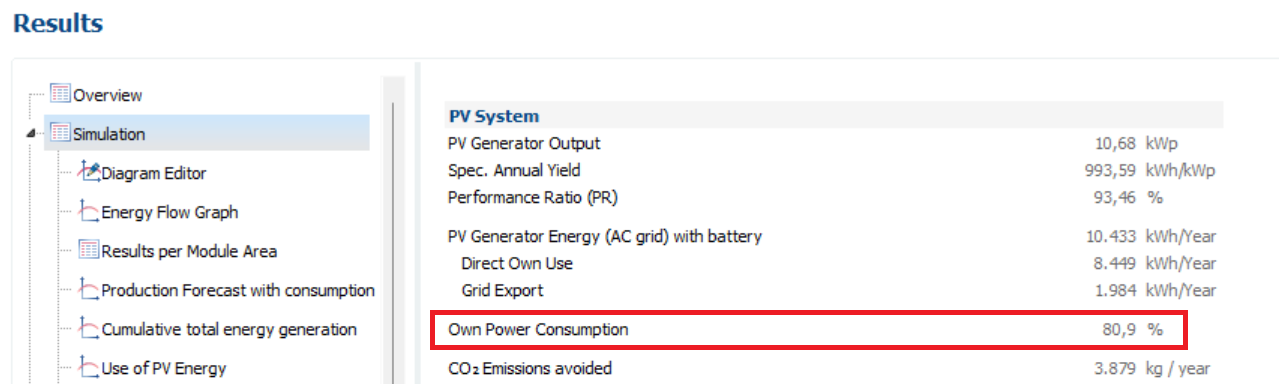
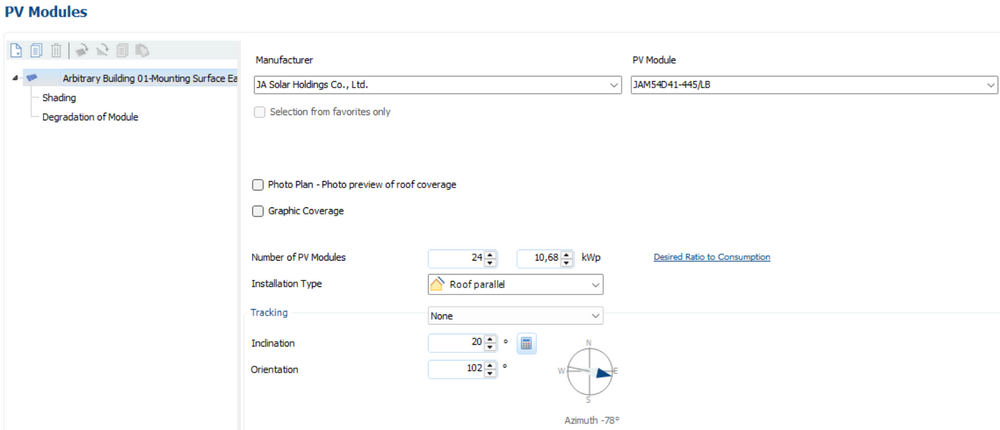
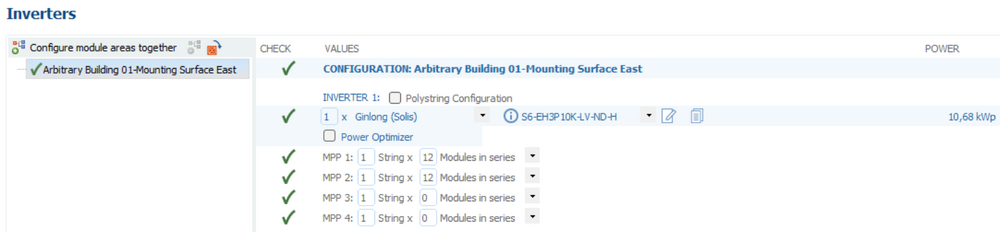
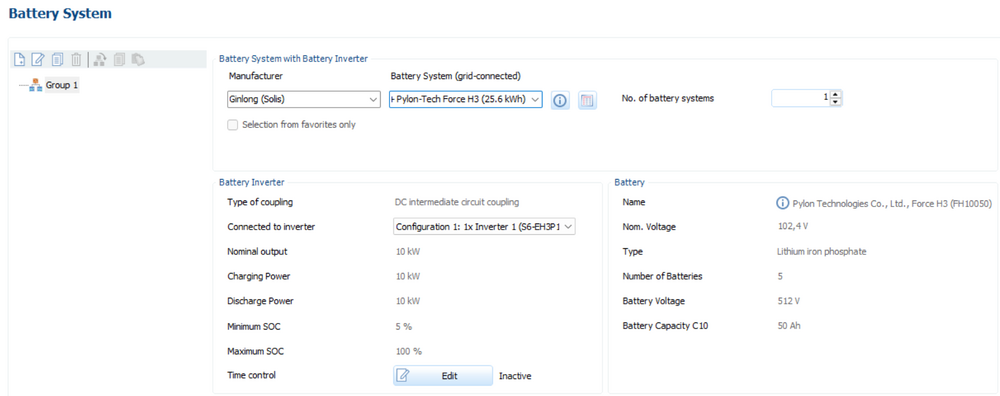
Dear Anders, Thank you for your inquiry and for sharing the project file. Unfortunately, it's not possible to determine the number of PV modules based on a predefined self-consumption rate. We recommend switching from 3D planning to 2D planning. There, you can quickly simulate different system sizes by entering the new number of modules and test whether the desired self-consumption rate is achieved. In your case, a self-consumption rate of 80 percent is achieved with 24 PV modules. (Please ensure you have selected the appropriate battery system. The S6-EH3P10K-LV-ND-H + Pylon-Tech Force H3 (25.6 kWh) battery system is compatible with the S6-EH3P10K-LV-ND-H PV inverter.) Currently, AI control for battery charging and discharging is not included in the calculation. We will forward your suggestion to our development team. Please find enclosed the project file we have edited. partdesign VAL.pvprj

-
Dear Michael, Thank you for your inquiry. Unfortunately, nighttime consumption can only be entered for PV inverters, not for battery systems. We will forward this request to our development team. You cannot include an inverter without connected strings. A nighttime consumption of 10 W is currently configured for the Fronius Symo GEN24 10.0. If you know the nighttime consumption of your battery system, you can copy the data set for the Fronius Symo GEN24 10.0 (right-click --> Copy) and save it again. You can then make changes in the newly created data set and enter a higher nighttime consumption value.
-
Guten Tag, vielen Dank für Ihre Anfrage. Bitte senden Sie uns Ihre Projektdatei (*.pvprj) an hotline@valentin-software.com, dann sehen wir uns das mal an.
-
Verluste durch Laden/Entladen nicht nachvollziehbar
hotline_oh replied to Dr.Klein's topic in PV*SOL
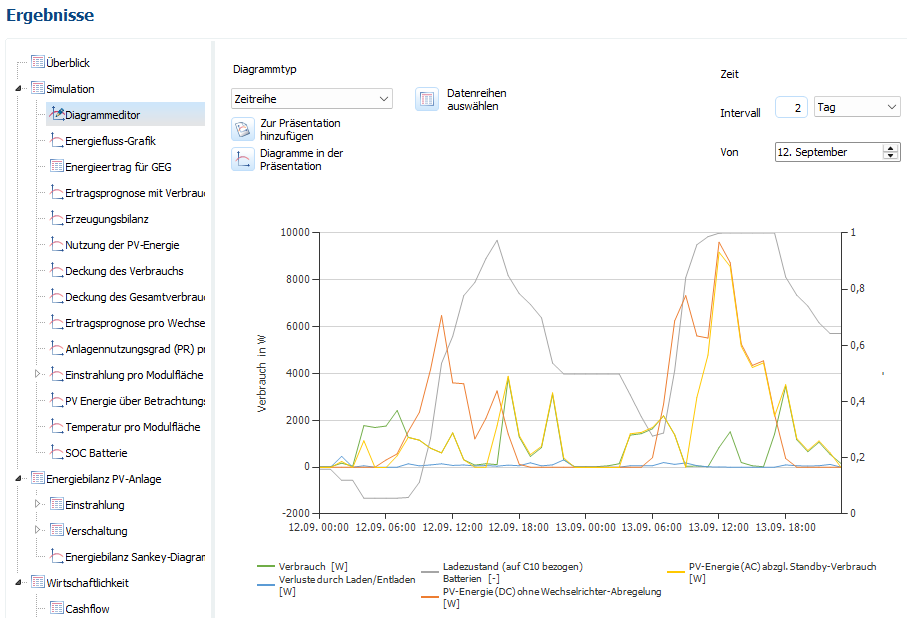
Hallo Oliver, vielen Dank für deine Nachricht. Der Goodwe-Wechselrichter arbeitet im Bereich von 0 bis 312 W mit einem sehr schlechten Wirkungsgrad. Im Diagramm-Editor kannst du dir das ansehen: Die Verluste durch Laden/Entladen treten vor allem in den Nachtstunden auf (blaue Linie). In dieser Zeit wird die Batterie viel weiter entladen (graue Linie). Der Fronius-Wechselrichter ist unterhalb von 312 W ausgeschaltet. Der Bereich, in dem der Wechselrichter mit einem schlechten Wirkungsgrad arbeiten würde, wird ausgespart. Deshalb wird die Batterie in den Nachtstunden weniger entladen. Aus diesem Grund arbeitet das System mit Fronius insgesamt effizienter und liefert am Ende den höheren Ertrag. Goodwe in der Nacht vom 12. auf den 13. September: Fronius in der Nacht vom 12. auf den 13. Septemer: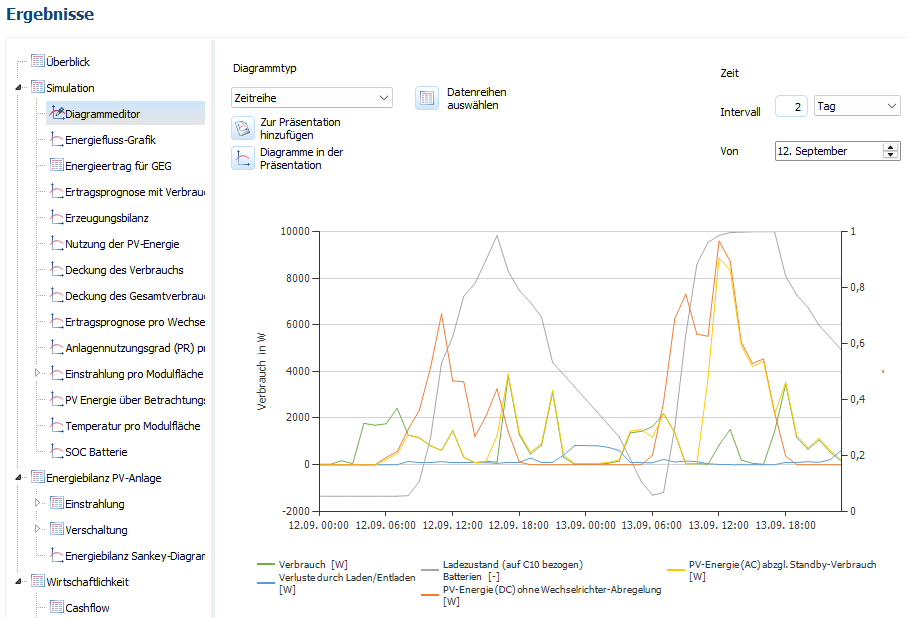
-
Unterschiedliche Tarife Sommer / Winter für die Einspeisevergütung
hotline_oh replied to Sinä's topic in PV*SOL
Hallo Jonas, vielen Dank für deine Anfrage. Hochtarif- und Niedertarif-Zeiten für die Einspeisevergütung können leider nicht erfasst werden. Wir haben deine Anforderung an unser Entwicklungsteam weitergegeben. Die Berücksichtigung von dynamischen Stromtarifen wird voraussichtlich mit dem Software-Release im November 2026 möglich sein. -
Dear Jakubson, Thank you for your inquiry. Please send your project file to hotline@valentin-software.com so that we can take a closer look at it. If the file is too big, please use WeTransfer, SwissTransfer or similar.
-
3D Gebäude und Gelände im CityGML Format importieren
hotline_oh replied to Rolf Hennig's topic in PV*SOL
Sehr geehrter Herr Hennig, vielen Dank für Ihre Anfrage. Wir haben keine Erfahrung mit der Umwandlung von CityGML-Dateien in obj-Dateien. Mit einer Google-Suche haben wir zwei CityGML-Converter für die Umwandlung in STL-Dateien gefunden, den FZKViewer und den CityGML Converter. STL-Dateien können Sie in PV*SOL premium importieren. Falls das nicht funktioniert, könnten Sie noch probieren, die CityGML-Datei zunächst in eine IFC-Datei umzuwandeln. Das IFC-Format wird zwar von PV*SOL premium nicht unterstützt, aber eine IFC-Datei kann leichter in eines der oben gelisteten Formate umgewandelt werden. -
FoxESS G-MAX: Unplausible Wirkungsgrad Kennlinen
hotline_oh replied to Christoph Franz-Riegler's topic in PV*SOL
Sehr geehrter Herr Franz-Riegler, vielen Dank für Ihre Anfrage. Wir stimmen Ihnen zu, dass die Wirkungsgrad-Kennlinie des FoxESS GM215kWh-100kW eher ungünstig ist. Sie stimmt aber mit der Datenblatt-Angabe überein: Wir werden den Hersteller kontaktieren und um Überprüfung bitten.
-
Hallo Bob, vielen Dank für deine Anfrage. Mit deiner Seriennummer kannst du PV*SOL premium in der Version 2025 R2 nutzen. Wir haben dir eine Nachricht mit dem Download-Link zugeschickt.
-
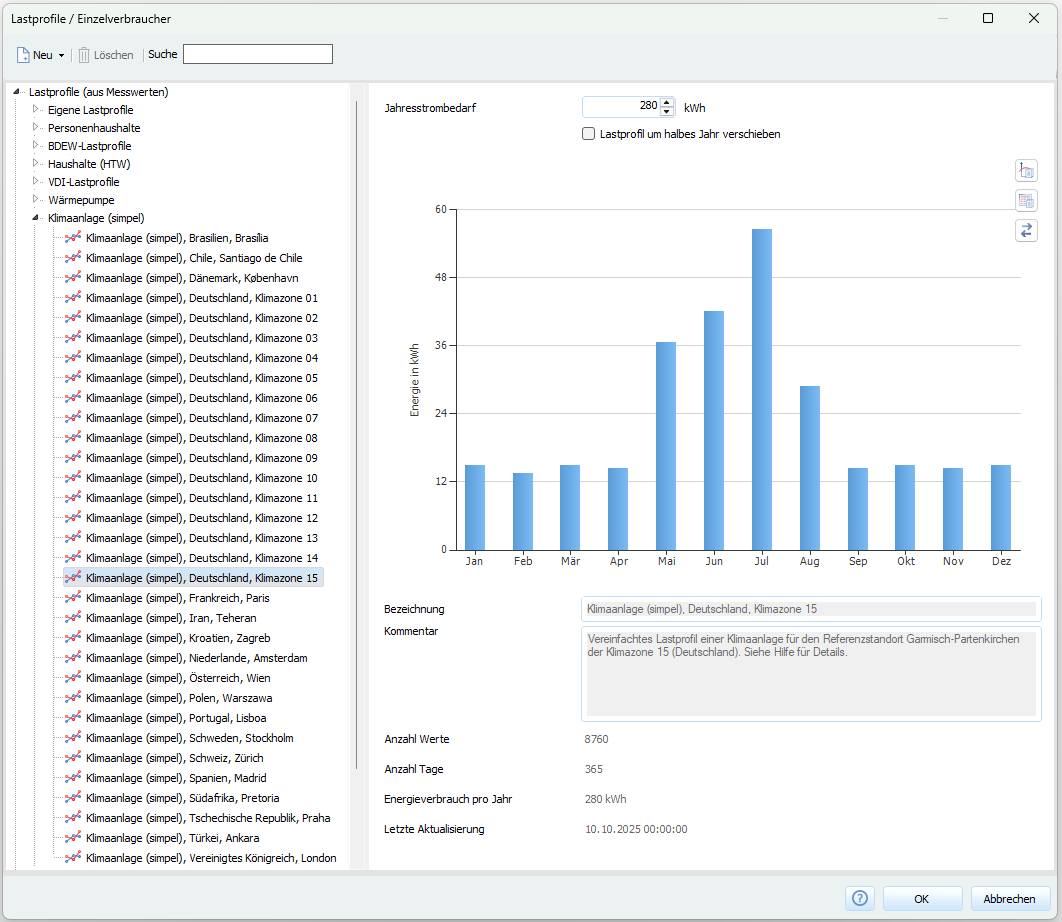
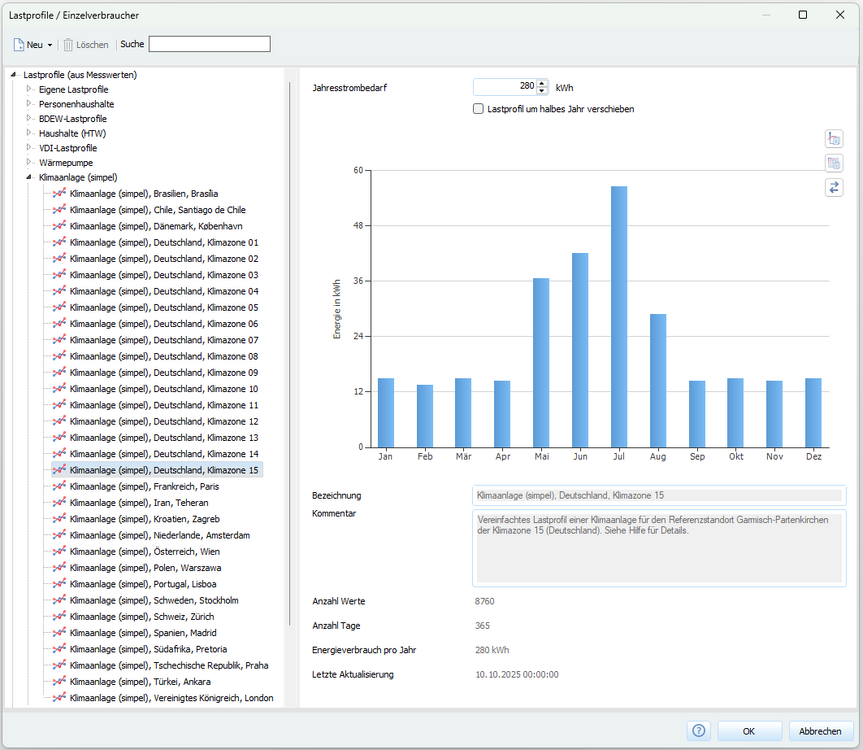
Ergänzung: Lastprofile für Klimaanlagen stehen seit dem Software-Release PV*SOL premium 2026 R1 zur Verfügung:

-
Ergänzung: Lastprofile für Klimaanlagen stehen seit dem Software-Release PV*SOL premium 2026 R1 zur Verfügung:
-
Einspeisevergütung pro Jahr und Betrag der jährlichen Netzeinspeisung
hotline_oh replied to Philipp IW's topic in PV*SOL
Hallo Philipp, vielen Dank für deine Nachricht. Wir haben deine Anregung ans Entwicklungsteam weitergegeben und danken dir für den Hinweis.