hotline_oh
-
Posts
649 -
Joined
-
Last visited
-
Days Won
39
Everything posted by hotline_oh
-
 Die Modulneigung und -ausrichtung der Planung wird von 2 Faktoren beeinflusst, zum einen durch die Gestellneigung und zum anderen durch die Neigung des Daches. Beide Neigungen zusammen ergeben dann eine resultierende Modulneigung und -orientierung. Man kann sich das wie folgt verdeutlichen: Wenn man eine Kugel auf die Modulfläche legen würde, dann wird sie aufgrund der zwei Neigungen nicht genau in die Richtung der Gestellaufständerung rollen, sondern davon in Richtung der Dachneigung abweichen. Dies ist die resultierende Modulorientierung. Je größer dabei die Dachneigung ist, desto größer ist die Abweichung der resultierenden Modulorientierung von der Orientierung des Gestells. Wenn Sie zum Beispiel auf einem Westdach ein Gestell nach Süden aufgeständert haben, dann rollt die Kugel nicht nach Süden, sondern nach Südwesten.
 -
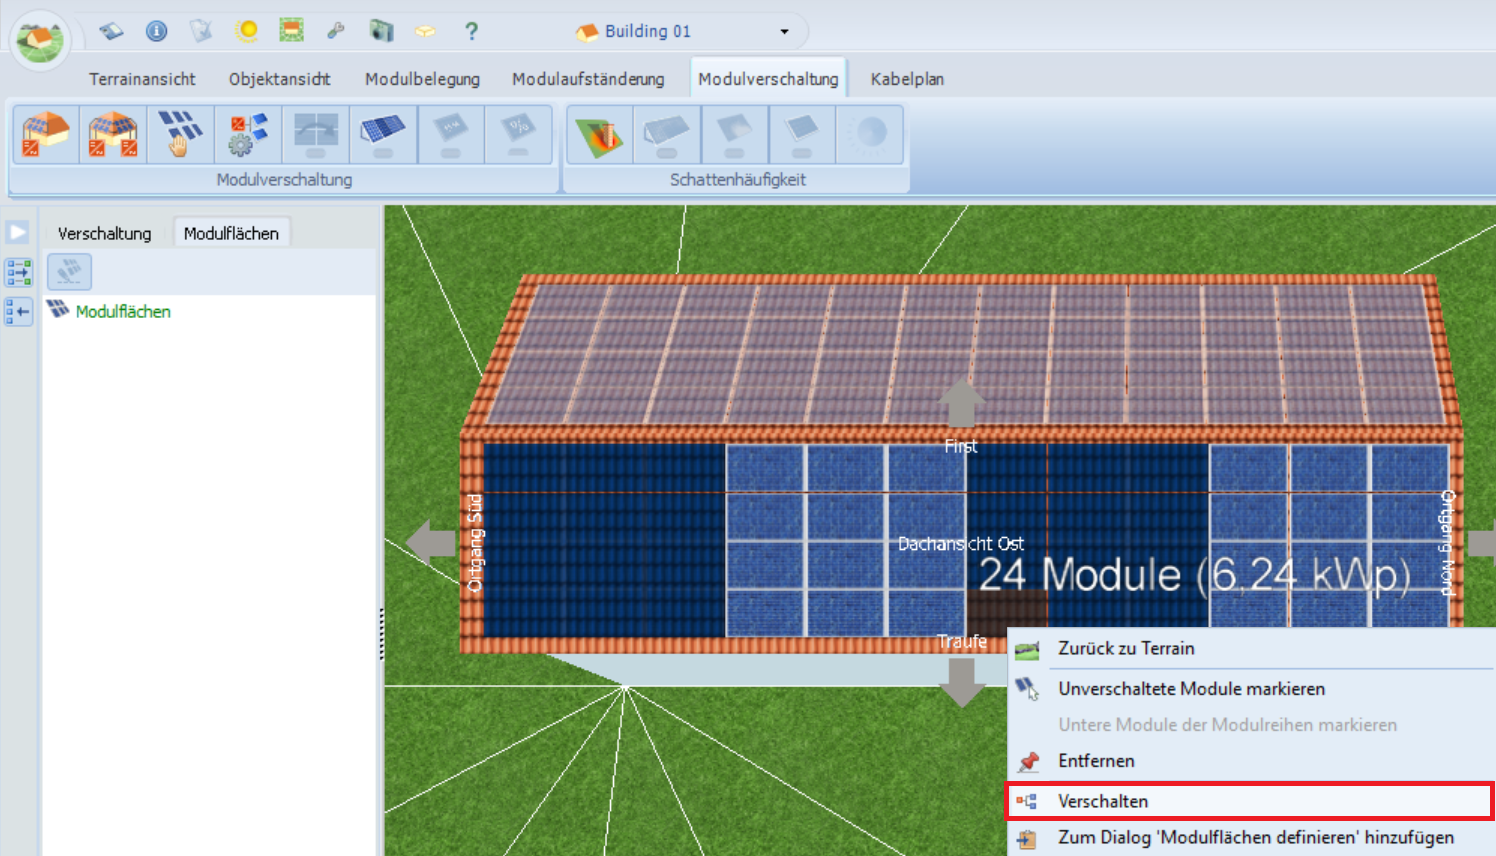
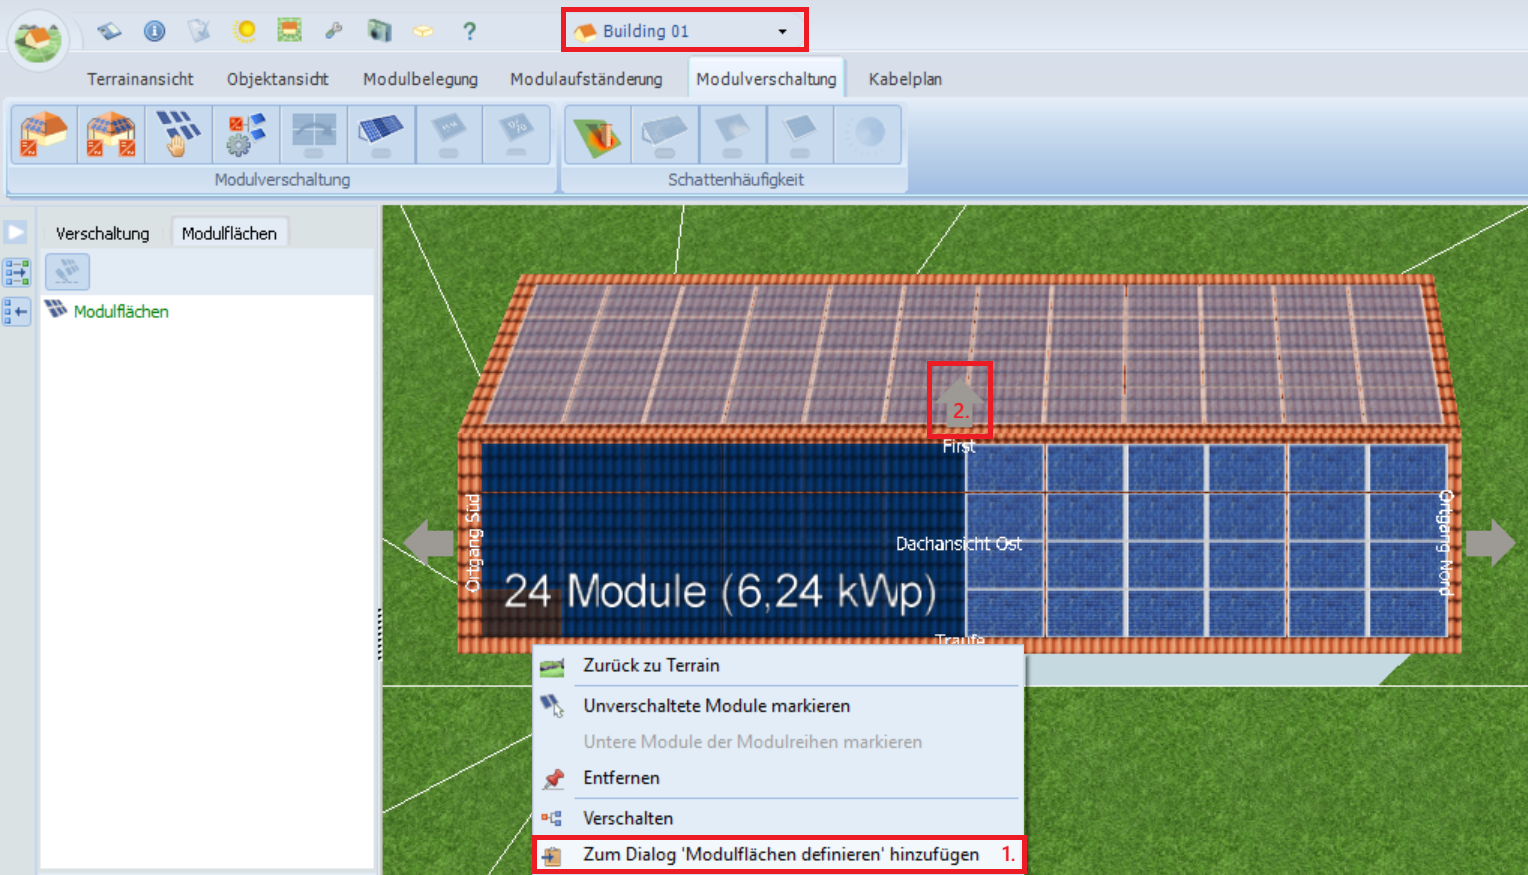
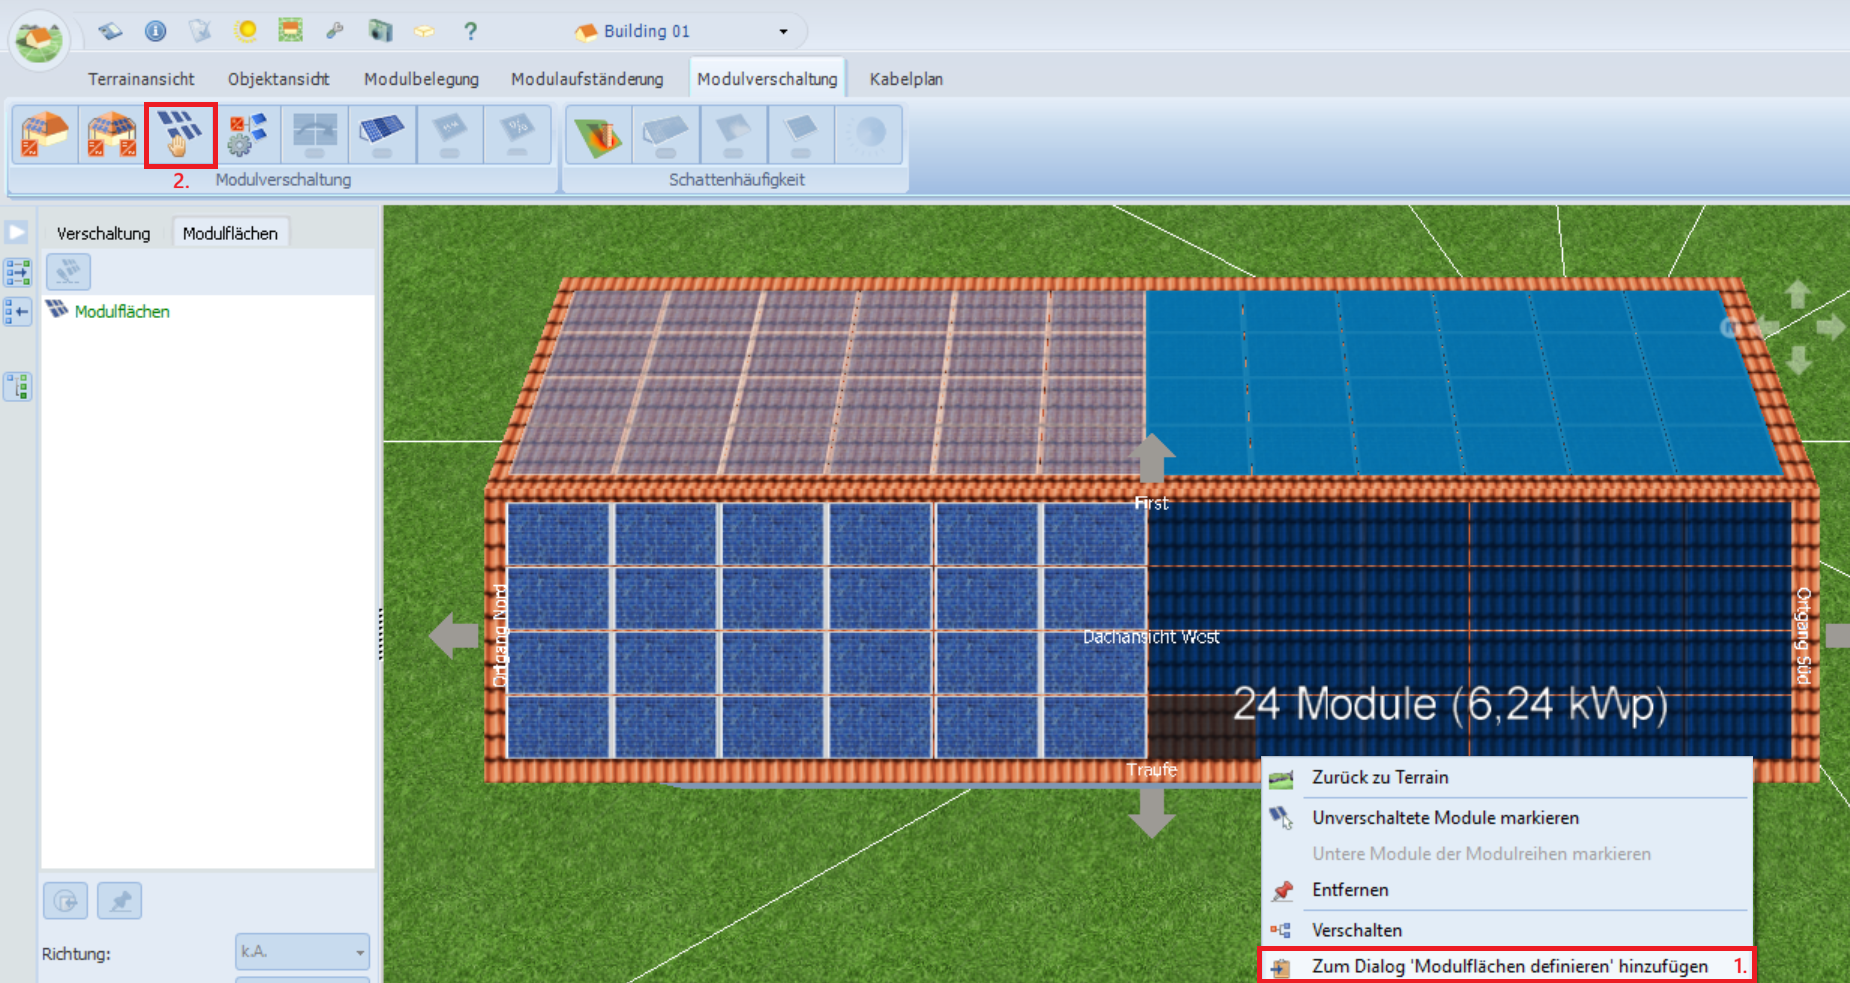
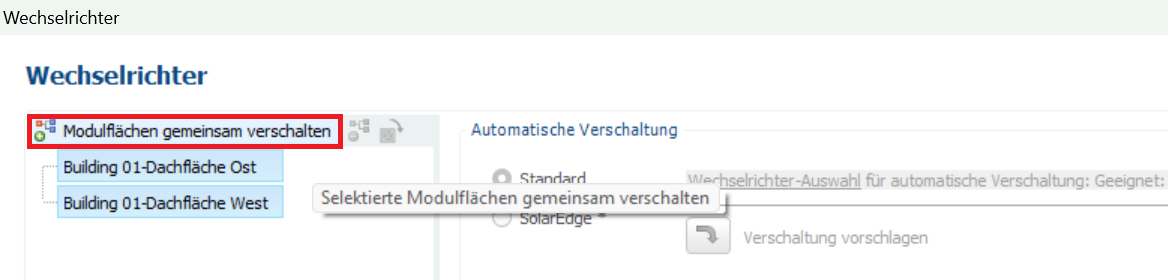
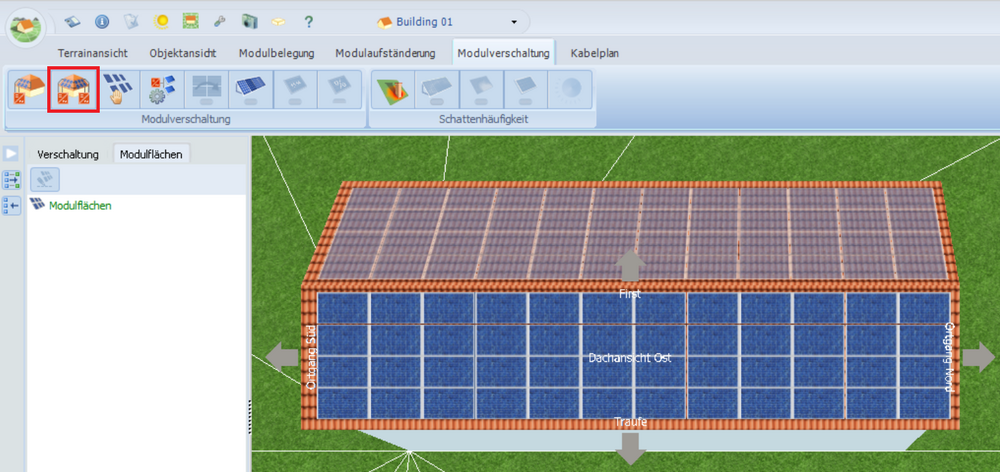
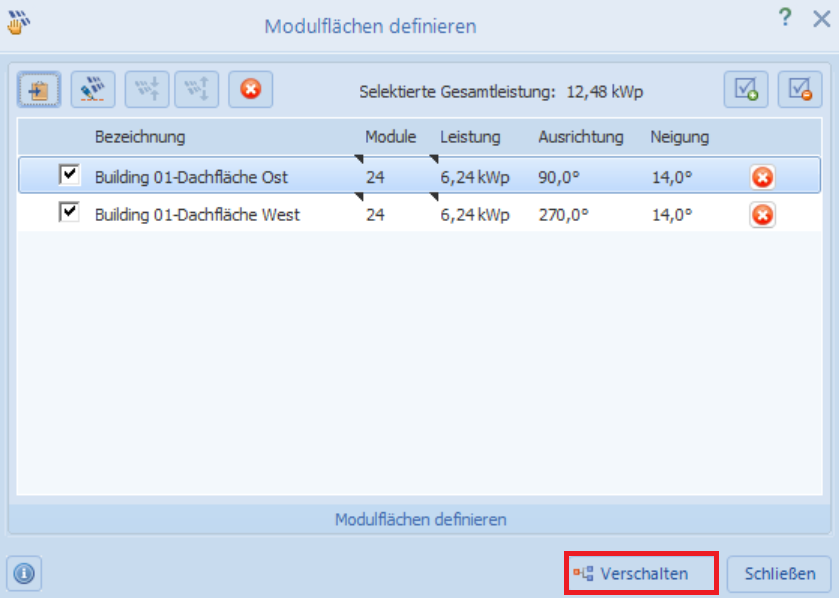
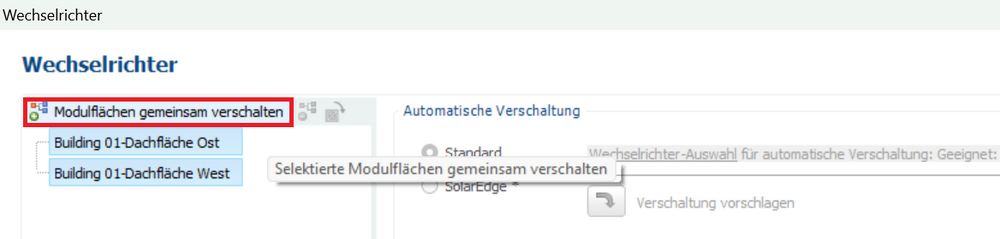
Fall 1: Alle Module auf zwei oder mehr Dachflächen können Sie über den Button "Alle unverschalteten Module verschalten" gemeinsam verschalten: Fall 2: Mehrere - aber nicht alle - Module derselben Dachfläche verschalten Sie gemeinsam an einen Wechselrichter, indem Sie diese zunächst mit gedrückter STRG-Taste und linker Maustaste markieren. Danach wählen Sie mit Rechtsklick "Verschalten": Fall 3: Mehrere Modulflächen auf unterschiedlichen Dachflächen können Sie ebenfalls gemeinsam verschalten. Zuerst definieren Sie, welche Module gemeinsam verschaltet werden sollen. Sie markieren die gewünschten Module der ersten Modulfläche, klicken mit der rechten Maustaste auf die markierten Module und wählen „Zum Dialog ‚Modulflächen definieren‘ hinzufügen“. Sie verwenden den grauen Pfeil, um auf die andere Dachseite desselben Gebäudes zu wechseln. (Oder Sie verwenden das Dropdown-Menü im oberen Menüband, um auf ein anderes Gebäude zu wechseln.) Nun markieren Sie die gewünschten Module der zweiten Modulfläche, klicken mit der rechten Maustaste auf die markierten Module und wählen wieder „Zum Dialog ‚Modulflächen definieren‘ hinzufügen“. Anschließend klicken Sie auf den Button „Modulflächen für die Verschaltung definieren“: Sie können die Modulflächen ggf. umbenennen (Rechtsklick → Umbenennen). Anschließend klicken Sie „Verschalten“: Im Fenster für die Wechselrichterverschaltung markieren Sie beide Modulflächen und klicken "Modulflächen gemeinsam verschalten". Im Anschluss können Sie den gewünschten Wechselrichter auswählen:


-
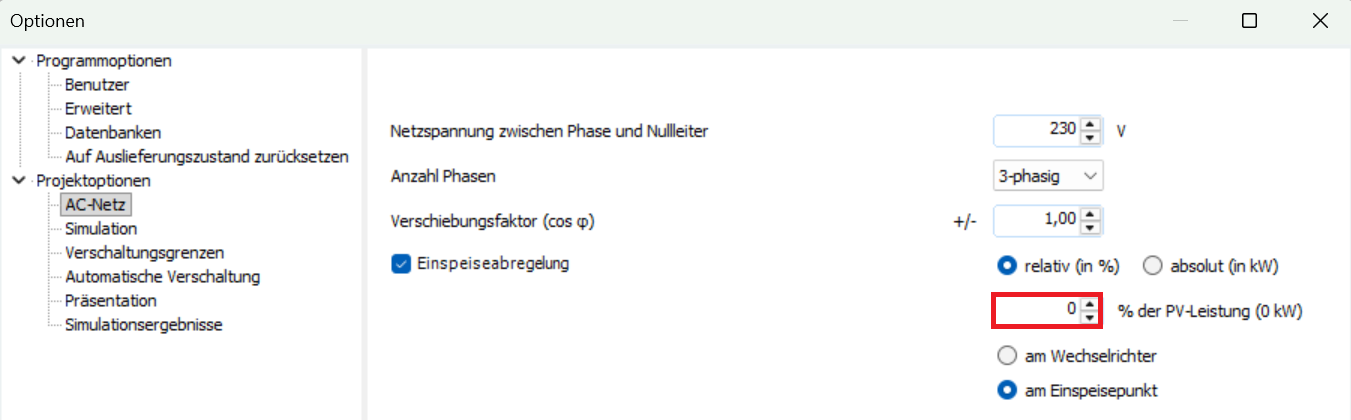
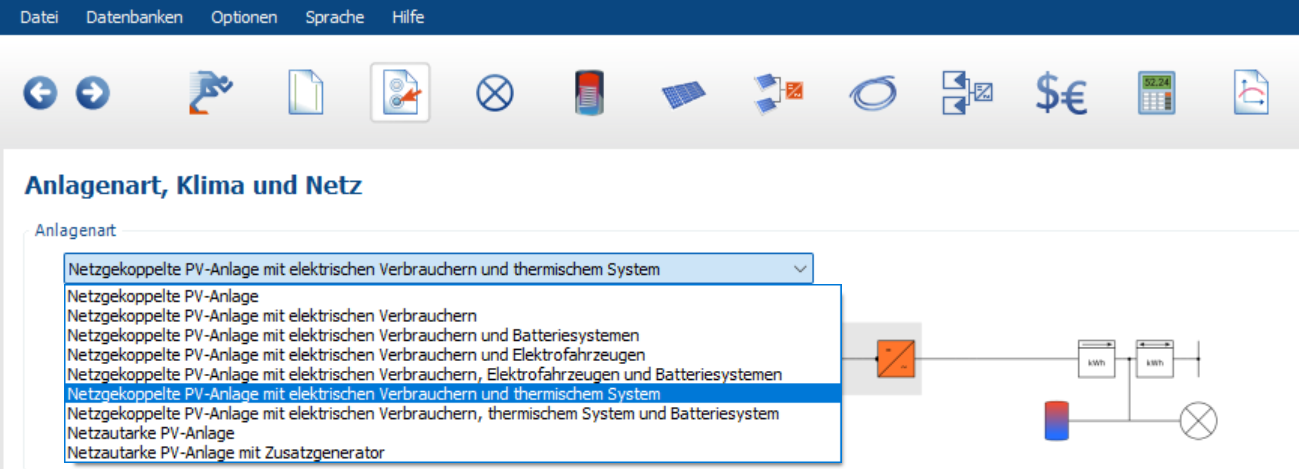
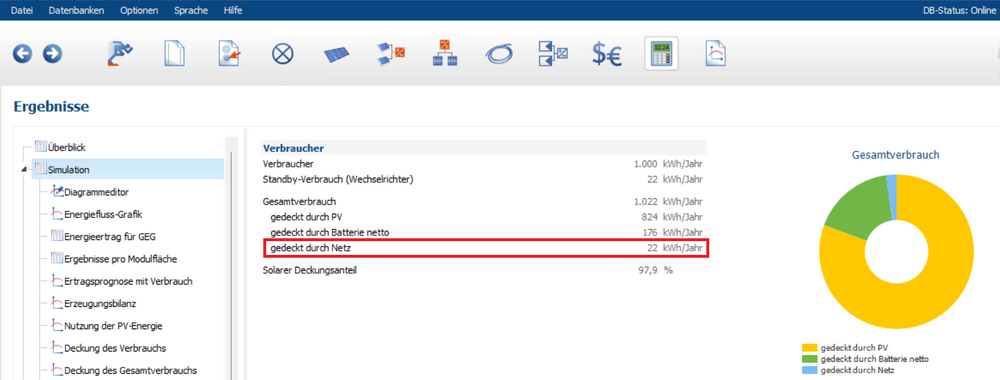
Auf der Seite "Anlagenart, Klima und Netz" können Sie die Anlagenart "Netzautarke PV-Anlage" (mit und ohne Zusatzgenerator) auswählen. Die Planung netzautarker Systeme in PV*SOL basiert auf dem Programm SMA Off-Grid Configurator, das wir einst für SMA programmiert haben. Darin sind die Auslegungsregeln enthalten, die uns SMA vorgegeben hat. Sie können nicht geändert oder ausgeschaltet werden. Beispielsweise können nur Systeme mit AC-seitig eingebundenen Batteriesystemen geplant werden, DC-Systeme sind leider nicht möglich. Uns ist klar, dass diese Regeln nicht unbedingt auf andere Hersteller zutreffen und weitere Einschränkungen mit sich bringen. Für eine höhere Flexibilität in der Auswahl der Komponenten und für eine bessere Transparenz bei der Planung empfehlen wir Ihnen, Ihr netzautarkes System zunächst wie ein netzgekoppeltes System zu planen: Auf der Seite „Anlagenart, Klima und Netz“ wählen Sie ein netzgekoppeltes System aus. Die Einspeiseabregelung setzen Sie auf null, dann wird keine Energie ins Netz eingespeist: Der Wert unter „Gesamtverbrauch gedeckt durch Netz“ gibt die Energie an, die nicht vom PV-System gedeckt werden kann. Diese Energie muss vom Zusatzgenerator bereitgestellt werden oder (wenn Sie keinen Zusatzgenerator einplanen) „gegen null gehen“.

-
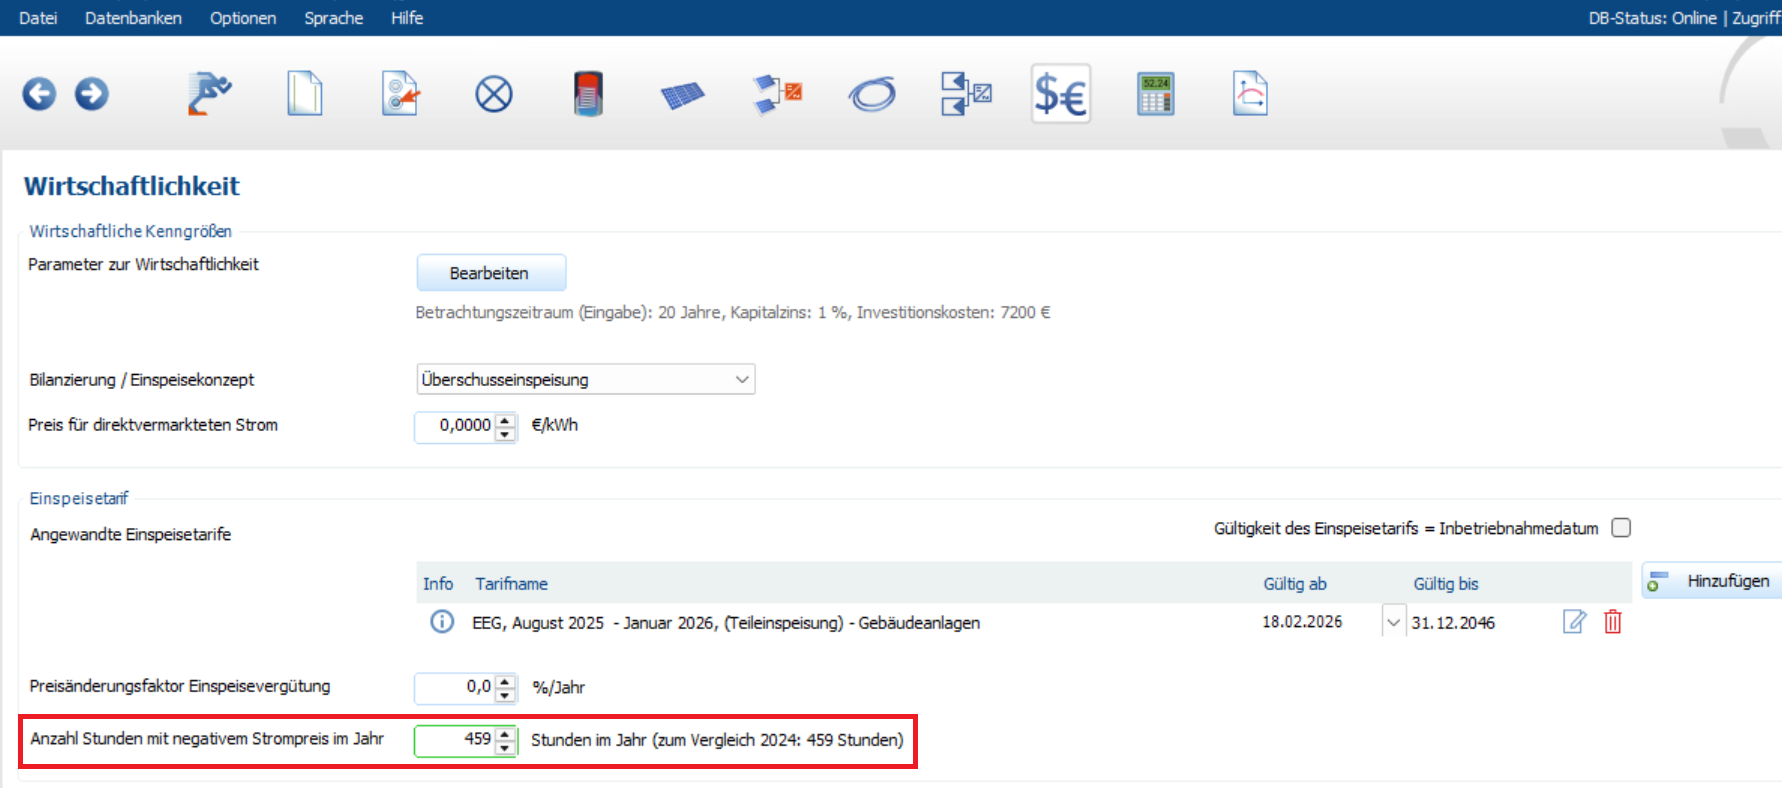
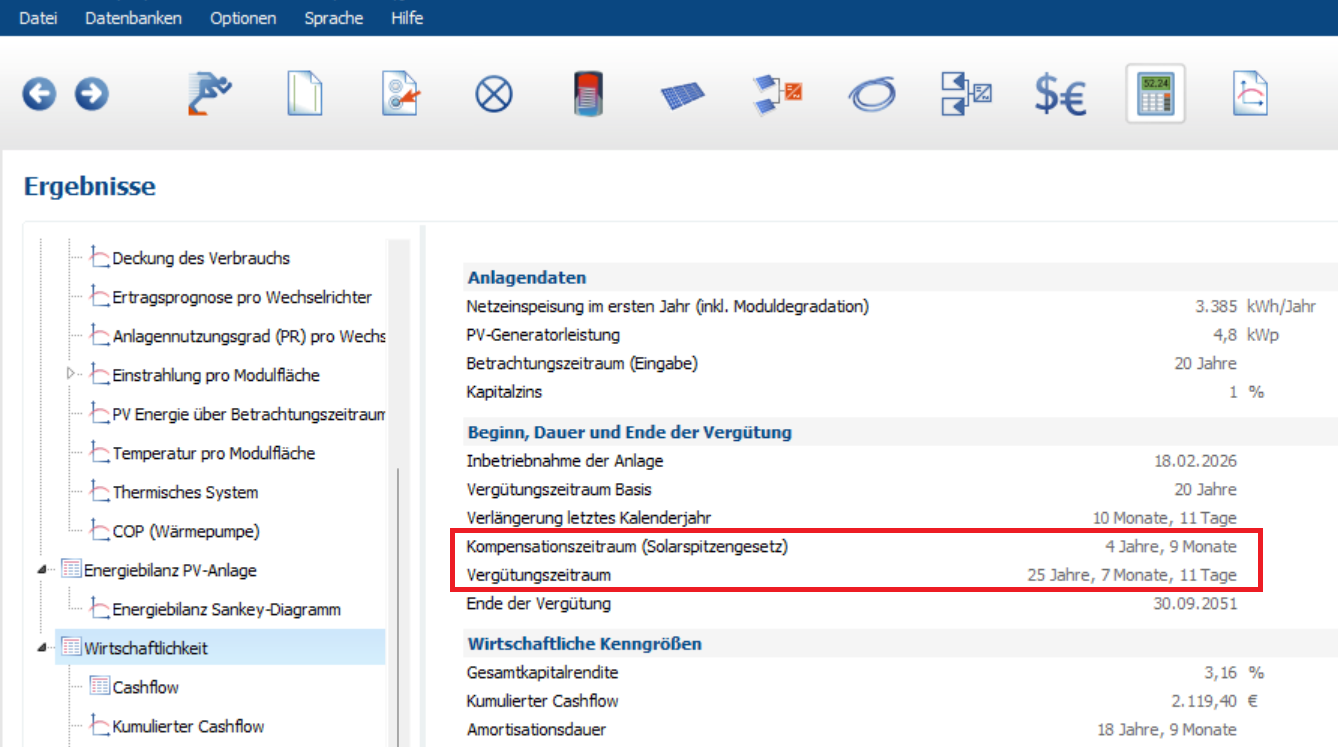
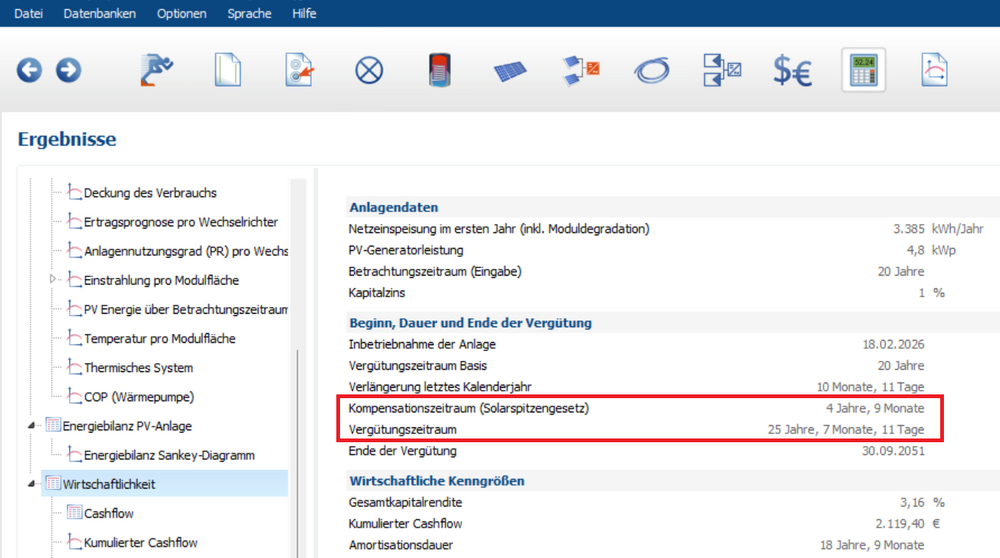
Auf der Seite „Wirtschaftlichkeit“ definieren Sie die Anzahl Stunden mit negativem Strompreis: Laut Solarspitzengesetz gibt es dafür dann einen Kompensationszeitraum, für den im Anschluss an die 20 Jahre die Einspeisevergütung noch weitergezahlt wird. Das wird in der Software automatisch berücksichtigt und in den Ergebnissen ausgegeben:

-
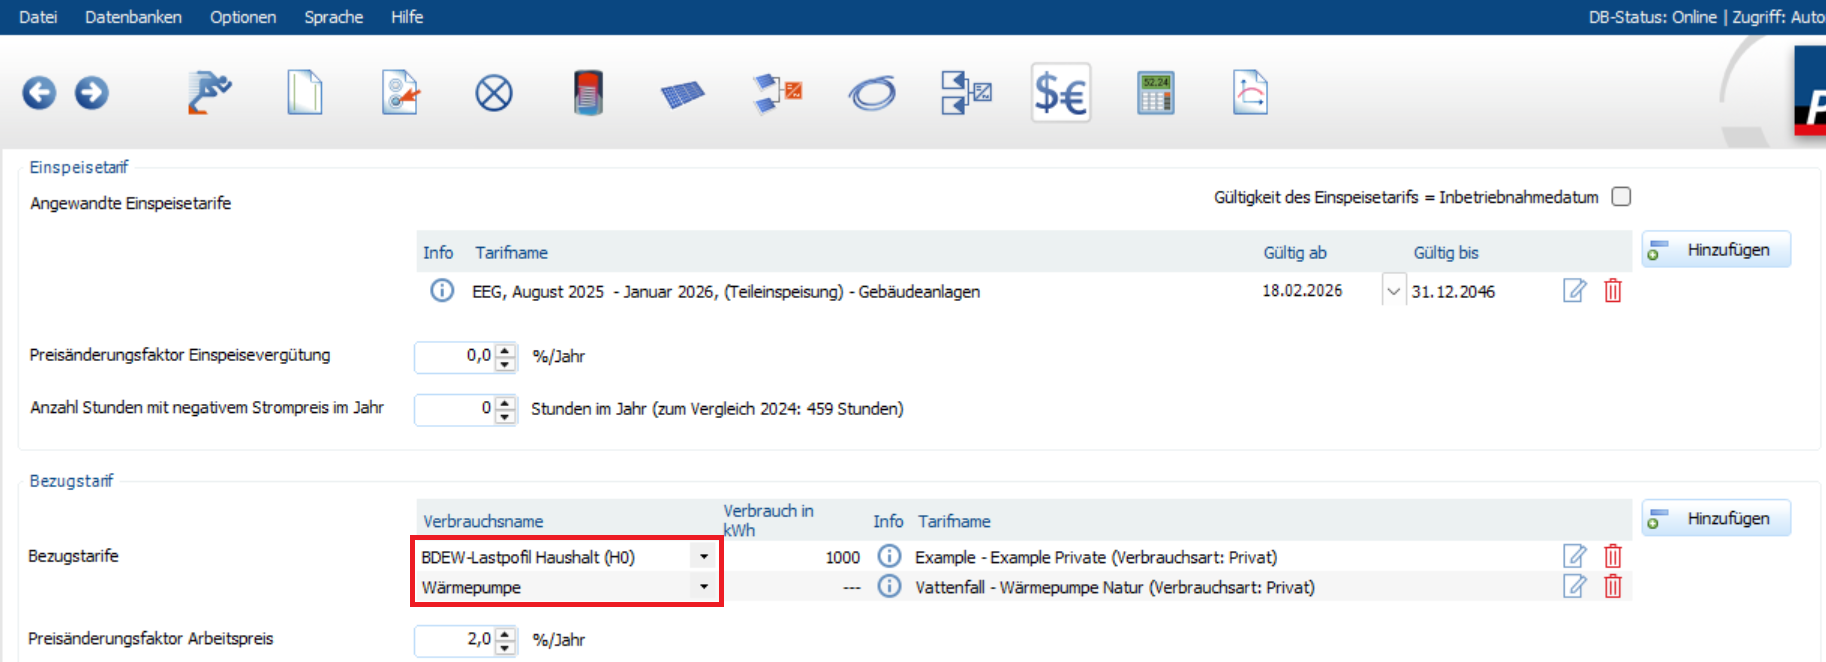
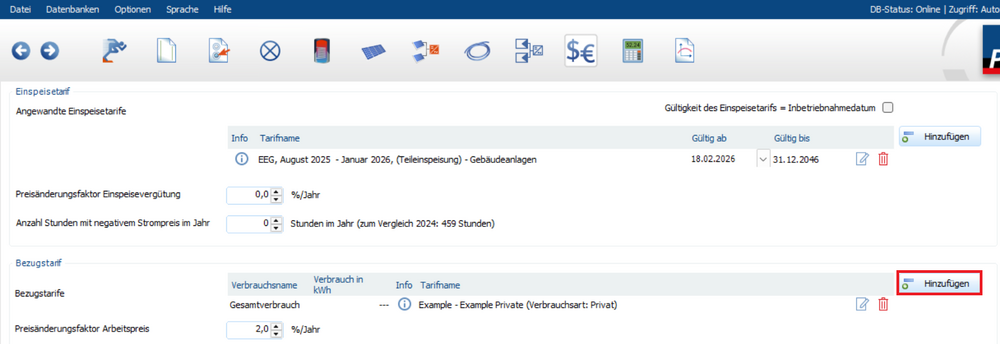
Auf der Seite "Anlagenart, Klima und Netz" wählen Sie eine Anlagenart mit thermischem System aus: Nachdem Sie Angaben zu beiden Verbrauchern (Haushaltsverbrauch und Wärmepumpe) gemacht haben, können Sie auf der Seite "Wirtschaftlichkeit" einen zweiten Bezugstarif hinzufügen: Nun können Sie beiden Bezugstarifen den dazugehörigen Verbraucher (Haushaltsverbrauch oder Wärmepumpe) zuordnen:


-
Wie kann ich eigene Einspeise- und Bezugstarife anlegen?
hotline_oh posted a question in FAQ (Nur lesen)
In PV*SOL premium und PV*SOL öffnen Sie dazu bitte die Tarifdatenbank über den Menüpunkt "Datenbanken > Einspeisetaife" bzw. "Bezugstarife" und wählen das Icon "Neu". Bitte tragen Sie anschließend die benötigten Daten ein.
-
Kann man die monatliche Degression des Einspeisetarifes einstellen?
hotline_oh posted a question in FAQ (Nur lesen)
Nein, Sie müssen für jeden Monat der Inbetriebnahme den entsprechenden Einspeisetarif auswählen bzw. anlegen. Eine Aktualisierung der Tarifdateien erfolgt über das Datenbank-Update. -
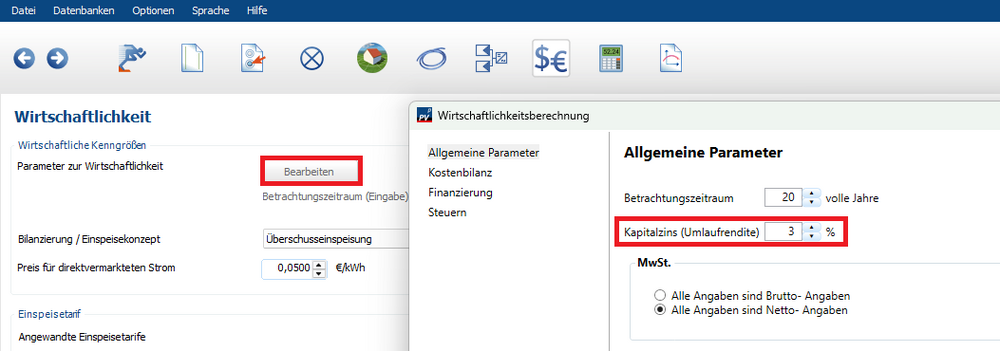
Die Einspeisevergütung in der Tabelle oder Grafik ändert sich in jedem Jahr, auch wenn Sie keine Degradation eingegeben haben, weil nicht der Betrag der Einspeisevergütung, sondern der Barwert angezeigt wird. Das heißt, die Einspeisevergütung jedes Jahres wird mit dem Kapitalzins (der Umlaufrendite) auf den Anfangszeitpunkt abgezinst. Falls Sie den Betrag der Einspeisevergütung unverzinst im zeitlichen Verlauf sehen wollen, setzen Sie den Kapitalzins auf Null.
-
Die im Projektbericht ausgegebenen Ergebnisse, zum Beispiel die jährliche Netz-Einspeisung, der spezifische Ertrag und die CO2-Einsparung, beziehen sich auf das erste vollständige Betriebsjahr.
-
Wie simuliere ich Mieterstrommodelle und Eigentümergemeinschaften?
hotline_oh posted a question in FAQ (Nur lesen)
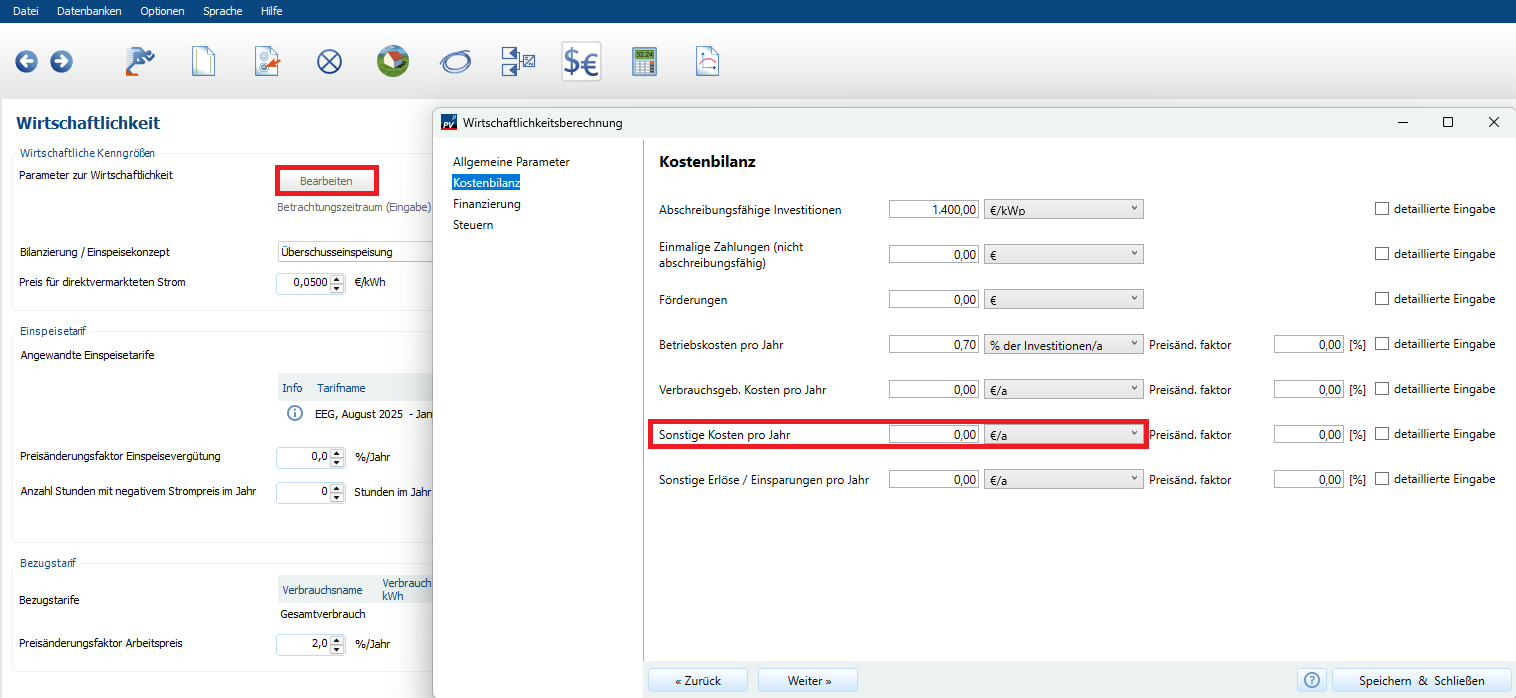
Das Mieterstrommodell ist leider nicht als Bilanzierung/Einspeisekonzept auswählbar und muss individuell eingegeben/angepasst werden. Unter der Voraussetzung, dass das Bedarfsprofil den Verbrauch der Mieter:innen darstellt, entspricht der Eigenverbrauch dem Verkauf an die Mieter:innen. Dieser kann über die Einsparungen berücksichtigt werden, indem Sie einen Bezugstarif definieren, der dem Verkaufspreis an die Mieter:innen entspricht. Der eingespeiste Strom wird nach dem EEG oder per Direktvermarktung vergütet. Da der Betreiber evtl. gleichzeitig Versorgungssicherheit gewährleisten muss/kann, kann es sein, dass die erzeugte PV-Energie nicht ausreicht, den Bedarf der Mieter:innen zu decken. In diesem Fall muss Strom aus dem Netz vom Energieversorger dazu gekauft werden. Um das zu berücksichtigen, müssen Sie die gekaufte Menge Strom mit dem Preis je kWh des Energieversorgers multiplizieren und auf der Seite Wirtschaftlichkeit in den Parametern zur Wirtschaftlichkeit > Kostenbilanz unter sonstige Kosten eingeben.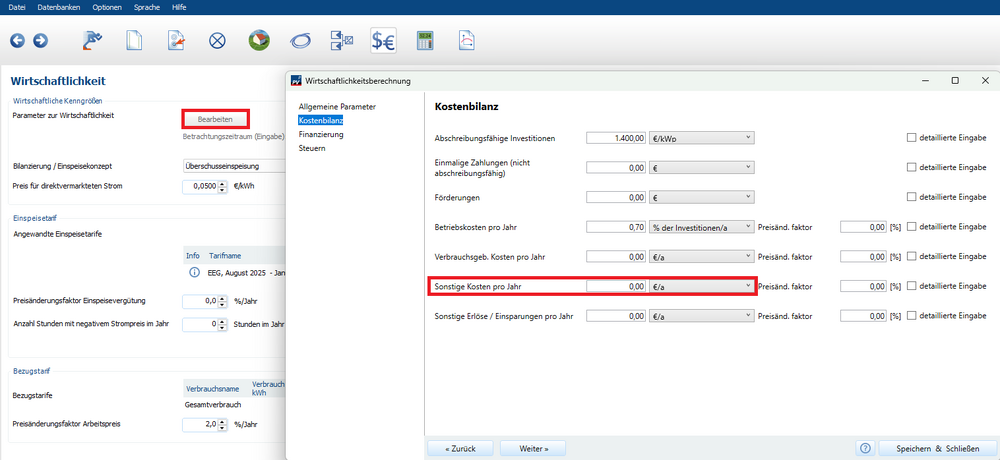
-
Nein, mit unseren PV-Programmen kann man keine Kosten berechnen. Es sind keine Komponentenpreise und auch keine sonstigen Kosten hinterlegt. Die Kosten Ihrer geplanten Anlage müssen Sie selbst ermitteln. Der ermittelte Anlagenpreis wird in der Wirtschaftlichkeitsberechnung eingegeben und ist damit Grundlage der Wirtschaftlichkeitsprognose. Die Masken im Modul "Wirtschaftlichkeitsberechnung" sind mit Beispielwerten vorbelegt und haben nicht den Charakter von Durchschnitts- oder Erfahrungswerten. Diese müssen Sie an das jeweilige Projekt anpassen.
-
Wie kann ich mir die Klimadaten detailliert anschauen?
hotline_oh posted a question in FAQ (Nur lesen)
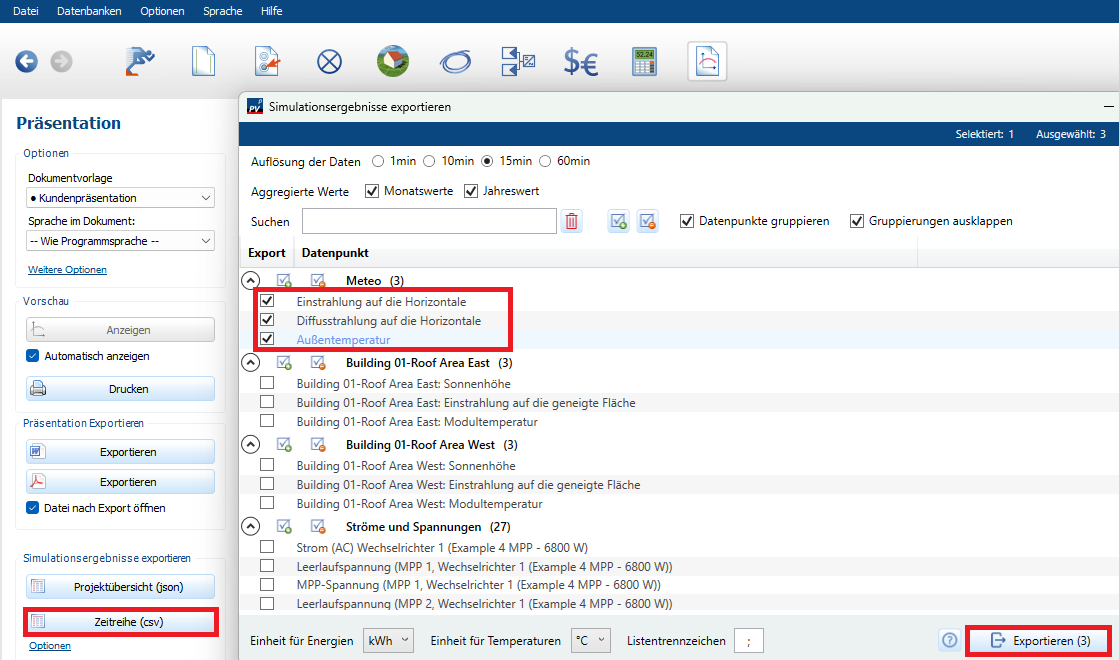
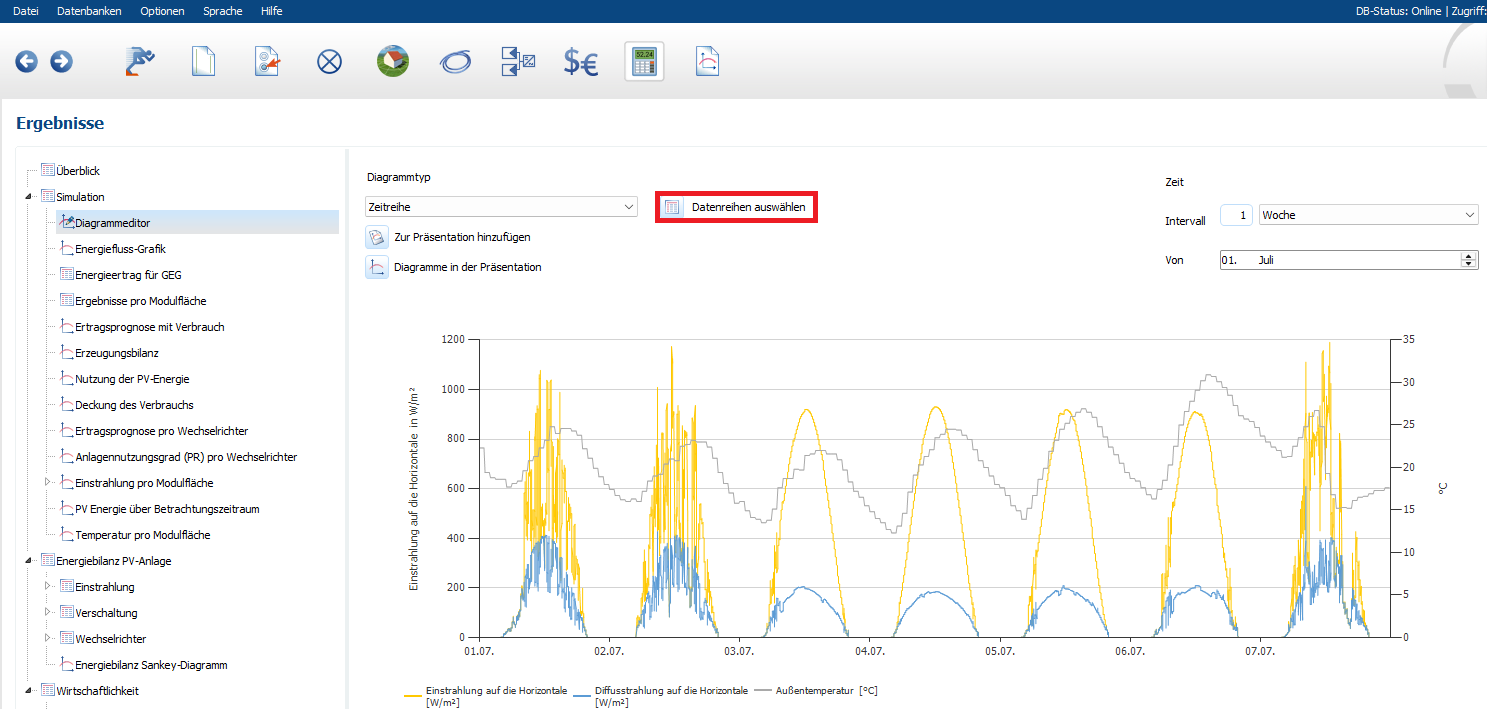
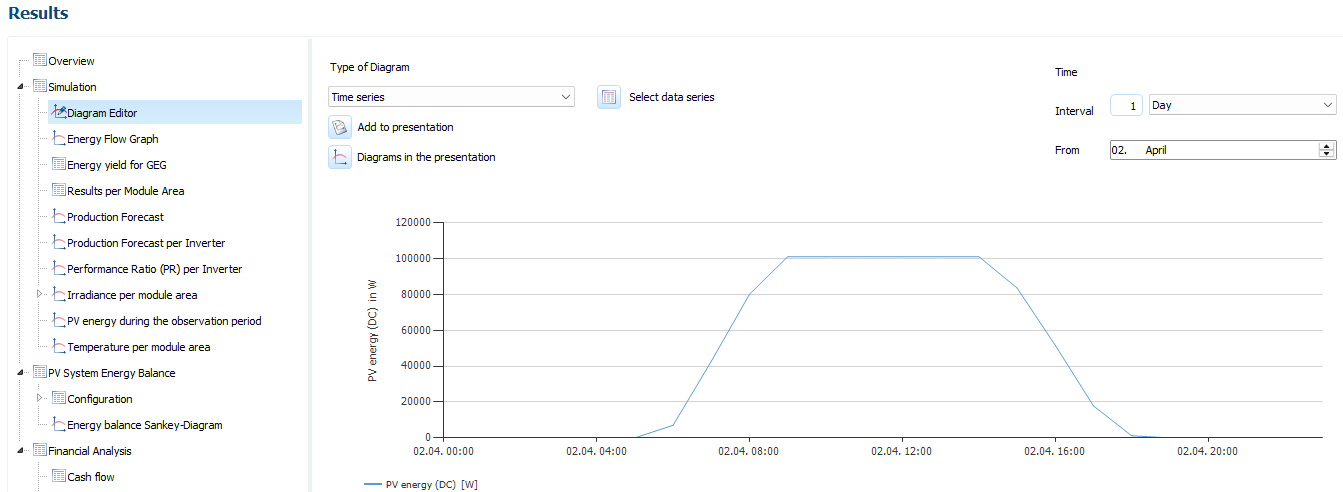
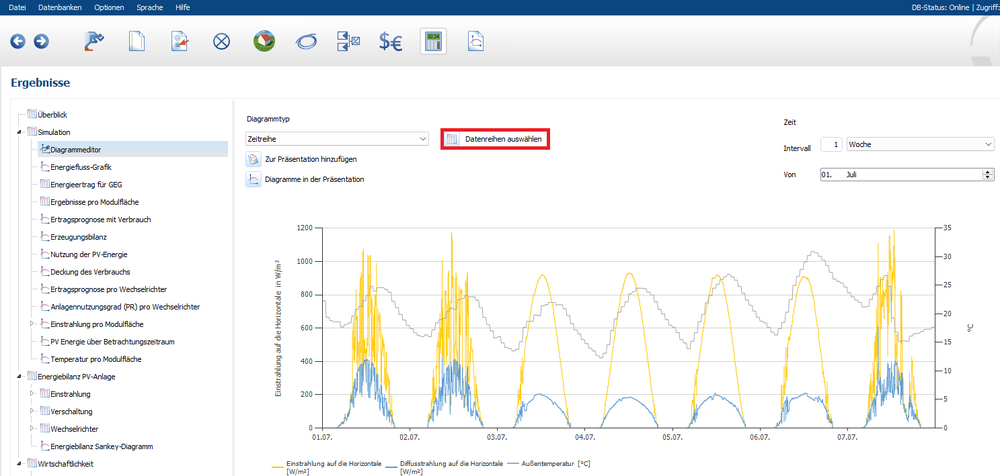
Auf der Seite „Präsentation“ können Sie über den Button "Zeitreihe (csv)" die Simulationsergebnisse exportieren. Sie wählen die gewünschten Meteo-Datenreihen aus, dann werden Ihnen die Strahlungsdaten in kWh/m² und die Außentemperatur in °C in einer csv-Datei ausgegeben: Auf der Seite "Ergebnisse" können Sie sich im Diagrammeditor dieselben Datenreihen für unterschiedliche Zeitintervalle im Diagramm anzeigen lassen:
-
Auf der Seite "Anlagenart, Klima und Netz" wählen Sie den 1-minütigen Zeitschritt aus: Auf der Seite „Präsentation“ können Sie über den Button "Zeitreihe (csv)" die Simulationsergebnisse exportieren. Für die Auflösung der Daten geben Sie 15 Minuten an. Sie wählen die gewünschten Datenreihen aus, beispielsweise „PV-Energie (AC) abzgl. Standby-Verbrauch“, dann werden Ihnen die 15-Minuten-Werte eines Jahres in kWh in einer csv-Datei ausgegeben:


-
Mehrere Gebäude einer Liegenschaft in einem PV*SOL Premium Projekt abbilden?
hotline_oh replied to DLuCAD's topic in PV*SOL
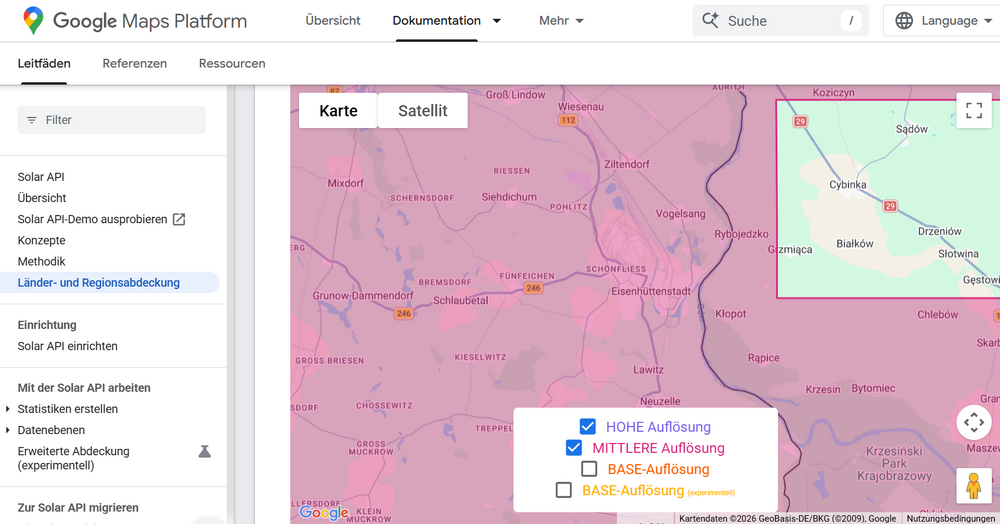
Hallo DLuCAD, vielen Dank für deine Anfrage. Es ist grundsätzlich möglich, eine komplette Liegenschaft mit mehreren Gebäuden in einem einzigen PV*SOL Premium Projekt abzubilden. Folgendes ist zu beachten: Wenn du die Google Solar API oder den Kartenausschnitt eines anderen Kartenanbieters nutzen möchtest, bist du auf eine Größe von 200 m x 200 m beschränkt. Bei der Planung mit importiertem Kartenausschnitt kannst du nur einen einzigen Lageplan im Format *.jpg, *.jpeg, *.bmp oder *.png importieren. Dieser muss alle Gebäude enthalten. Du kannst nicht mehrere Lagepläne/Zeichnungen importieren und eine nachträgliche Änderung des Lageplans ist leider ebenfalls nicht möglich. Für die Wechselrichterverschaltung unterteilst du deine Liegenschaft in Teilanlagen, zum Beispiel eine Teilanlage pro Gebäude. Denn wenn du nachträglich Module hinzufügen oder löschen musst, musst du nicht die Verschaltung für die komplette Liegenschaft, sondern nur für ein Gebäude löschen. -
Hallo SinedB, vielen Dank für Ihre Anfrage. Wir haben leider die Erfahrung gemacht, dass es auch für andere Orte in Deutschland keine Google-Solar-API-Daten gibt, auch nicht in Medium-Auflösung, obwohl es laut Google dort Daten in Medium-Auflösung geben sollte. Die markierten Gebiete stimmen leider nur grob mit der wirklichen Verfügbarkeit überein. Die Grenzen zwischen HIGH und MEDIUM sind nicht so scharf, wie es die Karte suggeriert. Auch das ganze Gebiete fehlen, die eigentlich als MEDIUM markiert sind, kommt leider vor. Wir werden den Sachverhalt noch einmal an Google weiterleiten.
-
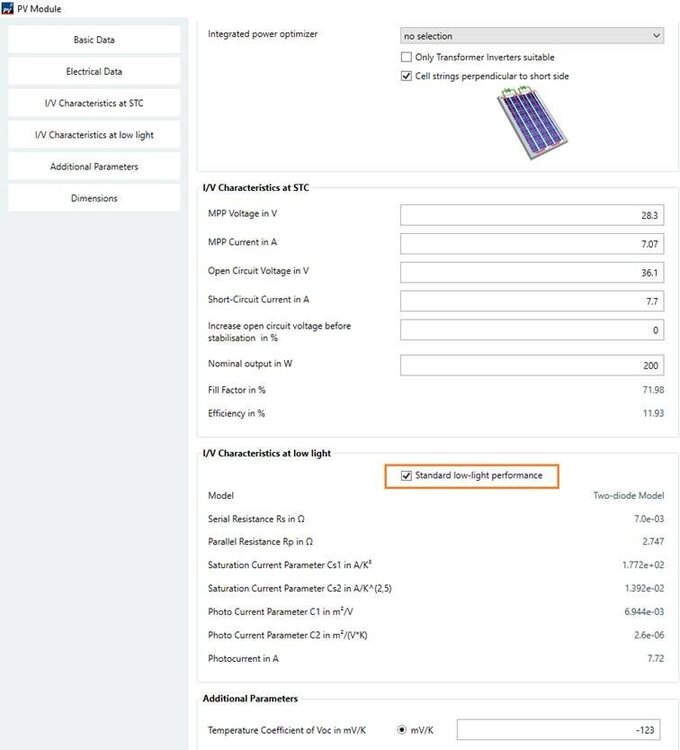
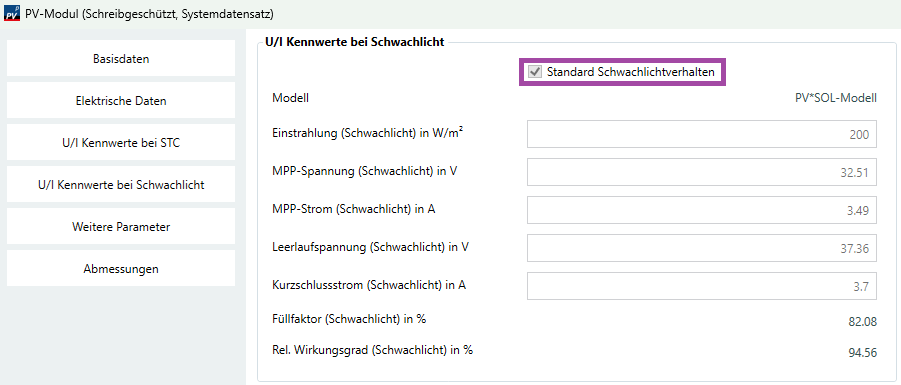
Dear Anders, Thank you for your inquiry. The database is maintained by the manufacturers. They have access to an online database where they can enter their products. We update the database regularly and transfer the new entries to the user databases. We will contact the manufacturer and ask them to add the missing modules. In PV*SOL you also have the possibility to create products by yourself. The easiest way is to copy an existing dataset and overwrite the values using the datasheet. Since there is no information available on the datasheet about the low light performance, you have to select standard. For modules you can also import *.pan files if available.
-
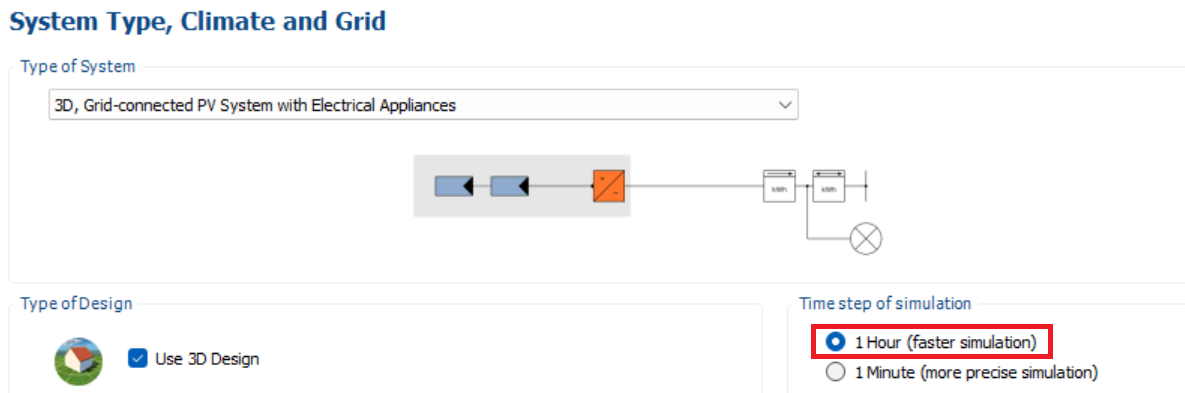
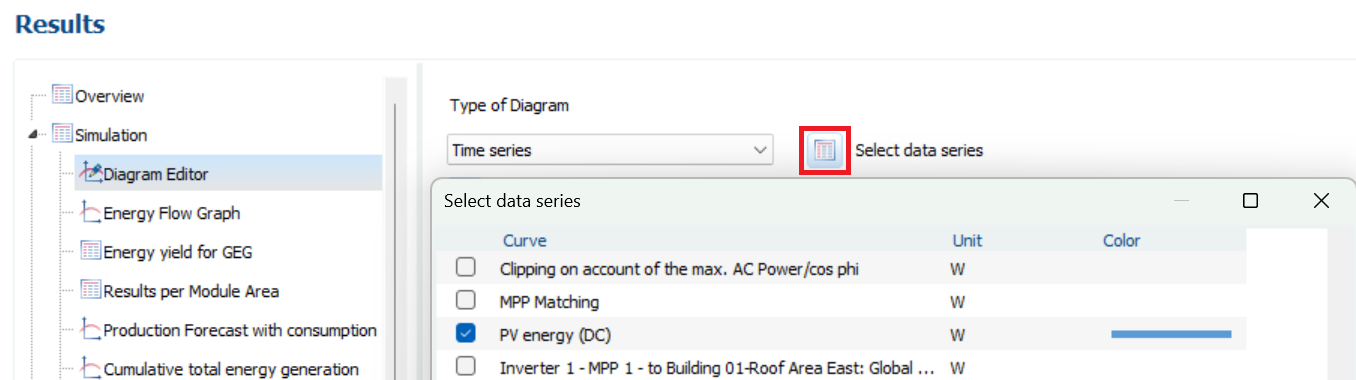
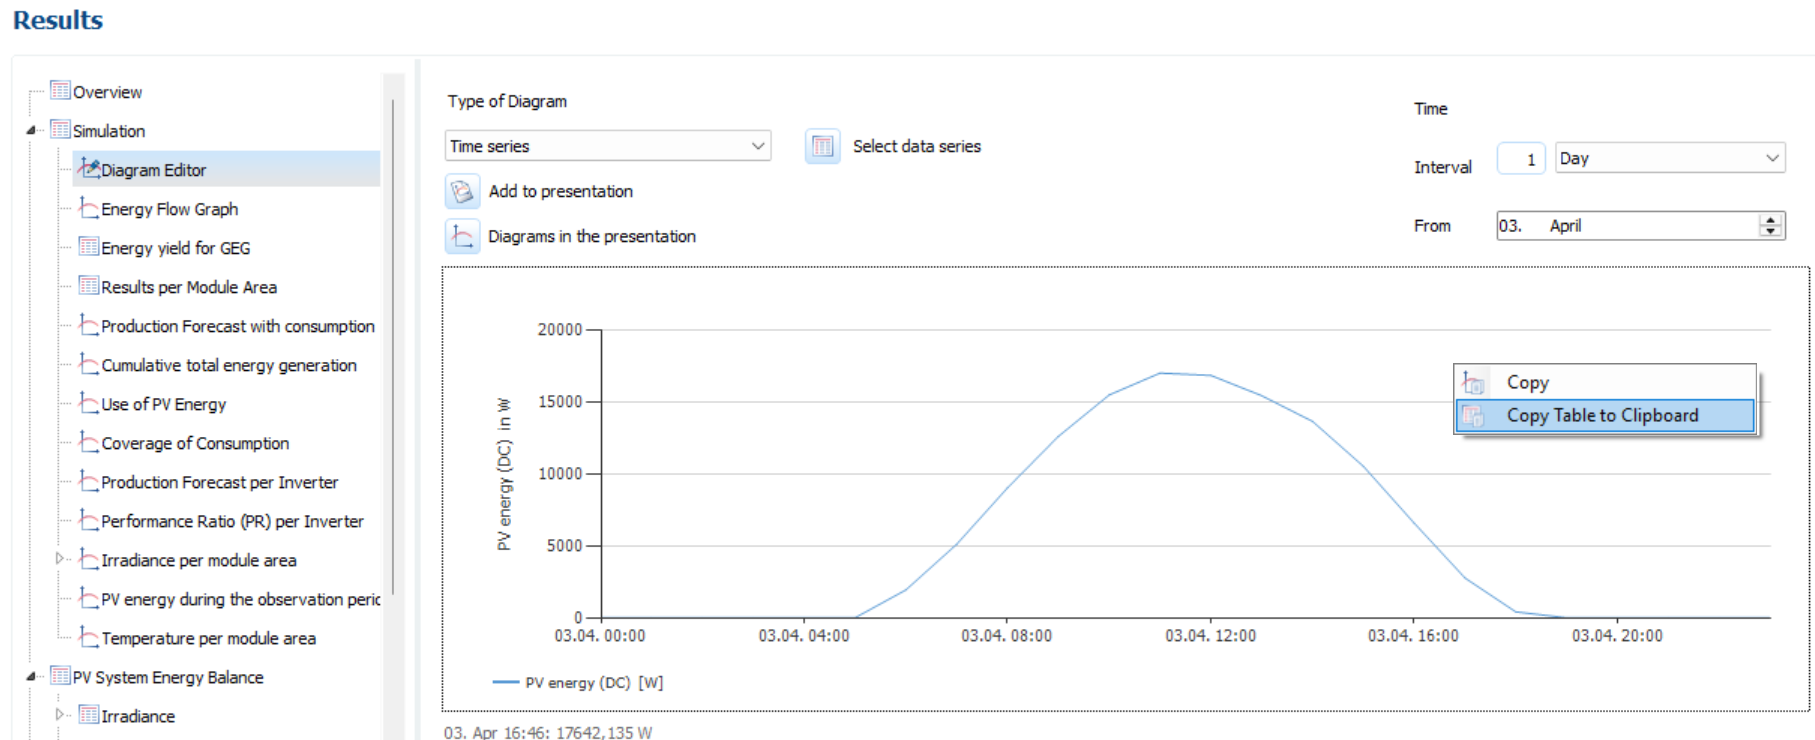
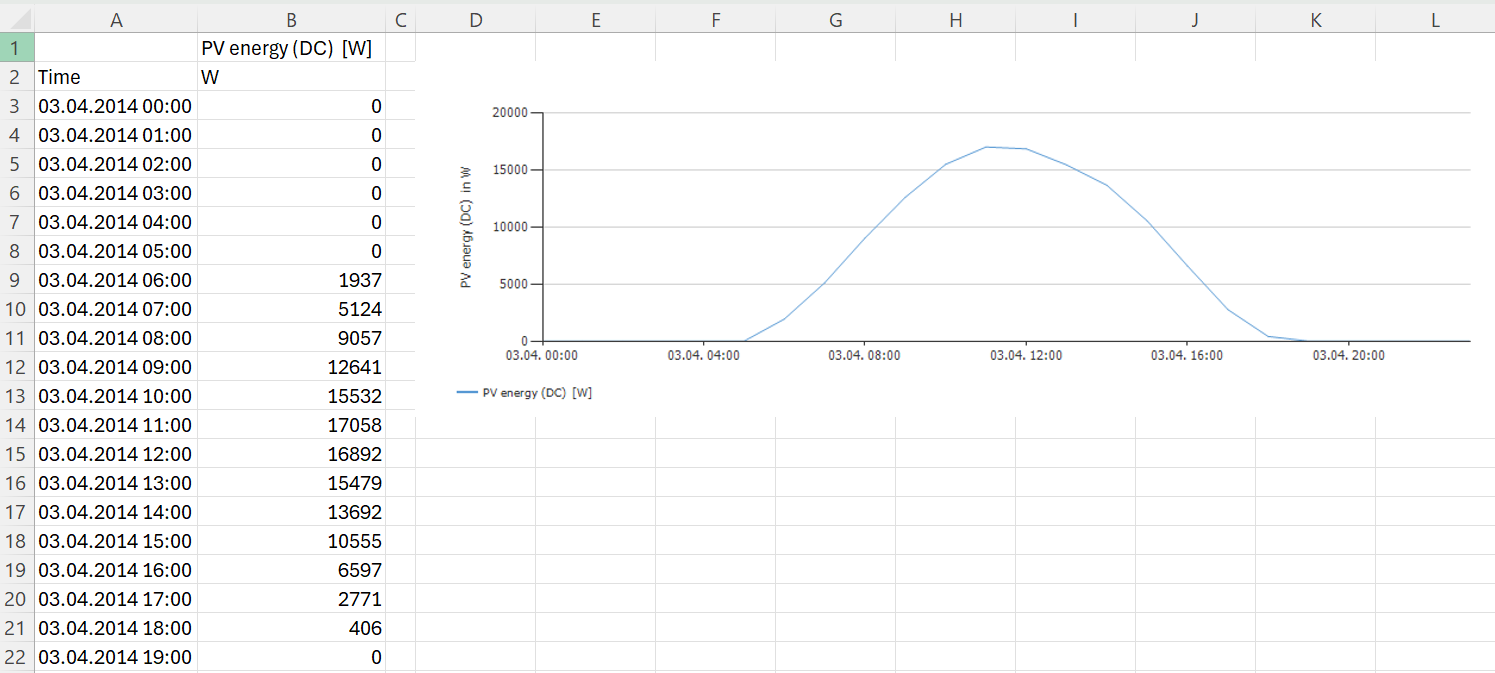
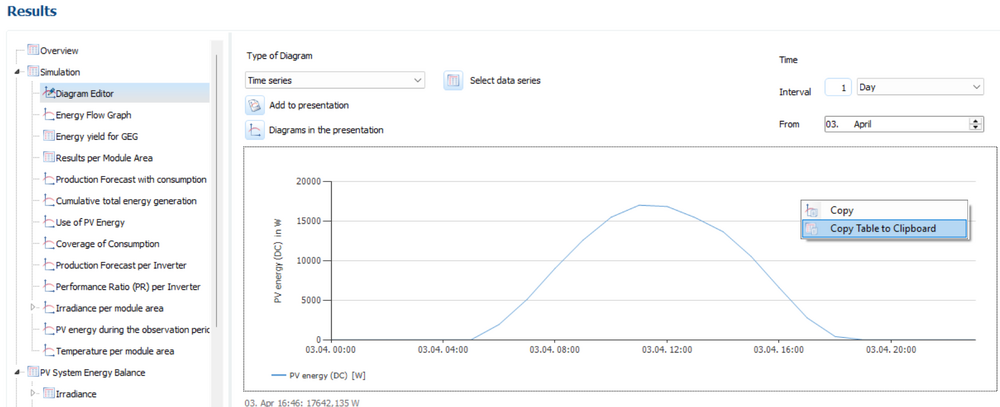
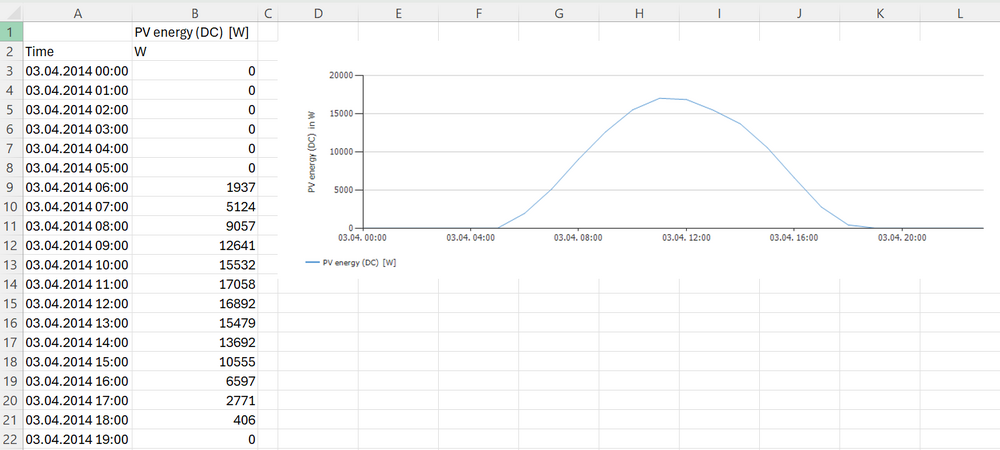
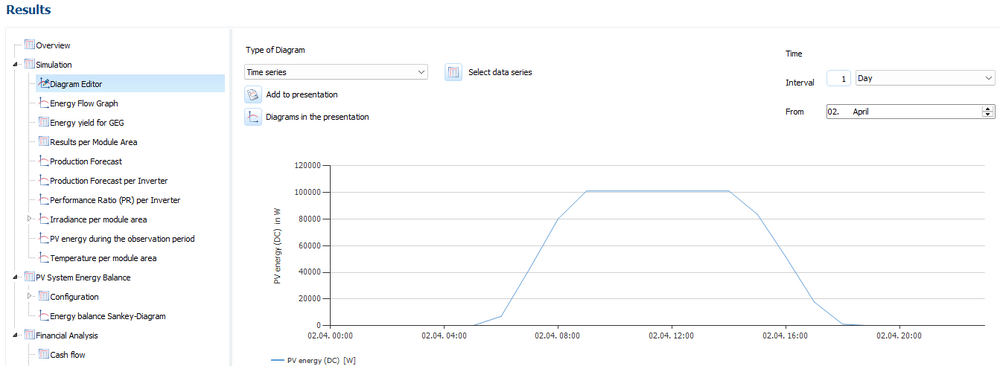
Dear J. Esteban, Thank you for your inquiry. On the "System Type, Climate, and Grid" page, select the hourly simulation step: In the chart editor, select the "PV Energy (DC)" or "PV Energy (AC)" data series: Select a sunny day and right-click, then choose "Copy" and "Copy Table to Clipboard": Paste the table and chart into Excel:


- 9 replies
-
- 1
-

-
- results
- diagram editor
- (and 1 more)
-
Bei der Simulation von unterschiedlichen Modulen, die die gleiche Leistung und ähnliche Kennwerte haben, sind Ertragsunterschiede in der Regel im hinterlegten Teillastverhalten begründet. Die Modulhersteller tragen ihre Daten selbst in die PV*SOL-Datenbank ein. Dabei haben sie die Möglichkeit, ein spezifisches Teillastverhalten für das Modul zu hinterlegen. Tun die Hersteller dies nicht, muss ein Standardteillastverhalten für den Modultyp, z.B. monokristallin, angenommen werden. Welches Teillastverhalten für die ausgewählten Module verwendet wird, finden Sie in der Datenbank. Beispielmodul (600 Wp) mit spezifischem Teillastverhalten Beispielmodul (600 Wp) mit Standardteillastverhalten

-
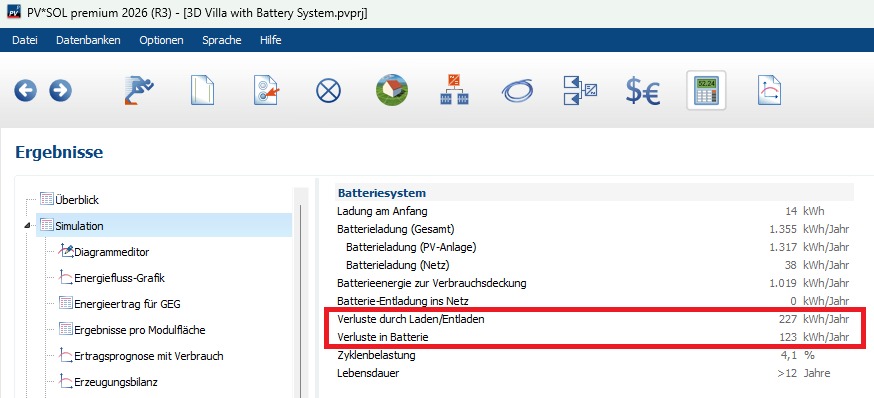
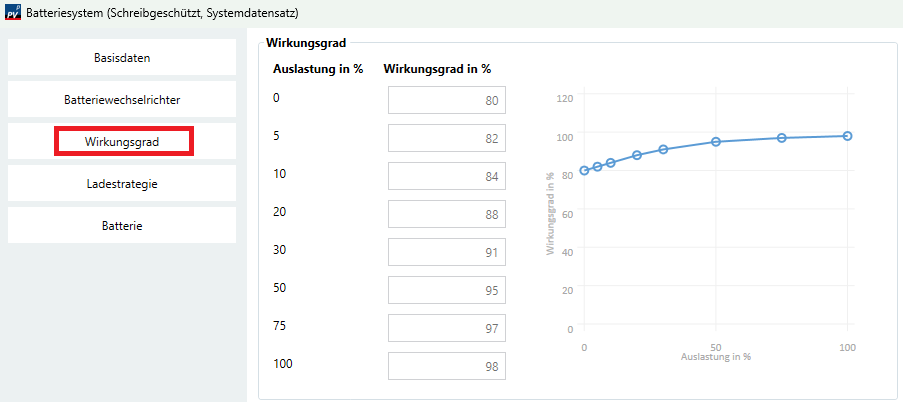
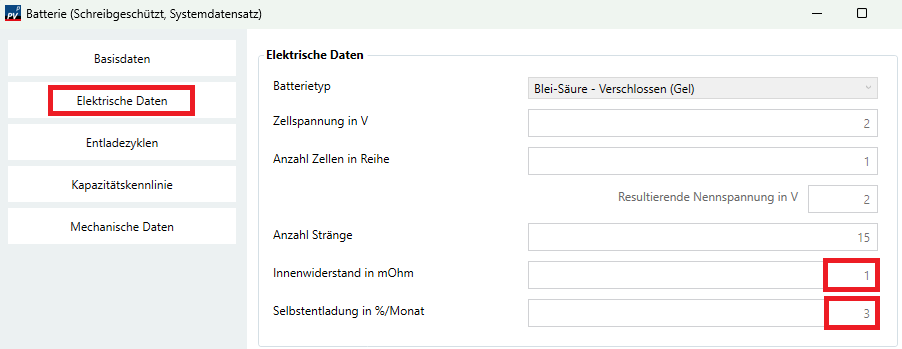
Verluste durch Laden/Entladen Die Wirkungsgradkurve des Batteriesystems bestimmt die Verluste, die bei der Umwandlung von elektrischer in chemische Energie und umgekehrt auftreten: Verluste in Batterie Der Innenwiderstand und die Selbstentladung der Batterie bestimmen die Verluste, die durch Alterungsprozesse entstehen:
-
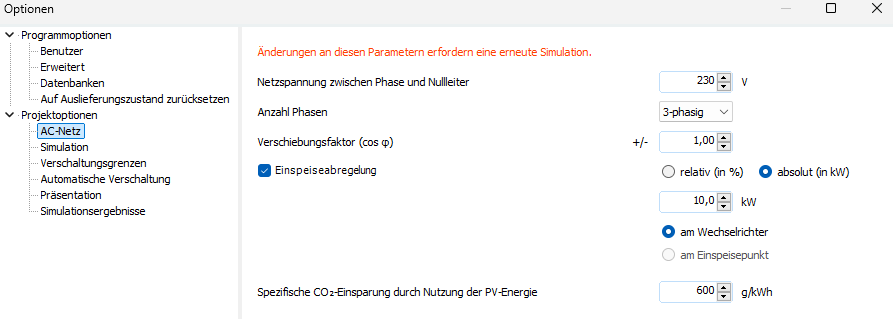
Die reduzierte Einspeisung kann relativ (in %) und absolut (in kW) eingegeben werden. Wenn Sie bei mehreren, unterschiedlich großen Wechselrichtern einen absoluten Betrag eingeben, wird dieser von der Software in einen relativen Betrag umgerechnet und entsprechend auf alle Wechselrichter verteilt. Kleine Wechselrichter werden gegenüber großen Wechselrichtern trotzdem benachteiligt, weil bei sehr kleinen abgeregelten Mengen zuerst die kleinen Wechselrichter abgeregelt werden.
-
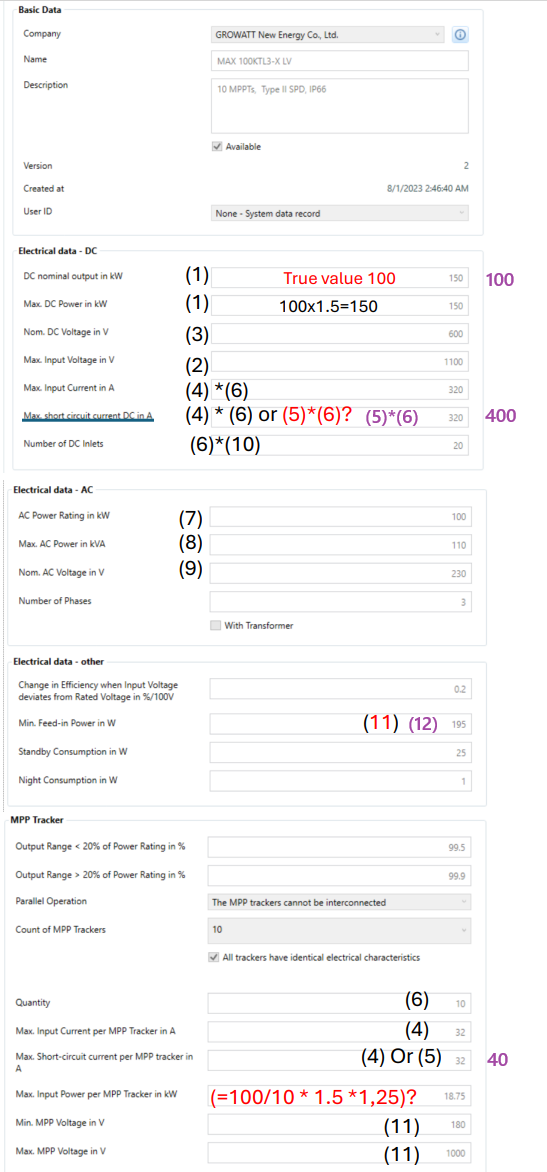
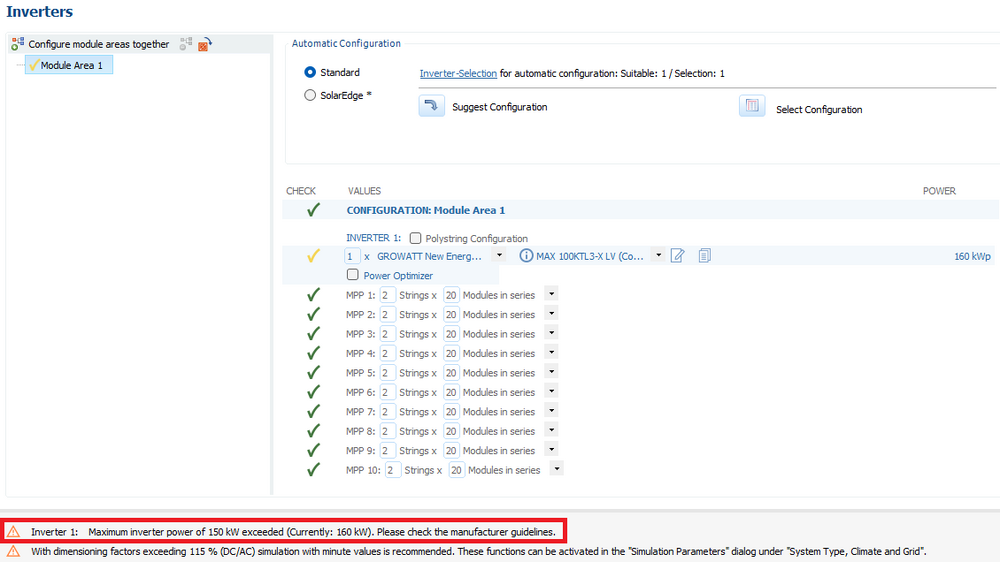
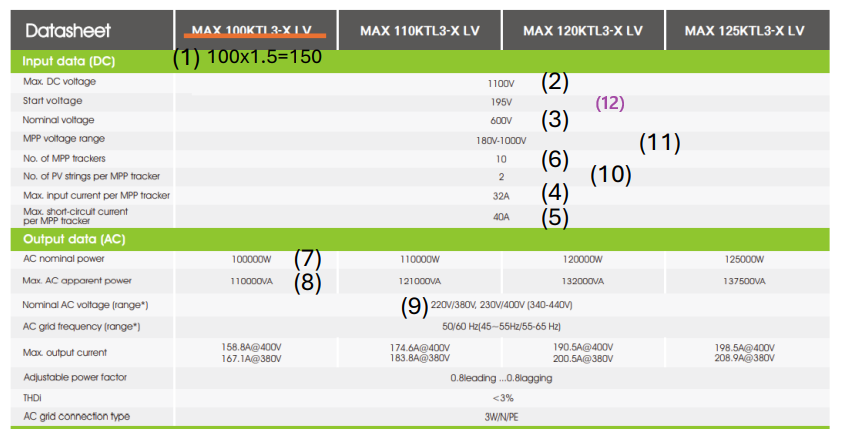
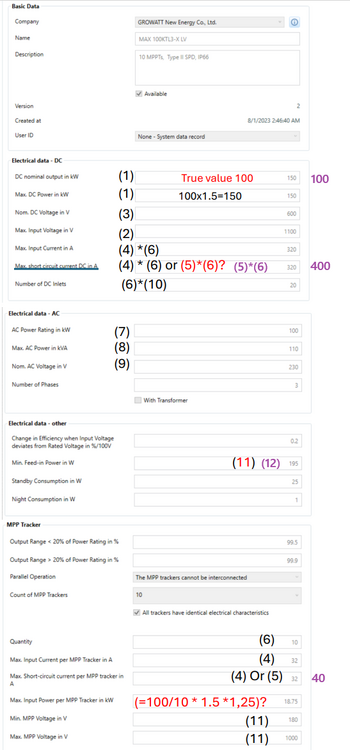
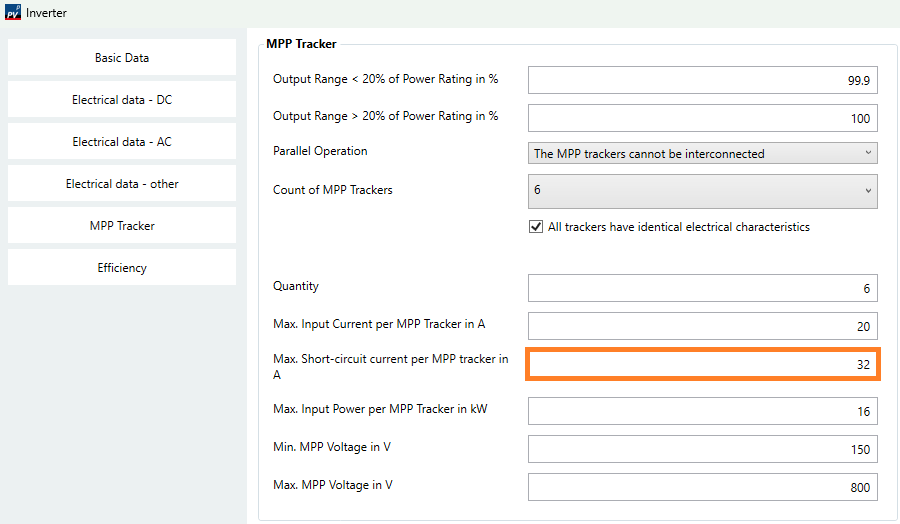
Dear Juan, Thank you for your inquiry. 1. DC Power & Clipping Logic We agree that the nominal DC output should be 100 kW. We will contact the manufacturer and request a correction. The power is clipped when the nominal DC power is exceeded. A warning message is issued when the maximum DC power is exceeded. 2. Defining Max. Power per MPP Tracker The Max. Input Power per MPP Tracker is not found in the datasheet. Some manufacturers divide the total power by the number of MPP trackers, but this leads to error messages if the power is not evenly distributed across the trackers. Therefore, it's plausible that Growatt enters 18.75 kW here (instead of 10 kW or 15 kW). But we don't know exactly how the manufacturer calculates this value. 3. Global DC Data vs. Tracker Data The maximum input current of the inverter is the product of the maximum input current of the MPP tracker and the number of MPP trackers, as in this example: 32 A * 10 = 320 A. However, some manufacturers enter something different. We have noticed that the short-circuit current is incorrectly entered. According to the datasheet, the short-circuit current per MPP tracker is 40 A, so the short-circuit current of the inverter would be 400 A. We will contact the manufacturer and request a correction of both fields. 4. Physical Inputs vs. Trackers We confirm that for an inverter with 10 trackers but 20 physical inputs (strings) the number of DC inputs is 20. There are inverters with an odd number of DC inputs, e.g., 5 DC inputs with 3 MPP trackers. However, this is not the case with this Growatt inverter. Suggestions for the development team We have forwarded your suggestions to better align the electrical parameter designations with those found in most datasheets to our development team.
- 2 replies
-
- 1
-
-
- inverter parameters
- database user editng
- (and 3 more)
-
Suggestion for Inclusion of New PV Module in PVSOL Component Library
hotline_oh replied to J. Esteban's topic in PV*SOL
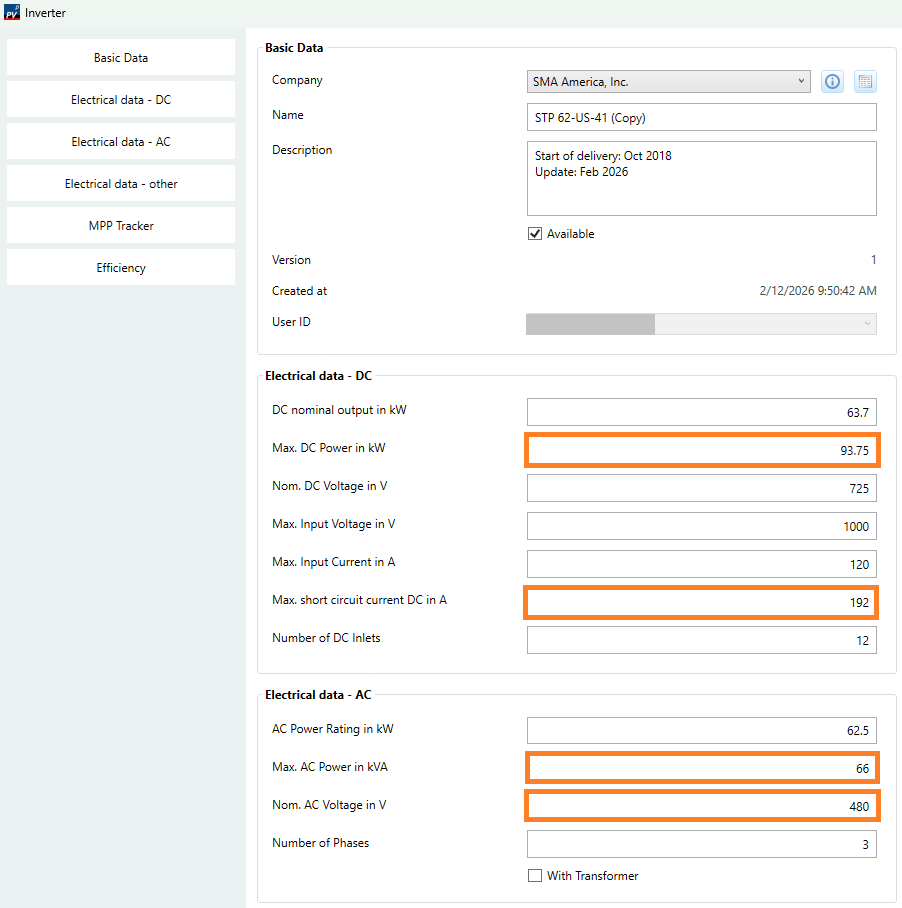
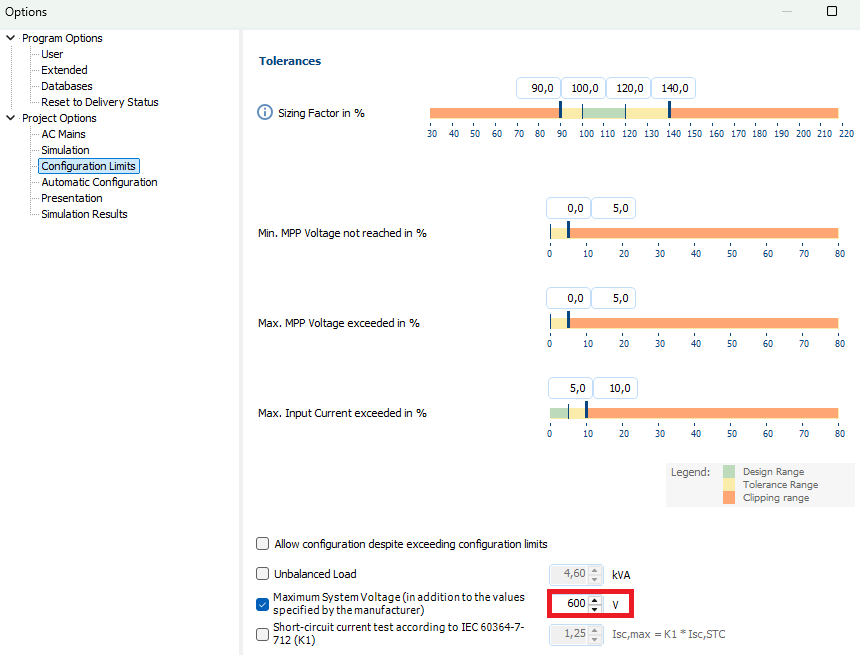
Dear J. Esteban, Thank you for your inquiry. The databases are maintained by the manufacturers. We will contact both manufacturers and request that they add the missing power classes and update the outdated database entry. If you want to update the Sunny Tripower CORE1 62-US yourself, make the changes shown here. You can find a sample project with the updated inverter in the appendix. There can be various reasons why no automatic configuration can be found, for example, that the number of module areas is greater than the number of MPP trackers. In this case, manual configuration must be performed, possibly using polystring configuration. Please note that with the Sunny Tripower CORE1 62-US, if you select a climate data set in the USA, the Maximum System Voltage is preset to 600 V. This could also be a reason why no automatic configuration is found. Depending on your location, you can manually change the Maximum System Voltage. Sample project with Sunny Tripower CORE1 62-US.pvprj
-
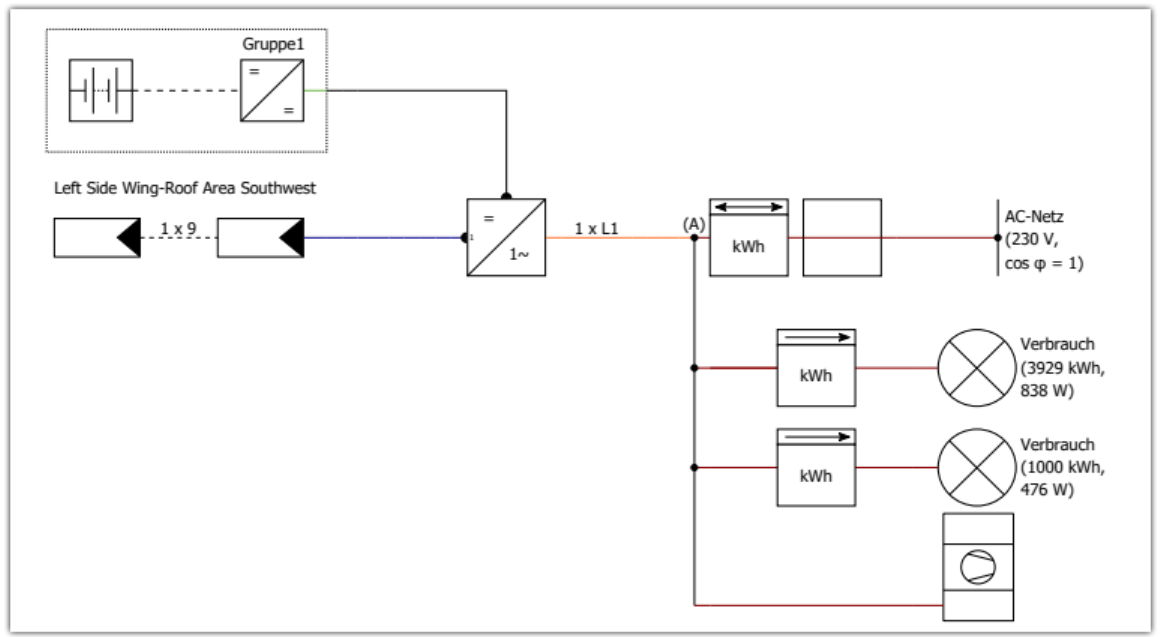
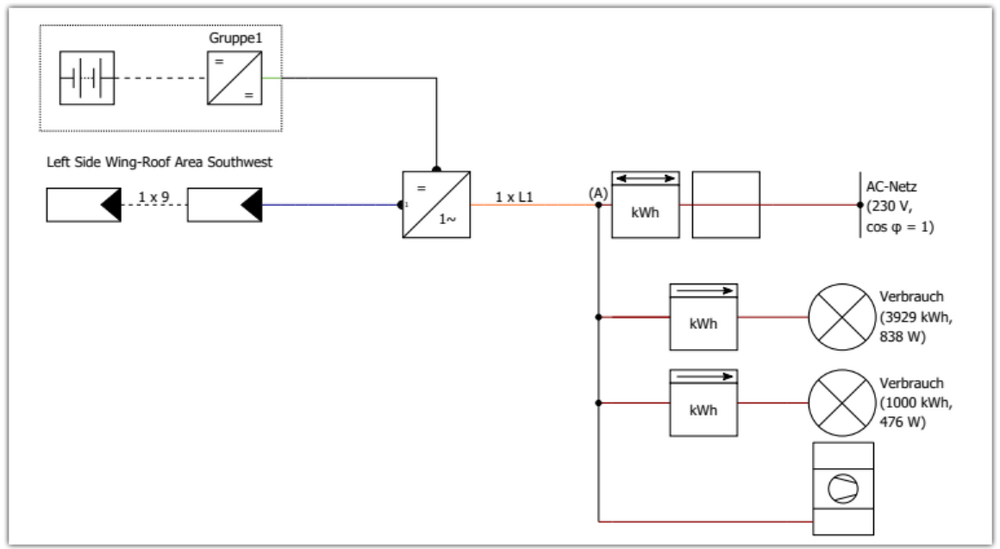
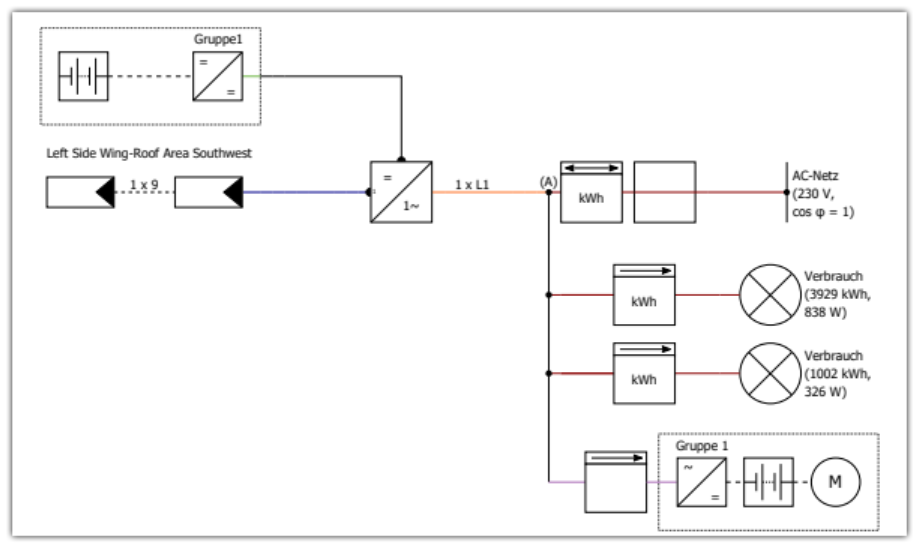
Hallo, vielen Dank für Ihre Anfrage. In PV*SOL können Sie Wärmepumpe und E-Fahrzeug bisher noch nicht als Anlagenart miteinander kombinieren. In der Anlagenart mit thermischem System können Sie, nachdem Sie auf der Seite Wirtschaftlichkeit einen zweiten Bezugstarif für die Wärmepumpe ausgewählt haben, einen Schaltplan mit Haushaltsverbrauch hinter Z2 und Wärmepumpe hinter Z3 generieren. Zusätzlich können Sie auf der Seite Verbrauch einen zweiten Verbraucher hinzufügen. Über diesen zweiten Verbraucher können Sie den Verbrauch des E-Fahrzeugs darstellen. In diesem Fall hängt der Haushaltsverbrauch hinter Z2, das E-Fahrzeug hinter Z3 und zwischen den Zählern befindet sich die Wärmepumpe. In der Anlagenart mit E-Fahrzeug können Sie über den zweiten Verbraucher den Verbrauch der Wärmepumpe darstellen. In diesem Fall hängt der Haushaltsverbrauch hinter Z2, die Wärmepumpe hinter Z3 und das E-Fahrzeug hinter Z4.

-
Dear Jorge Lopez, Thank you for your inquiry. The following data sources are available: Meteonorm 9: Worldwide 2001 - 2020 PVGIS TMY: Europe, Africa complete North and South America for the most part (data from NSRDB) Asia for the most part For an overview of the coverage, see point 3 in the PVGIS Manual 2005 - 2023 Solcast TMY: Worldwide except for northernmost part of North America (about > 56°N) southernmost part of South America (about < 47°S) most north-eastern part of Russia 2007 - 2020 Valentin Software DWD TMY: Germany-wide for every square kilometre Based on high quality data from the DWD and the TMY3 method 1995 - 2012 SolarAnywhere TMY: Worldwide up to 60°N and 60°S North and South America (1998 - 2021) Europe (1998 - 2021) Central Asia and Africa (2000 - 2021) East Asia and Oceania (2006 - 2021) NREL Meteosat Worldwide up to 60°N and 60°S 1998 - today
-
Hallo Maik, vielen Dank für deine Anfrage. Wir geben deine Wünsche Import von Dateien im pdf-Format, Import mehrerer Pläne (die sich überlagern können), nachträgliche Änderung von Plänen (Verschieben, Löschen, Ersetzen, Einfügen) und gemeinsame Planung anhand von einem oder mehreren importierten Plänen in Kombination mit Google-Kartenausschnitt (und Nutzung der Google Solar API) an unsere Entwicklungsabteilung weiter.