developer_mh
-
Posts
1,855 -
Joined
-
Last visited
-
Days Won
173
Everything posted by developer_mh
-

Automatische Verkabelung beim 3D Modell - Kabeldurchführung wo?
developer_mh replied to Ifrit's topic in PV*SOL
Hallo Ifrit, die Kabeldurchführung findet sich hier: Beste Grüße, Martin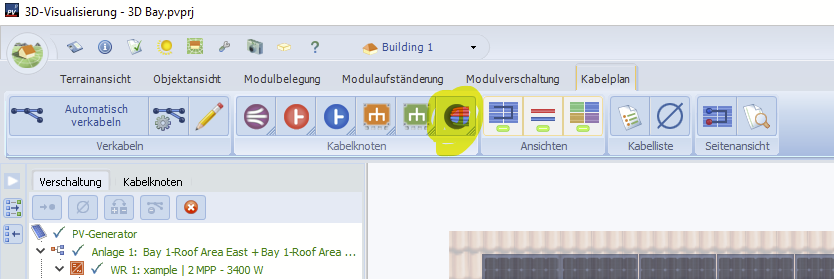
-
Hallo Ifrit, freut mich, dass es geklappt hat! Wenn noch Fragen auftauchen, gerne fragen Beste Grüße, Martin
-
[Request] Updated climate data for pre-selected locations
developer_mh replied to Jimmy's topic in PV*SOL
Hi Jimmy, thanks for the feature request, sounds good! We will put it on the list. Kind regards, Martin -
Hi James, yes, this is fixed in the upcoming release PV*SOL premium 2022 R5. We are very sorry for the unconvenience caused. Kind regards, Martin
-
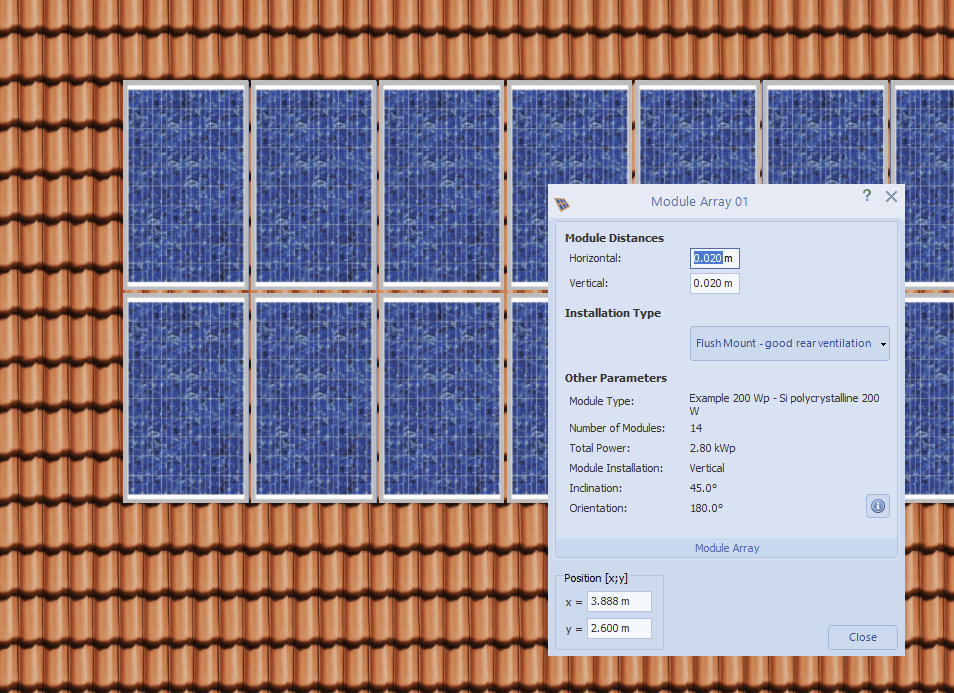
Hi Ludd, there is no automatic function to do this, I am afraid. You can enter the exact position, though. With a little math (x = (length of roof - length of module array)/2) you can determine the x value needed to center the modules. Hope that helps, kind regards, Martin
-
Photovoltaikanlage + Batterie in Verbindung mit einer Wärmepumpe
developer_mh replied to Marco EL's topic in PV*SOL
Hallo Marco, man kann derzeit in PV*SOL nur PV mit Batteriesystemen oder PV mit einem thermischen System simulieren. Eine Möglichkeit ist aber, den elektrischen Verbrauch der Wärmepumpe als "normalen" elektrischen Verbraucher in einem System mit PV und Batterie zu hinterlegen. Dann kann man alle drei Elemente miteinander simulieren. Allerdings ist das Energiemanagement dann natürlich nicht besonders intelligent. Der elektrische Verbrauch wird ja immer vorrangig bedient. Genau das Energiemanagement, das die Energieflüsse zwischen Batteriesystem, Wärmepumpe und gegebenenfalls Elektro-Auto leitet, ist bisher nicht implementiert. Daher können wir diese Option bisher nicht in PV*SOL anbieten. Nein, GeoT*SOL ist ein reines Wärmepumpen-Programm. Man kann hiermit aber sehr schön realistische elektrische Wärmepumpenprofile erzeugen, die man dann in PV*SOL importieren kann. GeoT*SOL kann aber keine PV und keine Batteriesysteme. Hoffe, das hilft weiter. Beste Grüße, Martin -
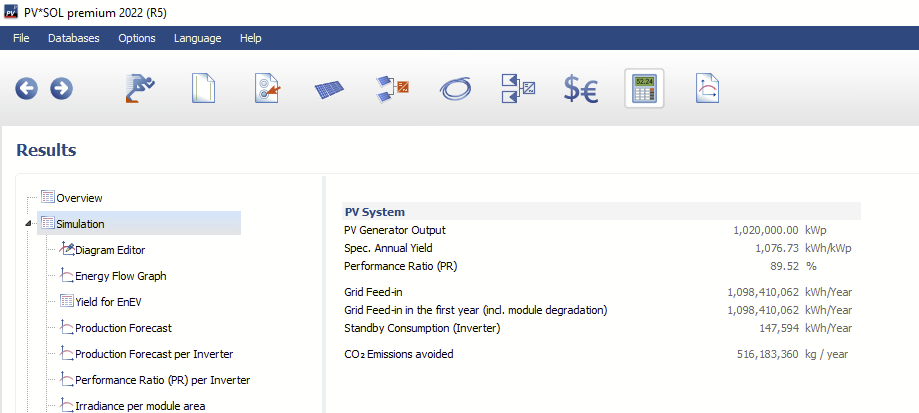
Here is a small screenshot of PV*SOL showing results for a 1 GWp PV system (simulation duration on my computer was < 1 min).
-
Dear Davidvc, the only restriction we have in PV*SOL is the number of modules and mounting systems used in the 3D environment. If you plan without 3D, the PV plant size is unlimited. If you plan in 3D, we restrict the maximum module number to 10000 (or 7500 for mounting systems). If you multiply that by the current nominal power of a typical module, say 350 Wp, you get 3.5 MWp as a limit. The threshold is editable in the settings file, though. It really depends on your computer.. Without 3D planning, you can easily simulate more than 500 MWp. Kind regards, Martin
-
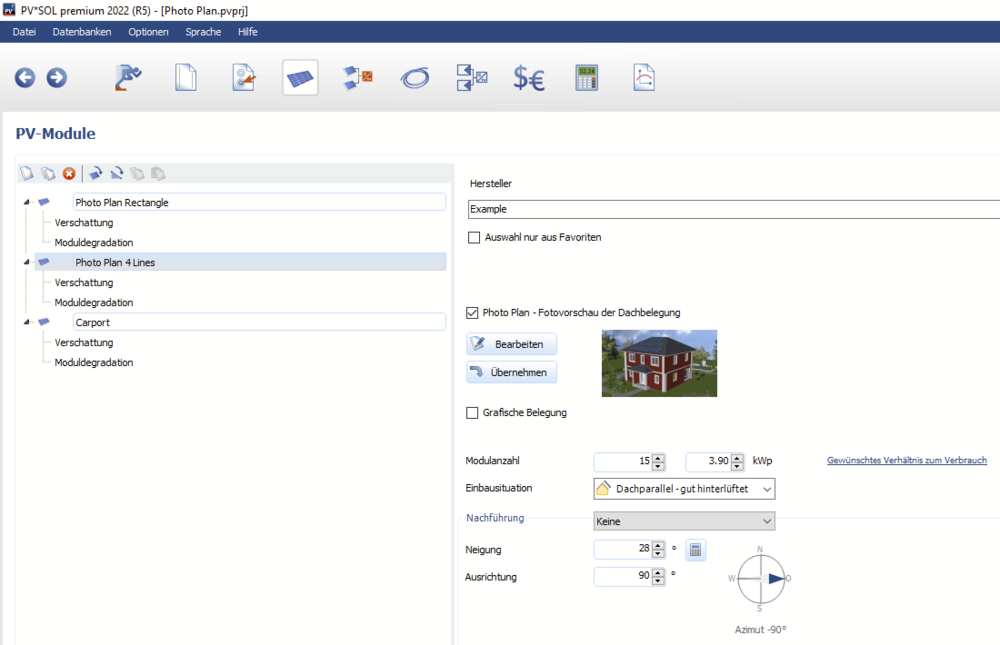
Hallo Mats, das geht, indem man pro Dachfläche eine Modulfläche anlegt. In der Beispiel-Datei "photoplan" ist das so gemacht: Beste Grüße, Martin
-
Hi LuaiD, thank you for the project. The solar fraction in net metering projects is the PV generator energy (AC) divided by the consumption, so in this case 865154 kWh ÷ 1532128 kWh = 56.5 % The level of self sufficiency is the fraction of the consumption that has not to be covered by the grid, so 1 - ( 983668 kWh ÷ 1532317 kWh ) = 35.8 %. The difference between "Energy from Grid" in the consumption section and "covered by grid" in the section "Level of self-sufficiency" is the grid feed-in. "Covered by grid" is everything that comes from the grid, "Energy from grid" is "covered by grid" minus the grid feed in. Hope that helps, kind regards, Martin
-
Hi xueting, I understand that it is not possible for you to send the file. It will be difficult to identify the problems then, I guess. Yes, this is absolutely reasonable. This is good. Additionally, can you check if the peak of the daily sun height curve is in sync with the peak of the daily irradiation curve? No, the position of the sun is calculated in the software, for each time step. Some more question/issues to look at: Can you post screenshots of the PV module database entry? Do you have the measured data on the DC side of the inverter? Did you measure and import one complete year of irradiance data? From 01. January to 31. December? Kind regards, Martin
-
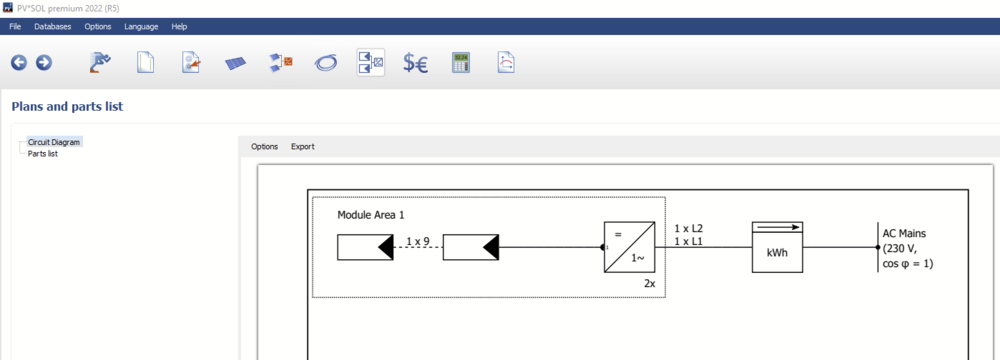
Hi Codrin, I am sorry, I'm not sure if I understand your question correctly. If you have a PV system with modules and inverters, you can just click on the page "Plans and parts list" and see the circuit diagram: If you want to edit the cabling, you can do so on the page "Cables". Kind regards, Martin
-
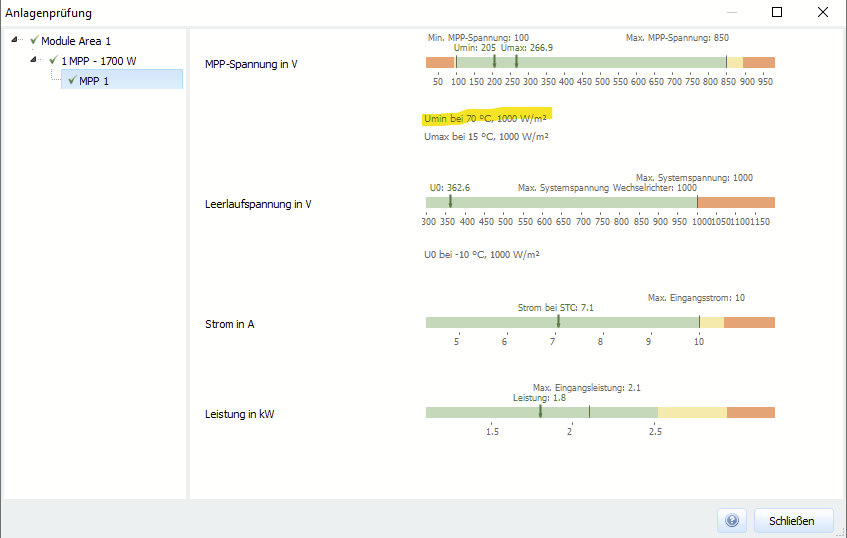
Hallo N_G, bei der Anlagenprüfung wird überprüft, ob die möglicherweise auftretenden Spannungen und Ströme der PV-Module über den ganzen Betriebsbereich noch vom Wechselrichter verarbeitet werden können. Die Überprüfung der minimalen MPP-Spannung findet bei dem Betriebspunkt 70°C und 1000 W/m² statt. Daher stehen da in der Warnung bei dir nur 28,7 V und nicht 34,9 V. Die Überprüfung nach der maximalen MPP-Spannung findet bei 15°C und 1000 W/m² statt. Die Überprüfung der Leerlaufspannung hingegen bei -10°C und 1000 W/m². Diese Werte entsprechen dem Stand der Technik, den best practices der Auslegung sozusagen. Sie sind aber auch in den Optionen einstellbar, wenn einem was anderes vorschwebt. Beste Grüße, Martin
-
Hallo N_G, hast du für die zehn Jahre je eine Datei? Wenn ja, musst du sicherstellen, dass sich die Bezeichner in der ersten Header-Zeile unterscheiden. Sonst denkt PV*SOL, dass die Datei schon vorhanden ist. Beste Grüße, Martin
-
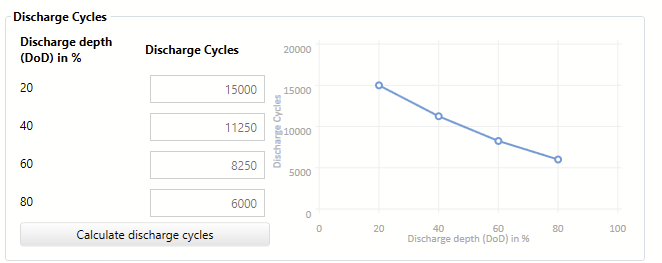
Hi David, PV*SOL takes the cycles from the database entry of the respective battery system, more precisely from the battery that is used in the battery system: The deeper the depth of discharge, the smaller the cycle number that the battery system can run. In the simulation, the current DoD of the battery is taken in order to determine the cycle load for the current time step. Hope that helps, kind regards, Martin
- 1 reply
-
- 2
-

-
Dear xueting, this looks good so far. So as a next step I would recommend to look at the irradiance values before and after the simulation. Best option here would be the diagram editor where you can select the time series you want to analyze. You can select the "Irradiance onto horizontal plane" and the "Irradiance onto tilted plane" and see how it looks like. You can right click and copy the values to the clipboard, and compare them to the values that you imported. Just to be sure, also have a look at the elevation of the sun. Its curve must be in sync with the irradiance values, that is, sunrise and sunset must not be shifted. Next check would be the PV module data that you entered. Especially the low light behaviour might be a reason for an unusually good performance. If you wish, you can also send your irradiance data as well as the project file so that I can have a quick look. you can send the files here in the forum via private message. Kind regards, Martin
-
Batteriesysteme in Datenbank mit falscher Kapazität hinterlegt
developer_mh replied to Ralf's topic in PV*SOL
Hallo Ralf, ja, ich verstehe das Problem. Im Datenblatt steht bei der Anmerkung zur nutzbaren Kapazität Folgendes: Da wurde scheinbar der Begriff nutzbare Kapazität für Marketingzwecke etwas gedehnt. 100% DoD (depth of discharge) ist eben genau nicht die nutzbare Kapazität, sondern die Nennkapazität. Eingegeben werden die Systeme ja in der Regel vom Hersteller. Ich leite das mal an unser Datenbank-Team weiter, dass die nochmal bei GoodWe nachhorchen. In der Zwischenzeit kannst du das entsprechende Batterie-System aber auch einfach kopieren und für den minimalen SOC eure 7% eingeben. Den Wunsch nach widerspruchsfreien Daten hegen wir in der Tat auch, ziemlich intensiv sogar. Gerade in Bezug auf leider oft eher marketingorientierte Datenblätter bleibt dieser Wunsch jedoch des Öfteren unbefriedigt. Beste Grüße, Martin -
Falsche Einheitsangaben bei WärmepumpeImport (GeoTSOL)
developer_mh replied to BobWolf's topic in PV*SOL
Hallo BobWolf, beim Ex- und beim Import der Daten ist da scheinbar ein Fehler mit dem Dezimal-Trennzeichen aufgetreten. Am besten vor dem Import in PV*SOL mal die exportierte Datei mit einem Texteditor öffnen und schauen, welches Dezimaltrennzeichen dort verwendet wird (das ist abhängig von den Systemeinstellungen). Dieses Dezimaltrennzeichen ist dann beim Import der Daten in PV*SOL anzugeben. Beste Grüße, Martin -
Hallo aqualx, ein separater Strombezugstarif ist nur möglich bei der Verwendung des thermischen Systems. Beste Grüße, Martin
- 1 reply
-
- 1
-
-
Batteriesysteme in Datenbank mit falscher Kapazität hinterlegt
developer_mh replied to Ralf's topic in PV*SOL
Hallo Ralf, bei den Batterie-Systemen muss man unterscheiden zwischen der Nennkapazität und der nutzbaren Kapazität. In diesem Fall hat z.B. das System mit der BYD HVS 10.2 eine Nennkapazität von 25 Ah auf 409,6 V = 10,2 kWh. Der minimale Ladezustand liegt bei 20% (etwas hoch, aber durchaus realistisch), der maximale bei 100% (meiner Meinung nach eher zu hoch, da Batterien nur sehr selten bei diesen hohen Füllständen betrieben werden sollten). Daher sind nur 80% der Nennkapazität auch wirklich nutzbar. 80% von 10,2 kWh macht 8,2 kWh. Kein Grund zur Sorge also. Beste Grüße, Martin -
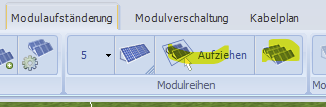
Hallo Semjon, am besten erstellt man Aufständerungen nicht nur mit einem Element, das man dann vervielfachen muss, sondern gleich mit der gewünschten Anzahl an Elementen. Dazu kann man entweder einen Rahmen aufziehen, der dann mit der Aufständerung gefüllt wird, oder man kann die gesamte Fläche maximal belegen lassen: Beste Grüße, Martin
-
Hallo in die Runde, wir haben SMA bereits mehrfach kontaktiert, sie wissen also Bescheid. Wir hoffen ebenfalls, dass sie die fehlenden Modelle zeitnah eintragen. Viele Grüße, Martin
-
Hi Codrin, no, you can't define a charge/discharge schedule for the battery systems right now, I am afraid. You can set the SOC limits however, which already gives plenty of possibilities to modify the charging behaviour: https://help.valentin-software.com/pvsol/en/pages/battery-system/charging-strategy/ The feature request to be able to define a schedule as well is already on our list, but it is not planned yet, I am afraid. Kind regards, Martin
-
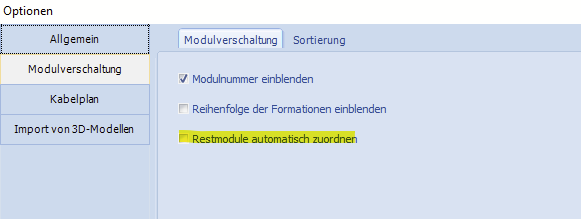
Hallo Hannes, inwiefern funktioniert das nicht mehr? Ich habe es eben nochmal probiert und es scheint mir so zu funktionieren wie immer.. Wenn alle Module bereits in Strings verschaltet sind, und man weist z.B. die Module von MPP-Tracker 2 dem MPP-Tracker 1 zu, dann werden die bisher an MPP-Tracker 1 verschalteten Module entfernt. Ist es das, was du meinst? Diese "freien" Module können dann aber leicht über einen Rechtsklick wieder einem Tracker oder einem Strings zugewiesen werden. Dies kann man auch automatisch erledigen lassen, in den Optionen gibt es hier eine entsprechende Einstellung: Wenn das aktiviert ist, hat man beim Arbeiten vielleicht eher das Gefühl von einem echten Modul-Tausch, da die frei werdenden Module wieder direkt zugewiesen werden. Beste Grüße, Martin
-
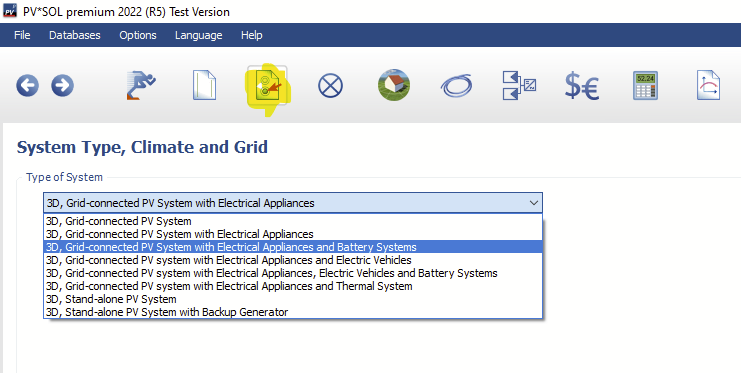
Hi CodrinSomesan, yes, you can simulate PV systems with electrical appliances and battery systems in PV*SOL. We have around 3000 real battery systems in our database which you can try out. Additionally you can define your own battery system. In order to see the battery system page, you'll have to activate a corresponding system type: Kind regards, Martin