-
Posts
1,822 -
Joined
-
Last visited
-
Days Won
169
Everything posted by developer_mh
-

Economic calculation (originally: Finanční analýza)
developer_mh replied to P.Kubín's topic in PV*SOL
Hi P.Kubín, here is a translation of your question by deepl.com: Which economical model do you have? Is it net metering oder surplus feed-in? In net metering it is irrelevant which portion of the PV energy can be used directly by the consumers. It works just with a balance on monthly or annual basis that checks how much was produced and how much was consumed. Kind regards, Martin -
Hallo Sven, wir geben allen Batteriespeichern zu Beginn der Simulation einen Ladezustand (SoC) von 80% der absoluten Kapazität (nicht zu verwechseln mit der nutzbaren Kapazität oder Nennkapazität). Wenn sich der Wert der "Ladung am Anfang" leicht unterscheidet, liegt das mit Sicherheit an leicht unterschiedlichen Kapazitäten der verwendeten Batteriesysteme. Beste Grüße, Martin
-
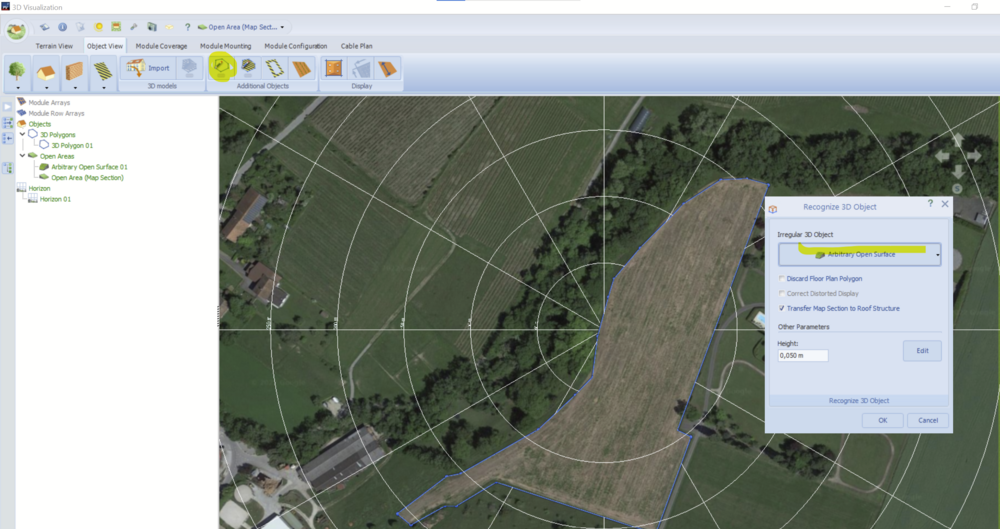
Hallo Plane, man kann auf importierten Screenshots oder Karten einfach mit dem Polygon-Tool zeichnen und im Anschluss per Rechtsklick auf Extrudieren und dann Freifläche wählen: Beste Grüße, Martin
-

Verschaltungsgrenzen Dimensionierungsfaktor Solar Edge
developer_mh replied to sparti117's topic in PV*SOL
Hallo sparti117, der Vollständigkeit halber hier nochmal die deutsche Übersetzung der englischen Antwort hier: Beste Grüße, Martin -
Hi Esteban, the project looks right to me, except perhaps for the time at the charging station. I am not sure that the way you have parametrized it here will represent what you intended. The way you parametrized it, you'll have five cars coming in at 8h in the morning that will start to charge immediately until they are full. Since all 5 cars only leave at 18h in the evening I'd guess that they are already fully charged around 12h and staying on the charging station for some hours in the afternoon without getting charged. In order to have a continuous charging of electric vehicles you would have to change the time at the charging station so that there is more movement. Define the cars not all in one group but create 5 separate groups with varying time schedule. Like so perhaps Group 1 (first car) Group 2 (second car) and so on.. Hope that helps, kind regards, Martin
-
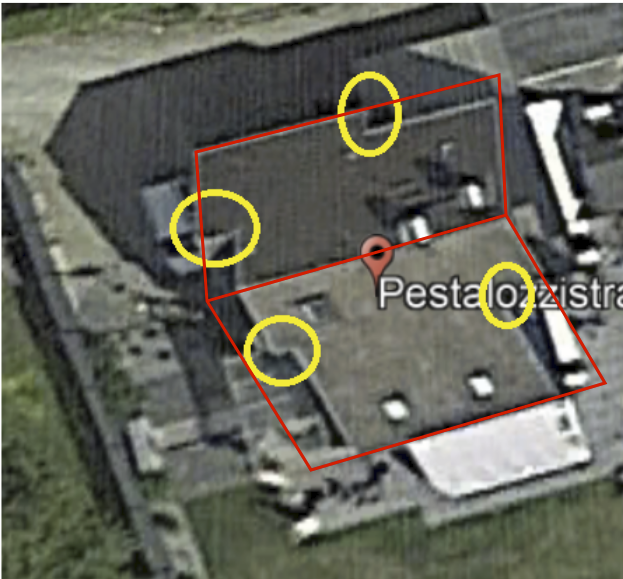
Hi Abdel, while it would in theory be possible to create such a roof in PV*SOL by combining three buildings with a part of the roof each, I'd rather recommend the following: model a standard gable roof with the maximum dimensions and then exclude the areas that do not belong to the roof surface with barred areas: or model the roof in a full featured 3D modelling software like Blender or Sketchup, and then import it in PV*SOL. Hope that helps, kind regards, Martin
-
Hi Andreas, if you have 100m distance between the inverter and the modules, you have to enter 200m cable length go-and-return, 100m for the (+) cable and 100m for the (-) cable. Often, the (+) cable and the (-) cable do not have the same length due to the conditions at the installation location, so we decided to have the user just put in the total length. The length of the module cables must not be included in the DC cabling length, as these are already taken into account in the PV module datasheet. The electrical properties of the PV modules are always measured at the end of the module cables, so the resistance of the module cables is already included. Hope that helps, kind regards, Martin
-

Module Mountind shade frequency and cable plan not working
developer_mh replied to Diogo Levandoski's topic in PV*SOL
Hi Diogo Levandoski, it looks like you have done the shading frequency calculation correctly. I guess that there are just no shadows on the module mountings? Just to be sure, place a wall or a chimney next to the modules and run the shading calculation again. As for the cabling of mounted modules: The cabling feature in 3D is not available for mounted systems. You can, however, define cabling details when you return from the 3D environment, on the cable page. Kind regards, Martin -
Dear sparti117, this is correct, the dimensioning factor for SolarEdge systems is constant and not changeable by the user. This is intended as SolarEdge gives predefined dimensionion factors for their configurations. For 3-phase inverters the maximum dimensioning factor is 150%. For single phase inverters it is 155% for HDwave models and 135% for all other models. Kind regards, Martin
-
Hi Andreas, the maximum feed-in power clipping is related to the nominal DC power of the modules in kWp. So the value would be 20%. Kind regards, Martin
-
Hallo Sebowksy, bei den Volleinspeise-Tarifen handelt es sich ja um Zuschläge, die man bei vorhandenem separatem Zähler zusätzlich zur normalen Einspeisevergütung bekommen soll. Dies wurde aber von der EU-Kommission noch nicht freigegeben und daher hat auch die Bundesnetzagentur dazu noch nichts veröffentlicht. Deswegen sind diese Volleinspeise-Zuschläge noch nicht in PV*SOL verfügbar. https://www.pv-magazine.de/2022/08/17/verbraucherzentrale-nrw-gibt-tipps-zu-neuregelungen-fuer-private-photovoltaik-dachanlagen/ Wir bleiben aber natürlich dran und bringen ein Update, sobald sich was tut. Beste Grüße, Martin
-

wie Enphase Mikrowechselrichter IQ 7A Micro oder IQ7+Micro verschalten
developer_mh replied to tobi's topic in PV*SOL
Hallo tobi, an sich hast du da schon alles richtig gemacht. Nur hat der IQ7A eben einen maximalen Eingangstrom von 10,2 A, siehe Datenblatt (https://enphase.com/de-de/download/mikro-wechselrichter-der-iq7-serie-datenblatt) Das Modul hier (habe als Beispiel das "Solar Fabrik Mono S4 Halfcut 410W" gewählt) hat einen MPP Strom bei STC von 12,91 A. Daher erscheint die Meldung, dass das nicht passt. Aber: Es ist nur ein Warnhinweis, simuliert werden kann trotzdem (unter Zukaufnahme der entsprechenden Abregelungsverluste). Der maximale Kurzschlussstrom, ab dem es für den Wechselrichter gefährlich wird, liegt laut Datenblatt allerdings erst bei 15 A, also könnte man diese Kombination gefahrlos betreiben. Im Zweifel nochmal hier überprüfen: https://enphase.com/installers/microinverters/calculator Polystring bräuchte man für diese Verschaltung übrigens nicht. Aber es stört auch nicht. Viele Grüße, Martin -
Hallo MarieH, man kann in PV*SOL den Heizstab auch direkt parametrisieren und mit simulieren, wäre das eine Lösung? Dazu einfach bei der Anlagenart ein thermisches System wählen, und dann das entsprechende System wählen: https://help.valentin-software.com/pvsol/de/navigationsseiten/thermisches-system/ Beste Grüße, Martin
-
Guten Tag, kleiner Nachtrag: Die neuen Tarife sind jetzt da (seit 10. August). Die aktuellen Einspeisetarife können nun wie üblich aus der Liste an mitgelieferten Tarifen gewählt werden. Beste Grüße, Martin
-
Dear Zahra, the tariff is fine, I guess there is something wrong with the other parameters of the financial calculation. Could you provide the project file, please? You can send it to me here in the forum via private message. Kind regards, Martin
-
Hi Abdullah, thank you for your valuable input. Could you tell me which inverter you are referring to? In order to investigate the problem, it would be very helpful if you could provide a project file. You can send it to me here in the forum via private message, thank you. Kind regards, Martin
-
Hi Eduard, please send en email with your customer nr and a project file attached to our technical support team: hotline@valentin-software.com. They might be able to help you out. Kind regards, Martin
-
Hi Infinitech, it looks like the scaling override behaviour is not set to the default value. See this thread here: Also be sure not to use the Windows 11 from the release preview channel. Kind regards, Martin
-
Sure, whatever works on your machine
-
Hi Esteban, no problem, just write an email with your customer number and the serial number to sales@valentin-software.com and tell them what happened. They can unlock it then. Kind regards, Martin
-
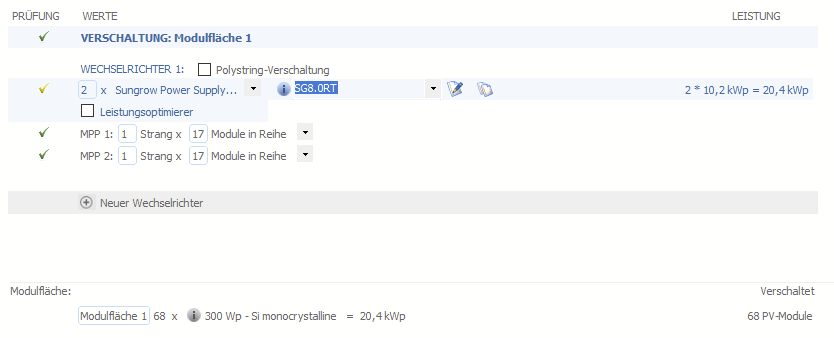
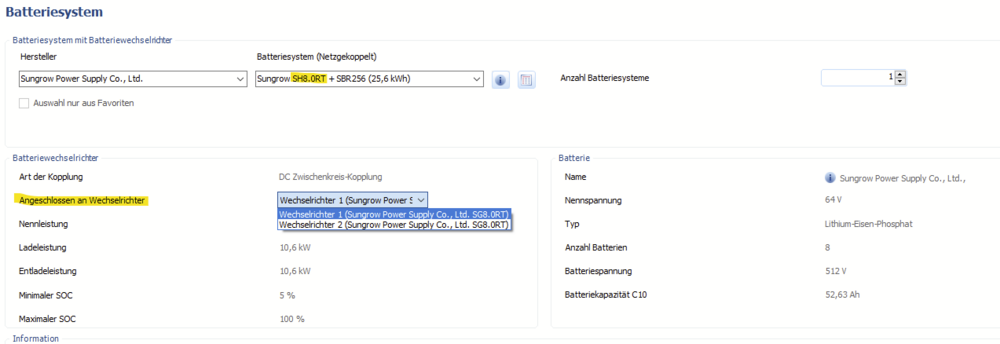
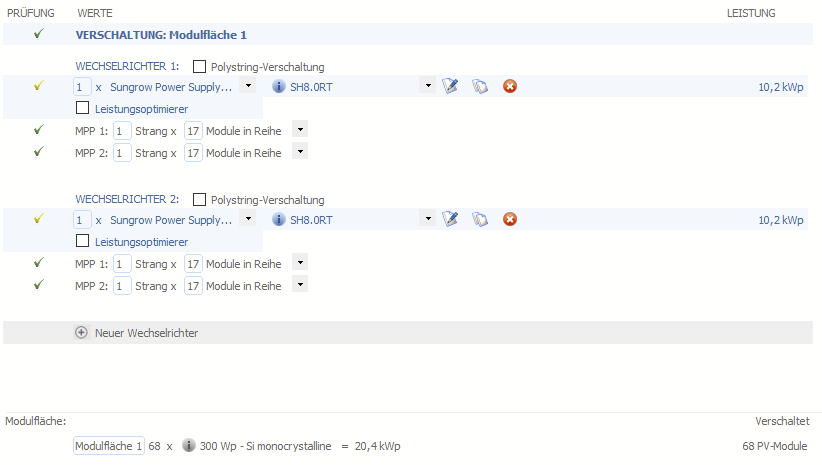
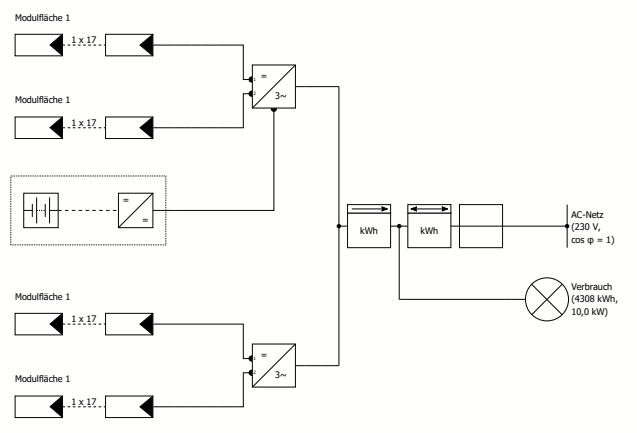
Hallo Danov, da gibt es verschiedene Möglichkeiten in PV*SOL. Wichtig ist zu wissen, dass in PV*SOL der PV-Wechselrichter und das Batteriesystem nicht zwangsläufig zwei verschiedene Geräte sind. Es werden sozusagen die Funktionalitäten getrennt voneinander behandelt, in der PRaxis kann es sich aber um ein und dasselbe Gerät handeln, das beiden Funktionalitäten (PV-Wechselrichter und Batterie-System) in sich vereint. Hier z.B. habe ich 2 Sungrow SH8.0RT an 68 mal 300 Wp Modulen, also etwa 20 kWp: Auf der Seite "Batteriesystem" wähle ich nun ebenfalls den SH8.0RT, da ich möchte, dass der Speicher an einem der beiden Geräte hängt. An welchem, kann in der Auswahlbox gewählt werden: Damit ergibt sich dann folgendes Schaltbild: Nur von dem, der an die Anlage angeschlossen ist. Ja, das geht. In PV*SOL gibt es da keine Logik, die erkennt, welcher Wechselrichter hybrid ist und welcher nicht. In der Praxis muss man natürlich aufpassen, dass man die richtigen Geräte verplant. Beste Grüße, Martin
-
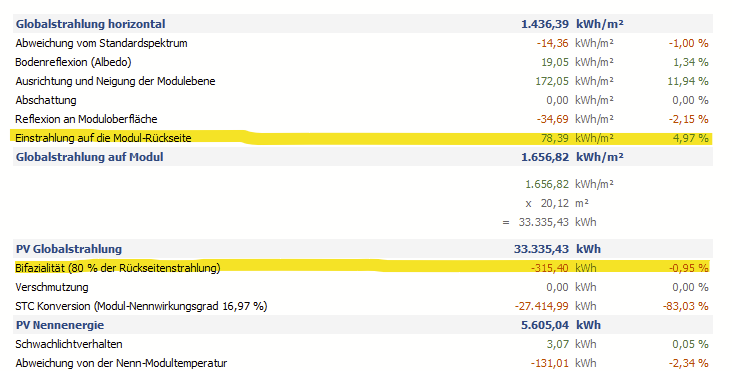
Hallo N_G, eine ganz genaue Aussage über den Mehrertrag wäre nur durch eine Vergleichsimulation möglich, da sich durch die Strahlung auf der Rückseite ja auch die Ströme in den Zellen, im Modul und in den Kabeln erhöhen, die dann wiederum höhere ohmsche Verluste aufweisen usw. Aber in erster Näherung bekommt man die Einstrahlung auf die Modulrückseite als Bonus hinzu, wovon aber nicht alles vom Modul umgewandelt werden kann. Hierfür steht der Bifazialitätsfaktor. Ist er 1 bzw. 100%, kann die Strahlung auf die Rückseite komplett verwertet werden (natürlich immer noch begrenzt durch den Wirkungsgrad der Zellen). Beste Grüße, Martin
-
Dear Patrycja, I translated your question with Google Translate: The scaling of the axes in the diagrams is done automatically. Also the grid lines are set automatically, there is no way to change that. You can, however, right click on the diagram, export the data to Excel or LibreOffice Calc, and create a diagram there. Kind regards, Martin
-
Hi Vishnu, you can try changing the High DPI override behavior as described here: Also apply these settings to ValentinSoftware.PV.Desktop.Wow6432.exe Kind regards, Martin


