


developer_mh
-
Posts
1,855 -
Joined
-
Last visited
-
Days Won
173
Everything posted by developer_mh
-
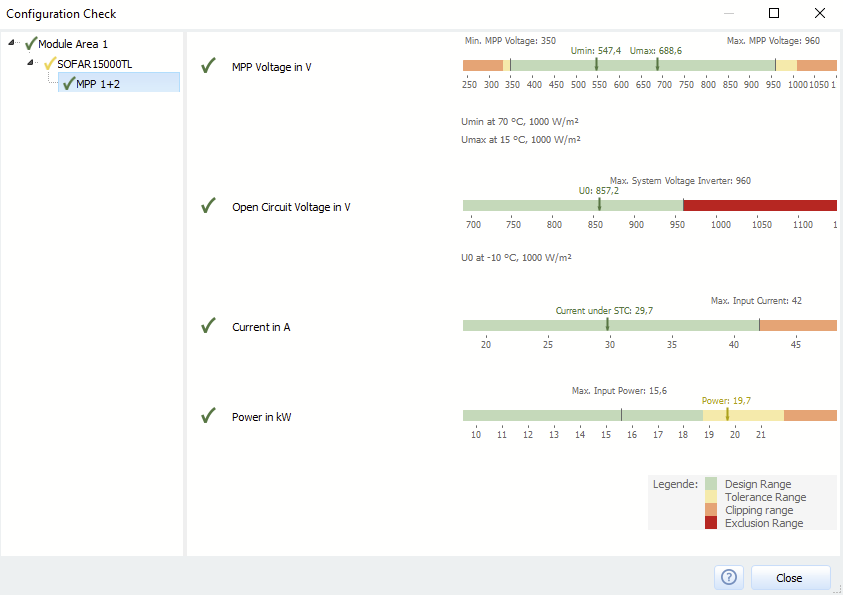
Hi Elektroinstalator, here is the deepl.com translation of your inquiry: I am not sure if I can help with this problem as it seems hardware related. But voltage wise, 16 modules of around 40 V (= 640 V) should be enough to get the inverter running. The MPP voltage range of the 15000TL is between 350 and 960 V, so from that perspective everything looks fine. Here is an example configuration check for 3 x 16 Trina TSM-410-DEG15MC.20 modules: Hope that helps, kind regards, Martin
-
Hallo Philipp, wie Frederik schon sagte, für die korrekte Simulation ist es ausreichend, die Dachfläche wie ein normales Haus zu extrudieren. Wenn das nciht gewünscht ist, müsste das 3D Modell vorher in einem anderen 3D Programm (z.B. Sketchup oder Blender oä) erstellt und dann in PV*SOL importiert werden. Beste Grüße, Martin
-

3D Modellierung aus Sateliten, falsche Textur Übernahme
developer_mh replied to enick's topic in PV*SOL
Hallo enick, könntest du Screenshots von dem Problem posten? Ich kann mir leider gerade nicht vorstellen, was genau das Problem ist. Danke und beste Grüße, Martin -
Ertragsminderung bei Abschattung : WR mit/ohne Schattenmanagement
developer_mh replied to BeKa's topic in PV*SOL
Hallo Liambru, das Schattenmanagement wird automatisch berücksichtigt, es muss nicht aktiviert werden. Beste Grüße, Martin -
Hallo Willy, eine pauschale Antwort auf diese Frage ist leider nicht möglich. Letzten Endes hilft da wahrscheinlich nur die Erfahrung weiter. Interessant für die Simulation ist ein verschattendes Objekt ja nur, wenn es innerhalb eines Jahres auch tatsächlich in mindestens einer Stunde auch Schatten auf die PV-Anlage wirft. Um herauszufinden, ob ein Baum oder ein Haus in der Nähe noch verschattet, ist es hilfreich, in der 3D Umgebung einfach ein solches Objekt zu erstellen und dann die Schattenhäufigkeit auf den PV-Modulen berechnen zu lassen. Auch das Sonnenstandstool oben in der Menü-Leiste kann hilfreich sein. Beste Grüße, Martin
- 1 reply
-
- 1
-

-
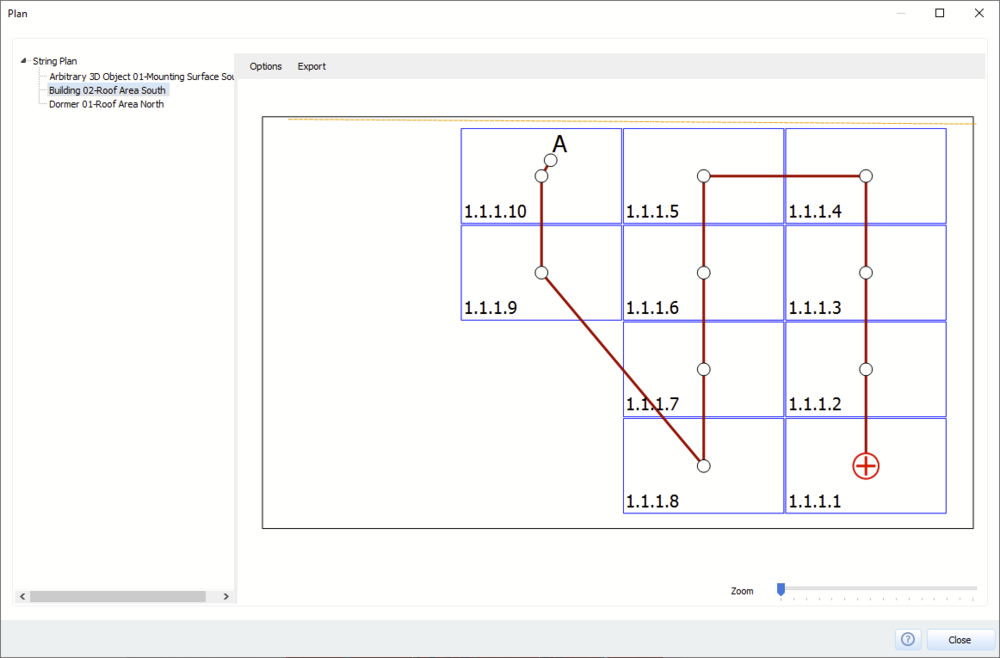
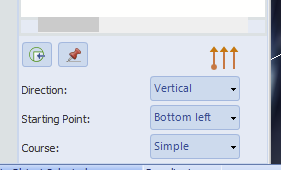
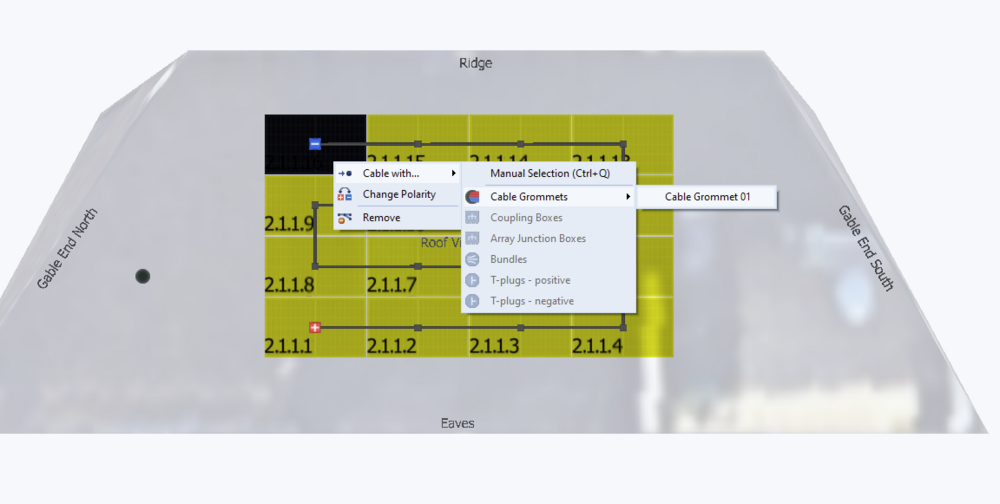
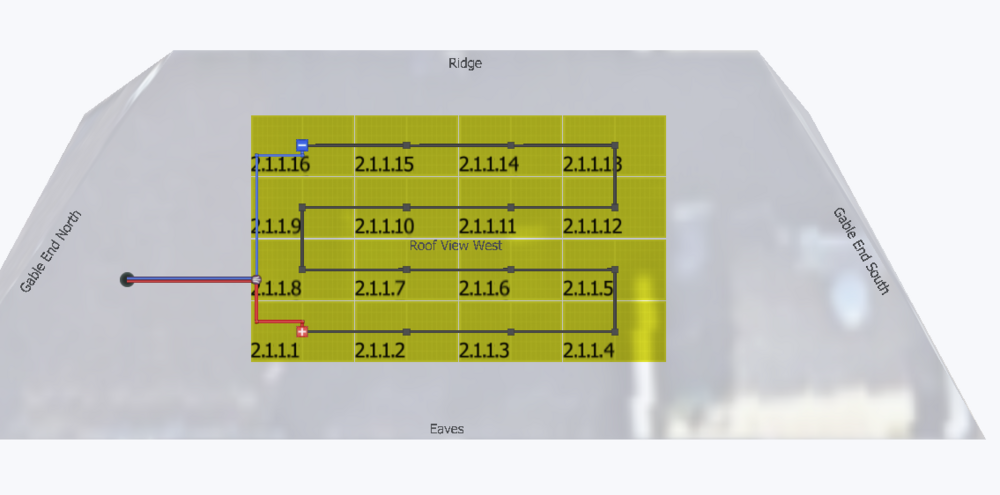
Hallo mustafoe, die Verkabelung erfolgt in der Reihenfolge der Modulnummerierung. Hier ein Beispiel: Die Reihenfolge und Sortierung kann mit diesen Optionen hier ganz gut voreingestellt werden: Wenn dann einzelnen Module nicht da einsortiert werden, wo es gewünscht ist, kann man sie einfach per drag n drop dorthin ziehen, wo sie sein sollen. Und man kann zwar nicht den Wechselrichter relativ zum Dach platzieren, aber man kann z.B. Kabeldurchführungen platzieren, mit denen man dann verkabeln kann. Beste Grüße, Martin


-
Hallo bernhard, wenn die Horizont-Linie so in PV*SOL eingelesen wird, wird der etwas spätere Sonnenaufgang automatisch berücksichtigt. https://help.valentin-software.com/pvsol/de/navigationsseiten/pv-module/verschattung/ Beste Grüße, Martin
-
Dear Zuher, please never post your personal information like email address or serial number here in the forums. Like the rest of the internet, it is full of malicious bots and agents that you don't want to get access to your personal data. Please contact our sales team at sales@valentin-software.com with your inquiry. Kind regards, Martin
-
Dear Johan thank you for the project file. In this case, the display of the connection of the DC intermediate circuit coupling of the battery system in PV*SOL is a bit misleading. In the 3D environment, there are 4 inverters, all of the same type and with the same configuration layout (2 x 15 on each MPP tracker). So, in the PV*SOL main software, these 4 inverters are displayed as one group (4x inverter xy). The DC battery system, which consists of 4 units, appears to be connected to the group of 4 inverters (one battery system on one PV inverter). But, unfortunately, our simulation core realizes that the shadows on the PV modules over the 4 inverters are not the same and calculates each inverter separately. The DC battery system, scaled by factor 4, then is only connected to the first of the 4 inverters. So, in the simulation, the battery system only sees the PV energy from inverter one, which is far less than the load profile, and this is the reason why the battery system is never charged. We will make that clearer in the upcoming release in order to avoid PV systems with that kind of confusing (or wrong) connection. Hope that helps, kind regards, Martin
-
PVSOL 2023 R3 Gets stuck on Results page. See Youtube video.
developer_mh replied to Marius Fourie's topic in PV*SOL
Dear all, Thanks to the project files Jan sent me, we were able to find the bug. It will be fixed in the next release. In the meantime, you can use the Force Simulation command from the Options menu as a workaround if the simulation gets stuck. This will only happen on 3D projects that you have already simulated, if you go back to 3D, change the shading objects (and nothing else) and then simulate. Hope that helps, kind regards, Martin
-
PVSOL 2023 R3 Gets stuck on Results page. See Youtube video.
developer_mh replied to Marius Fourie's topic in PV*SOL
Dear Jan, yes, please provide both projects! That would be very helpful as we still didn't receive other projects where this happens. Thanks a lot, kind regards, Martin -
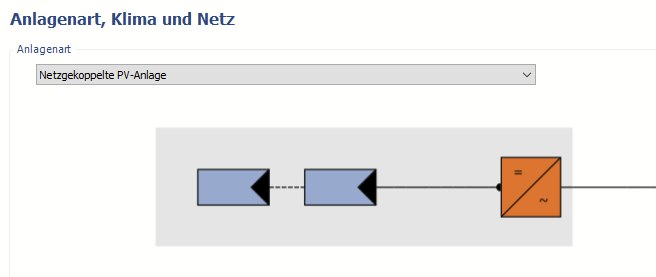
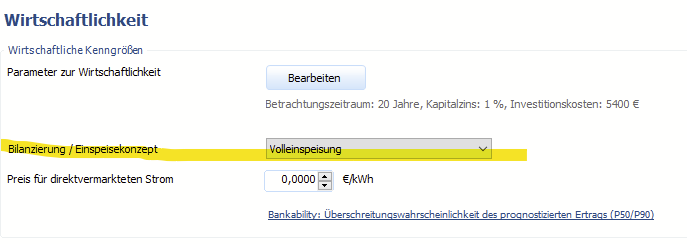
Hallo Marc2356, ja, richtig, beim Tarif „EEG 2023 (Volleinspeisung) - Gebäudeanlagen" darf es keinen Eigenverbrauch geben. Dazu bitte bei der Anlagenart auf "Netzgekoppelte Anlage" wechseln: Dann ändert sich die Bilanzierung auf Volleinspeisung: Beste Grüße, Martin
- 1 reply
-
- 1
-

-
Fenster für 3D-Visualisierung wird nicht vollständig angezeigt
developer_mh replied to BeKa's topic in PV*SOL
Hallo BeKa, dabei handelt es sich um einen Darstellungsfehler bei Bildschirmen mit einer Skalierung von über 100%. Das kommt auf manchen Rechner immer wieder vor. Im Forum gibt es einige Tipps und Tricks, um das Problem zu beheben. Z.B. hier: Viele Grüße, Martin -
Hallo Calin, könntest du mir das Projekt zukommen lassen? Gerne hier im Forum als private Nachricht, danke. Viele Grüße, Martin
-
Hallo Stefa, ich kenne zwar die genaue csv nicht, die man vom DWD bekommt, aber wenn die Diffus- und Direktstrahlung auf die Horizontale enthalten sind, kann man diese ganz einfach zur Globalstrahlung auf die Horizontale addieren. Wichtig ist eben, dass es sich um die Strahlung auf die Horizontale handelt. Beste Grüße, Martin
-
Hi Hamza, PV*SOL only runs on Windows, I am afraid. But no worries, even if your Mac only has 8 GB of RAM, you can set up a virtual machine with 3 to 4 GB, that should be sufficient to run Windows and PV*SOL. Kind regards, Martin
-
Dear Michail_Volt, this should be no problem, just contact our sales team at sales@valentin-software.com with your inquiry. Kind regards, Martin
-
Selecting text and editing it takes me to the top of the box
developer_mh replied to Stepkuk's topic in PV*SOL
Hi Stepkuk, thanks a lot for reporting this! It'll be fixed in the next release. That is sad to hear, but you are right, the quality of the new text boxes as replacement for the older ones was far from sufficient. We really apologize for that. Kind regards, Martin -
Dear liszo, the tilt of the model should be corrected in the software that you use to create the obj file. In PV*SOL, you can only flip or rotate imported 3D models by 90°. Hope that helps, kind regards, Martin
-
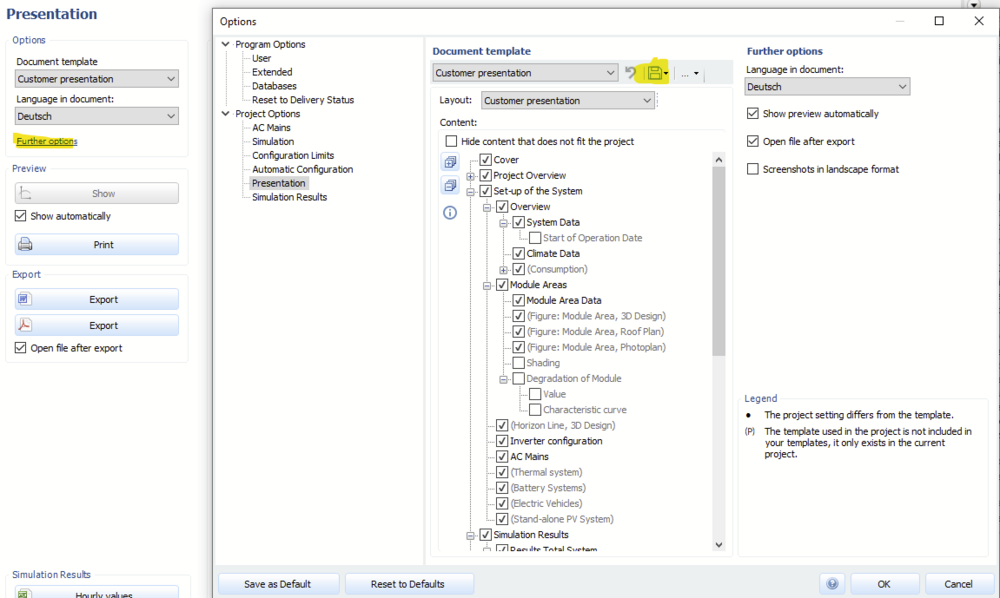
Hi Solar Designer, do you mean a template for the project report? You can use your own company logo and also modify and save the project report configuration, if that is what you mean: Kind regards, Martin
-
Dear Johan, would it be possible for you to send the project file so that I can have a look into it? You can send it here in the forum as a private message to me. Thanks and kind regards, Martin
-
Hi Solar Designer, climate data can be derived from various sources, using various methods. In PV*SOL we offer our users to use climate data by the following providers: Meteonorm Valentin Software (our own method, for Germany only) PVGIS Solcast SolarAnywhere These providers all use different approaches and different data sources. Most of the time, a mixture of satellite imagery and ground measurement is used as input data. Please also have a look at our help pages, there you'll also find links to the providers: https://help.valentin-software.com/pvsol/en/pages/system-type-climate-and-grid/meteosyn/#create-new-location Kind regards, Martin
-
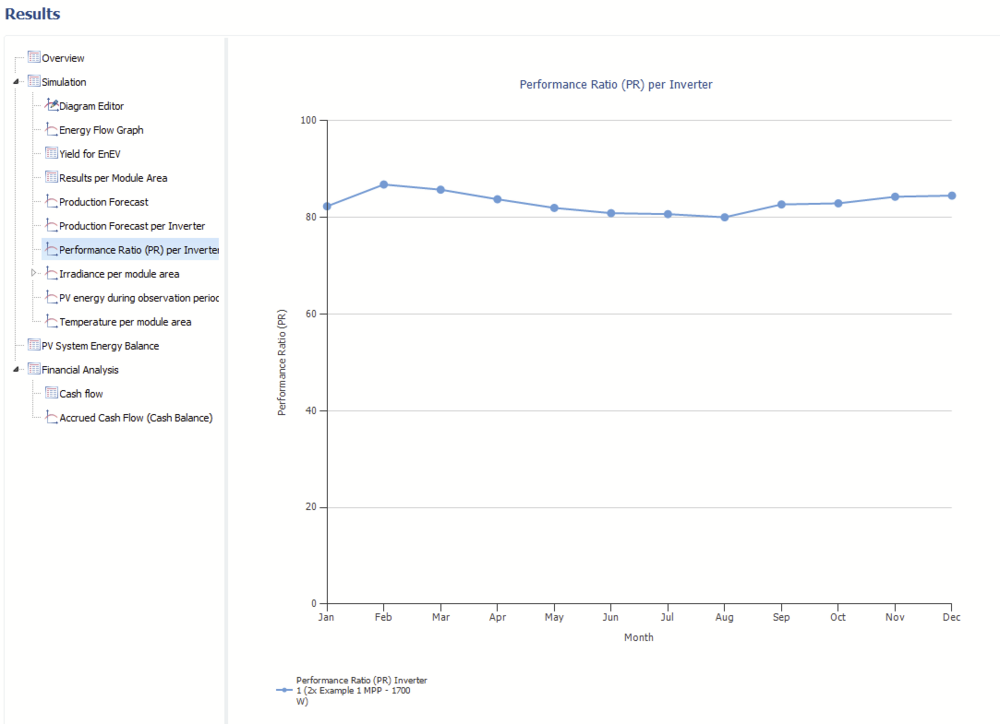
Hi Marta, the monthly PR values can be found on the page "Results", under "Simulation" and then "Performance Ratio": You can also copy the values of the diagram by right clicking on it. Kind regards, Martin
-
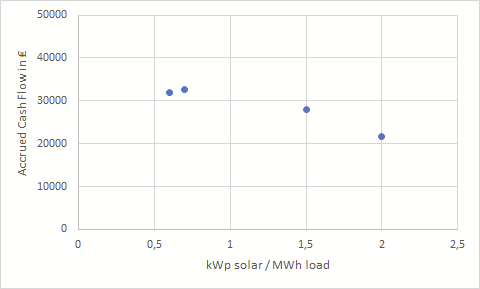
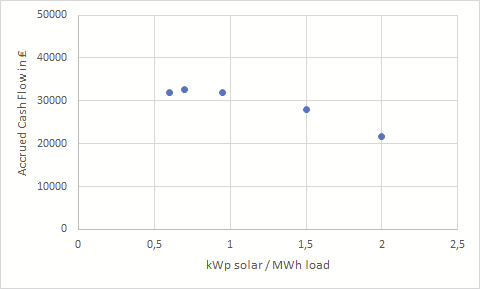
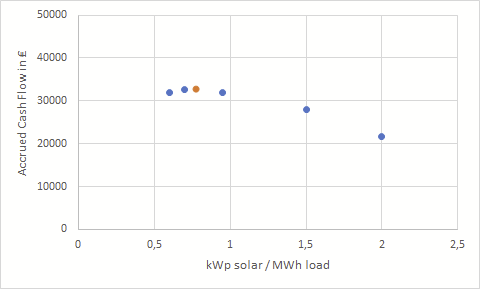
Hi RaW, Yes, but it will not favour PV installations of unlimited size. As you can see in the blue curve, there is an optimum - that is what we will want to aim for. No, this is not yet available in the official PV*SOL version that our customers can buy. I have generated these figures and graphs directly from our code. Our goal would be to fully understand the optimisation process and then come up with a solution that is helpful to our customers and doesn't require a complete rewrite of our software. The 49 MWh came from the load profile you provided (48884 kWh to be precise). The 100 MWh was just an arbitrary choice to roughly double the consumption. In my simulations, I can go from 10 to 500 panels, simulate each system and write down the results. The aim would be for our customers to be able to do this automatically in the future. At the moment, as this feature is not yet available in PV*SOL, the user would have to iterate manually to find the perfect system size. My point was that once you know that there is an optimum point somewhere between 0.6 and 2 kWp/MWh, you can speed up the process dramatically. Let's look at this in more detail, let's say we have a consumption of 49 MWh, load profile G2 (which corresponds to the yellow line in the diagram above): You start with 0.6 kWp / MWh = 29.4 kWp (approx 72 PV modules of 410 Wp each) You simulate and get an Accrued Cash Flow of around 32 000 ₤ Then you go with 0.7 kWp / MWh = 34.3 kWp (approx 84 PV modules) You simulate and get 32 600 ₤ Now you already know that the optimum will be at a point larger than 0.7 You repeat the same for the two points 2 kWp / MWh and 1.5 kWp / MWh which will give you 21 700 ₤ and 28 000 ₤ respectively This will give you these for points: You can now calculate (or estimate) the point where the two lines through the pairs of points will intersect. In this case it is 0.95 kWp/MWh: Now you calculate the cash flow for 0.95 kWp/MWh, and you get approx. 31 900 ₤ and the diagram looks like this: Now you know your optimum is between 0.7 and 0.95 kWp / MWh. Determine the next point, 0.77 in this case is where the two lines intersect: Simulating with 0.77 kWp / MWh (i.e. 37.7 kWp or 92 PV modules), the Accrued Cash Flow is around 32 800 ₤, which is already a good optimum: Of course, this still involves some manual work, but you don't have to iterate through all the possible system sizes. In this case, six simulations are sufficient. When you write up the Accrued Cash Flow results for your client and then show them the diagram, you will have a really convincing way of explaining why you chose this size of system and not a larger or smaller one. We will also discuss how and when we can implement a first simple version of the optimisation in PV*SOL. But as we already have a lot of topics on our list, I can't give you a date at the moment. I hope this helps, best regards, Martin


-
Dear users, this problem is fixed now in Release R3: https://valentin-software.com/en/products/pvsol-premium/#release-notes Kind regards, Martin


