


developer_mh
-
Posts
1,855 -
Joined
-
Last visited
-
Days Won
173
Everything posted by developer_mh
-
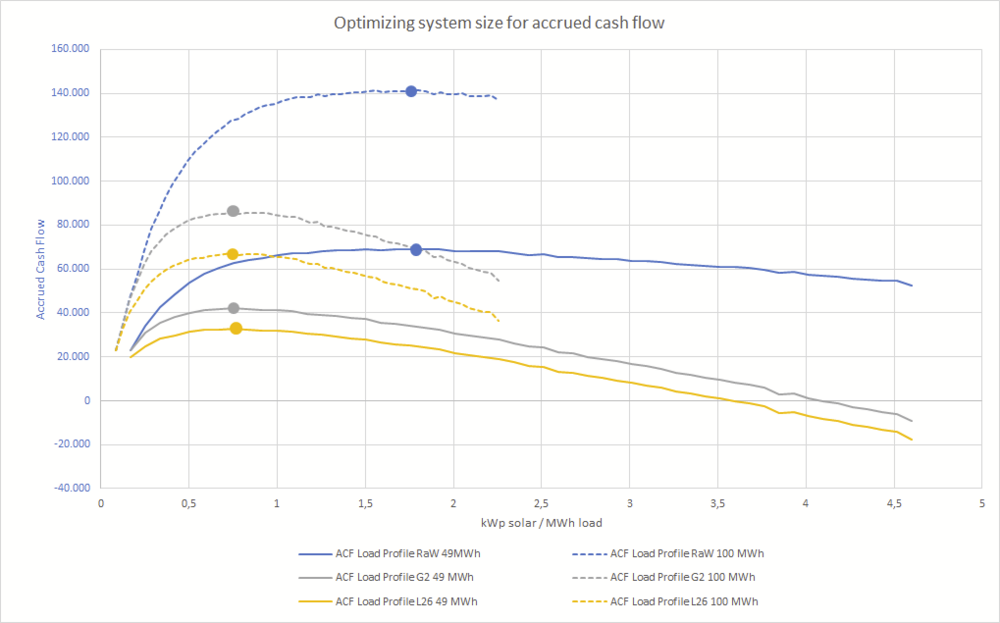
 Hi RaW, thanks a lot for the data. I had a look into it and made a simple series of simulations in order to find a good optimization target. As pointed out in my previous post, the ROI is not a very good measure as it is highest for small PV installations and decreases continously when the installation size increases. The accrued cash flow however might be a good starting point to optimize for. For my small experiment I created a project with your data and simulated the same project over and over (automatically, which is possible from our code), with varying PV system size. The installation costs are in £/kWp, so they scale automatically. I also tried different load profiles, and scaled each load profile once for 49 MWh and once for 100 MWh per year. Of course this is only a quick and very sketchy analysis, but it turns out that the optimum point is somewhat stable in the range between 0.6 to 2 kWp solar per MWh of load. That means if you have 49 MWh of annual consumption you could go for a PV system size of 30 to 100 kWp. So, in the example of the load profile you provided, with 49 MWh of annual consumption, DMEGC 410 Wp modules, Solax hybrid inverters (and the arbitray location Manchester), the optimum PV system size is 180 panels (= 74 kWp). If the annual consumption doubles to 100 MWh, the PV system size will double, too. If the type of load profile varies, the sweet spot will move, too. It is always specific to the project where the optimum system size will be. But knowing that there is an optimum somewhere, presumably around 1 kWp/MWh, you could start iterating around this point, back and forth. Finding the sweet spot like this should be relatively fast. This all is without taking into account battery storage, this would be too extensive for me right now, but I guess the process would roughly be the same. I'd be happy if you could take a minute and see if this kind of optimization process is what you were looking for. Especially if the accrued cash flow is the right optimization target. I could then talk about that with my colleagues and think about ways of implementing this into a feature. Kind regards, Martin
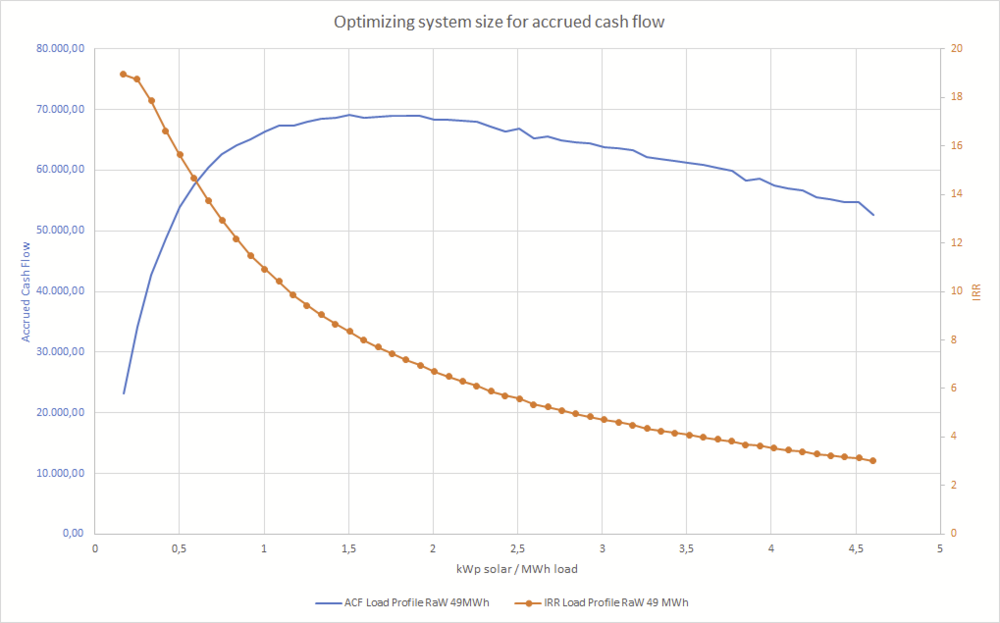
-
Fehlerhafte Berechnung Autarkiegrad, Eigenverbrauchsanteil
developer_mh replied to Jons's topic in PV*SOL
Hallo Stephan, wahrscheinlich muss einfach nur noch einmal simuliert werden. Dazu im Menü auf Optionen -> Simulation erzwingen. Viele Grüße, Martin -
PVSOL 2023 R3 Gets stuck on Results page. See Youtube video.
developer_mh replied to Marius Fourie's topic in PV*SOL
Hi Marius Fourie, thanks a lot for the video. We had a similar issue in R2 that was actually fixed with 3D. Could you provide the project file, please? You can send it to me by private message here in the forum, thank you. Kind regards, Martin -
Hallo Daniel Marigou, danke für den Hinweis, jetzt sollte es gehen. Leider bekommen wir da keine automatische Nachricht, wenn unser Postfach voll ist.. Beste Grüße, Martin
-
Hi Craig, it is hard to see in the diagram but I would guess that it is there, just very very small compared to the normal consumption. You could try and export the numbers (right click) and then import them in Excel to see the values. Kind regards, Martin
-
Hi Alain, this is really weird, I've never seen anything like this. Does this issue persist? Have you tried restarting and updating the drivers of your graphics card? Kind regards, Martin
-
Hi RaW, in order to make things easier, would it be possible for you to provide the consumption as Excel file (or csv). Thanks and kind regards, Martin
-
Fehlerhafte Berechnung Autarkiegrad, Eigenverbrauchsanteil
developer_mh replied to Jons's topic in PV*SOL
Hallo Jons, danke für die Meldung. Dabei handelt es sich um einen Fehler, der seit der Version 2023 R2 auftritt, wenn Anlagen aus der 3D Umgebung keine Schatten haben. Wir versuchen, das Update auf R3 so schnell wie möglich zu veröffentlichen. Viele Grüße, Martin -
Hi Craig, this is due to the simultaneity of PV generation and consumption. In addition, the battery storage is limited in its capacity and connected load. Thus, there may always be situations in which the consumers cannot be supplied by the PV or the storage and energy must be drawn from the grid. In order to better understand these effects, I would recommend to have a look at the hourly data (the time series graph in the Diagram Editor). There you can see for every hour (or minute), how much your PV system is producing, how much the loads consume, how full your storage is and so on. In this manner you can get a better understand of the system behaviour. Hope that helps, kind regards, Martin
-
PV-Anlage mit thermischen System, Batteriespeicher und Elektrofahrzeugen
developer_mh replied to Wolfgam's topic in PV*SOL
Hallo Philipp, das Lastprofil kann man sich entweder aus dem csv-Export extrahieren (hinten auf der Seite Präsentation gibt es eine Möglichkeit, die Daten zu exportieren), oder man wählt sich auf der Seite Ergebnisse beim Diagramm-Editor die entsprechende Datenreihe aus, macht das ganze Jahr sichtbar und klickt dann rechts mit der Maus auf die Grafik und exportiert die Daten in die Zwischenablage. Hoffe, das hilft weiter, beste Grüße, Martin -
Hallo Johnny, momentan wird die herstellerspezifische Unterkonstruktion nicht mit in PV*SOL geplant. Wenn mit einer bestimmten UK geplant werden soll, wird empfohlen, das jeweilige Hersteller-Tool zu verwenden. Wir arbeiten jedoch derzeit an einer Integration von PV*SOL und einem dieser Tools, so dass dieser Prozess in Zukunft möglichst einfach gestaltet wird. Viele Grüße, Martin
-
Hallo Andreas, ich habe die Anfrage an das Datenbank-Team weitergeleitet, sodass sie den Hersteller kontaktieren und bei ihm nachfragen können. Viele Grüße, Martin
-
Neue Hybridwechselrichter GoodWe (GM15/20/25/29.9K-ET)
developer_mh replied to Die Solarmacher's topic in PV*SOL
Hallo Die Solarmacher, ich leite die Anfrage an unser Datenbank-Team weiter, vielen Dank. Beste Grüße, Martin -
Hi RaW, thank you for the reply. I am sorry, but I don't understand that sentence: Do you mean you would present an upcoming job here so that we can discuss the best solution for the customer here? That would be great, I guess! Also, I doubt that pure ROI can be a suitable target for an optimization process. The ROI will always be high if your investment is relatively small, for a small PV installation that produces so little energy that everything can directly be used to cover the loads. Say you have a consumption on site of 25000 kWh and you install a 1kWp PV system for around 1300 €, your ROI will be extraordinary (in percent), but the cash balance in € will be negligible. Kind regards, Martin
-
Dear RaW, dear Jordn, in order to be able to understand exactly what kind of optimisation process you are looking for, it would be very helpful if you could provide an detailed example of how you manually do those ROI optimisations right now. Kind regards, Martin
-
Hi Rohith, the results according to EnEV are based on very rough calculations. For example the inclination angle only has the possible values 0, 30, 45, 60 and 90 °. There are a lot of other limitations as well, so you should pay much attention to those numbers. You only need(ed) them for some German subsidy programs and the like. Kind regards, Martin
- 1 reply
-
- 1
-

-
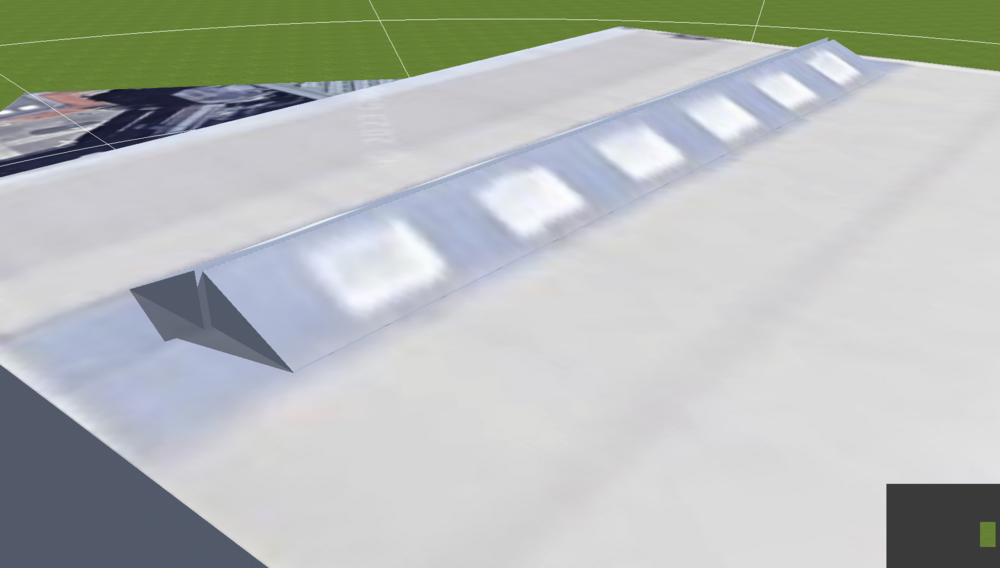
Dear Orakel952, if the light domes do not have to be round, you can just use the extrusion tool: In your case you would extrude the whole ridge at once, in two segments, I guess. Then you can also add an inclination like so: I made two extrusion (but didn't move them close together so that we see more detail): Hope that helps, kind regards, Martin
-
Hi Aleksandar, that is correct. You can find this diagram in the Diagram Editor when you select "Carpet Plot" instead of time series. The values you see there are the monthly averages. Kind regards, Martin
-
PV*SOL premium 2023 Release 2 had some weird decisions...
developer_mh replied to Stepkuk's topic in PV*SOL
Hi Stepkuk, thank you for your feedback. The removal of the right-click option was not intended, I am afraid. We will try to bring it back in the next release. The reason we had to swap out the former text boxes was that they didn't work well in high DPI scenarios. We are sorry if the exchange of the components also had some unwanted effects. I am sure we can fix that. Kind regards, Martin -
Hallo Hannes, vielen Dank für das Projekt. Meine Vermutung war richtig, der Netzbezug kommt durch den oben beschriebenen Effekt zustande. Was die Deckung der Wandlungsverluste aus der Batterie angeht: Das werde ich mal prüfen bzw auch mit den Kollegen diskutieren, danke für den Hinweis. Beste Grüße, Martin
-
Hi anees, sorry for the late reply! Do you have the project file for us, please? You can send it to me by private message, thank you. Kind regards, Martin
-
Hallo osthausbeckert, entschuldige die späte Antwort. Aufgrund von Urlaub und Krankheit müssen wir dich aber auch leider weiter vertrösten. Nächste Woche sollten wir aber mit einer Antwort aufwarten können. Beste Grüße, Martin
-
Hi matk, could you elaborate? Where do you want to remove a battery from? A screenshot would help, perhaps. Kind regards, Martin
-
Hallo Amadeus, wenn die Häuser so verstreut liegen, würde ich nicht empfehlen, sie alle zusammen an einen Wechselrichter zu verschalten. Das würde sehr lange DC-Kabellängen bedeuten, die man eigentlich versucht zu vermeiden. Am besten einfach jedes Haus für sich verschalten. Für SolarEdge bietet sich vielleicht auch die automatische Verschaltung an? https://help.valentin-software.com/pvsol/de/navigationsseiten/wechselrichter/verschaltung/#automatische-solaredge-verschaltung Viele Grüße, Martin
-
Hallo Daniel Marigou, das müsste ich mir direkt im Projekt anschauen. Könntest du es mir als private Nachricht hier im Forum schicken, bitte? Ja, die Hersteller haben sie so genannt, aber die elektrischen Daten ergeben 20 kWh (2V Zellspannung * 28 Zellen in Reihe * 369 Ah Kapazität bei C10, macht 20,6 kWh) Ah, nein? Das sollte eigentlich möglich sein.. ich kann entweder direkt Bilder in das Textfeld einfügen (strg+v) oder unten auf "choose files" ein Bild zum Hochladen auswählen. Gibt es diese Funktionen nicht bei dir? Beste Grüße, Martin


