developer_mh
-
Posts
1,855 -
Joined
-
Last visited
-
Days Won
173
Everything posted by developer_mh
-

E-Auto Anschaffung in Zukunft Vebrauchsprofil
developer_mh replied to ZukunftEnergie's topic in PV*SOL
Hallo ZukunftsEnergie, so ganz verstehe ich die Frage glaube ich nicht. Wenn man die Wirtschaftlichkeit mit E-Auto berechnen möchte, empfiehlt sich die Anlagenart "Netzgekoppelte PV-Anlage mit elektrischen Verbrauchern und Elektrofahrzeuge". Wenn man das E-Auto nicht mit rechnen möchte, wählt man "Netzgekoppelte PV-Anlage mit elektrischen Verbrauchern". Die Anlagenart ist fix und kann nicht für den Betrachtungszeitraum der Wirtschaftlichkeit geändert werden. Es ist also nicht möglich, die ersten 5 Jahre z.B. ohne E-Auto und die restlichen 15 Jahre dann mit E-Auto zu rechnen. Beste Grüße, Martin -
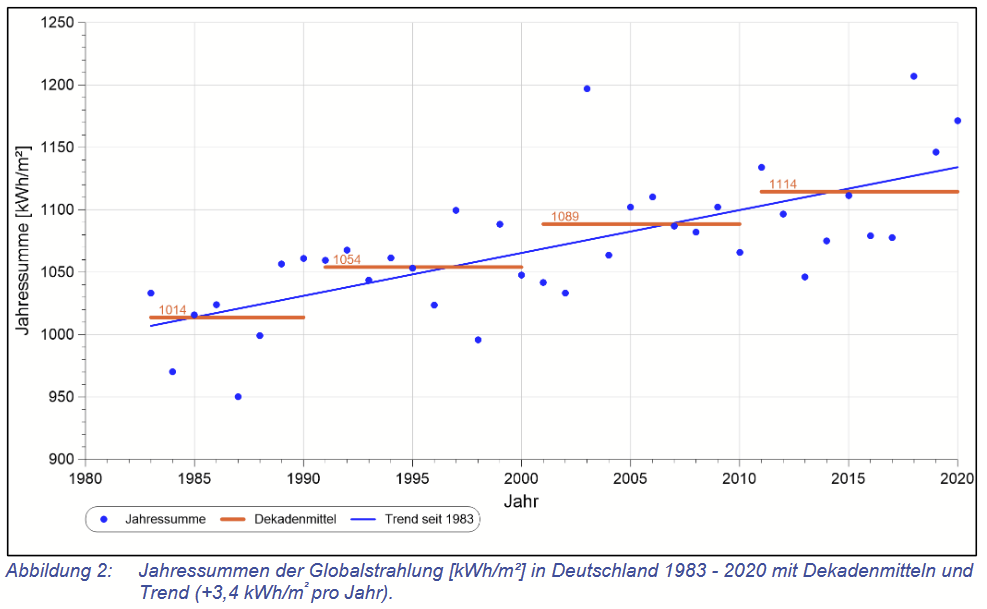
Hallo KWR, ja, das ist eine sehr gute Frage, auf die es keine eindeutige Antwort à la "X ist gut, Y ist schlecht" gibt. Ein Klimadatensatz sollte prinzipiell verschiedene Qualitätskriterien erfüllen, und je nach Anwendungsfall kann es sein, dass man Klimadaten aus Quelle A oder Quelle B beorzugt. Es ist immer gut, die Klimadaten einschätzen und dann entscheiden zu können, welche man verwenden möchte. Der Zeitraum ist eines der Kriterien, und es ist richtig, dass die Einstrahlung in den letzten Jahren relativ konstant zugenommen hat. So hat man mit den Valentin-TMY3-Datensätzen auf Basis der DWD-Daten aus dem Zeitraum 1995 - 2012 in der Regel weniger Einstrahlung im Jahr als mit den PVGIS- oder Solcast-Daten mit aktuelleren Zeiträumen. Hier mal eine Grafik aus einer aktuellen Studie des DWD, in der es genau um dieses Thema geht: Link zur Studie Dieser Anstieg hat laut den Experten vor allen Dingen mit der sauberer werdenden Luft zu tun, also mit der Abnahme der Luftverschmutzung. Es wird erwartet, dass dieser Effekt in den nächsten Jahren nicht weiter zu einem Anstieg der Globalstrahlung führen wird, da die Luft und die Atmosphäre ja auch nicht unaufhörlich sauberer werden kann. Wenn man nun eine PV-Anlage planen möchte und deren Wirtschaftlichkeit für die nächsten 20 oder 25 Jahre berechnen möchte, kann man sowohl Gründe für die Verwendung eines eher konservativen als auch eines eher aktuelleren Zeitraums finden. Fest steht: Je höher die Einstrahlung im Klimadatensatz, mit der man rechnet, desto besser die Writschaftlichkeit. Aber auch: Desto höher die Wahrscheinlichkeit, dass es Jahre gibt, in denen die tatsächliche Einstrahlung hinter der aus dem Klimadatensatz zurückbleibt. Hier noch weiterführende Links: https://help.valentin-software.com/pvsol/de/navigationsseiten/anlagenart-klima-und-netz/meteosyn/ https://help.valentin-software.com/pvsol/de/berechnungsgrundlagen/einstrahlung/klimadaten/ Beste Grüße, Martin
-
Hi Venco Gary, this is a bug that is going to be fixed in the next release PV*SOL premium 2023 R4. Sorry for the inconvenience caused, best regards, Martin
-
Hi Esteban, thank you for the feature request. We already have it on our list, but I can't give a date for this yet, I am afraid. What you can do right now is to swap the corresponding lines in the PVSOL.ini. Just have a look at the file here: C:\Users\USERNAME\Documents\Valentin EnergieSoftware\PVSOL premium 2023\PVSOL.ini There is a line that starts with "Benutzerdaten": <Benutzerdaten Ansprechpartner="" Unternehmen="" Adresse1="" Adresse2="" Land="" Telefon="" Telefax="" EMail="" Bildpfad="" /> You can edit your data in PV*SOL, close it an then copy the line to another file. You do that for both your companies, so that you just have to paste the correct line before starting PV*SOL. Hope that helps, kind regards, Martin
- 1 reply
-
- 1
-

-
Thanks, Levan, I have forwarded your request to our database team.
- 1 reply
-
- 1
-
-
Hi Jackie, we do not have a built in simulation method for shingled modules yet, I am afraid. But we do have it on our list. If you want to try a work around, I'd assume that as a first guess it might work when you enter the cell and bypass diode count according to the datasheet and then set the string orientation so that it is parallel to the long side. Kind regards, Martin
-
Hi kooll77, if you need help with the software, you can ask your question here, or contact our support team at hotline@valentin-software.com Kind regards, Martin
-
Hi RaW, Sorry for not getting back to you earlier. Short explanation/escuse: This forum here is a free service for our customers and run by us developers, in addition to our professional support team. So here we can only answer when our developer schedule allows. This very topic here, as interesting as it is, has already received quite a bit of attention, so I wasn't able to answer earlier. Hope you understand (but nevertheless I understand how urgent this topic might be for you!) So, I will try to go through your questions from the posts above: Actually, the exact value of the energy consumption does not matter. What I wanted to show you is an approach that enables you to find the sweet spot yourself, for any arbitrary annual consumption. 25 years in this example This is a tough question, and no one really knows The "Annual Average Return On Capital Employed" is like the average interest rate that you would get from your bank institute for the next 25 years if you would invest the money instead of buying a PV system. For finding the sweet spot I would recommend to create a separate project in 2D (without 3D that is). Altering the number of modules and the inverter configuration is a lot faster. As mentioned above, the exact value for the consumption is not important for the process of finding the sweet spot. After all, the process should work for every future project, not just for this one. Sometimes I write the consumption energy in MWh because it is shorter than the same value in kWh. Sorry if that caused confusion. I designed to initial project, with the climate data, consumption profile, PV module type, financial parameters and so on. Then I just varied the amount of PV modules, configured automatically with the inverters, simulated and wrote down the Accrued Cash Flow. Then I took 2 modules more, configured, simulated and wrote down the new Accrued Cash Flow, and so on. This is just where the maximum of the Accrued Cash Flow is in the plots. Let's say the maximum is at 0.75 kWp solar / MWh load (the yellow and grey dots in the graph above). In this example I had a consumption of 49 MWh (48884 kWh), which leads to 0.75 * 49 = 36 kWp of solar. This is the value where the maximum of the graph lies for the grey curve (approximately). The £32000 was the accrued cash flow for this example. Hope that helps, kind regards, Martin
-
Exactly!
-
Hi Hiu, you are right, the Solplant/Aiswei ASW5000H-S2 is not yet entered as inverter. I will forward this to our database team. In the meantime you could create a copy of the ASW5000S-G2 and edit the current, voltage and power values according to the datasheet of the ASW5000H-S2. https://help.valentin-software.com/pvsol/en/databases/components/inverters/ Hope that helps, kind regards, Martin
-
Dear GHO, thank you for the link. We will look into it. Kind regards, Martin
-
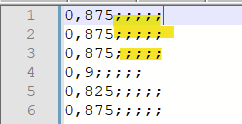
Hallo Thomas, das Problem werden die viele Semikolons sein: Und in Zeile 24781 gab es ein "x" zu viel. Anbei die bereinigte Datei, damit sollte es funktionieren. Beste Grüße, Martin 2023-03-28_TS_Pflegehotel Willingen GmbH _Willingen_2022_VAL.csv
-
Hallo Thomas, ich kann keine begefügte Datei sehen. Bitte nochmal hochladen, danke! Beste Grüße, Martin
-
Hallo Tobias, ja, die temporäre Lösung ist, per Strg+F5 (Ctrl+F5) zu simulieren. Der Bug wird in der nächsten Version (PV*SOL premium 2023 R4) gefixt sein. Beste Grüße, Martin
-
Hi Anneka, please find a short explanation of the charging modes here: https://help.valentin-software.com/pvsol/en/pages/electric-vehicles/ Kind regards, Martin
-
I want to zoom out more to see the entire model with modules.
developer_mh replied to Zhako's topic in PV*SOL
Hi Zhako, 21508 modules are far beyond the limit that we officially support in the 3D environment, I am afraid. You can try using the overview plan in order to get a full view: Hope that helps, kind regards, Martin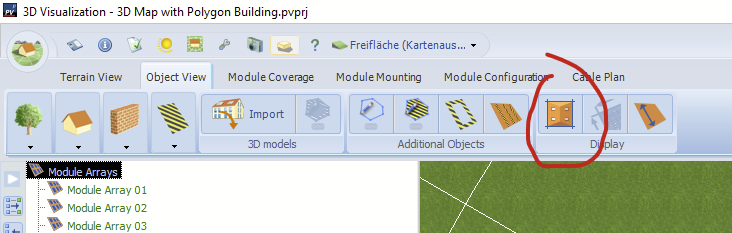
-
Battery Inverter config for Deye 3 Phase Hybrid Inverter (12K-SG04LP3-EU)
developer_mh replied to d_mystry's topic in PV*SOL
Hi d_mystry, usually one would choose a battery system that was created using the hybrid inverter in question. For the Deye SUN-12K the only battery systems were created by GS HUB GmbH: If you need another combination, you could copy that battery system and edit it to your likings (e.g. choose another battery and so on). Kind regards, Martin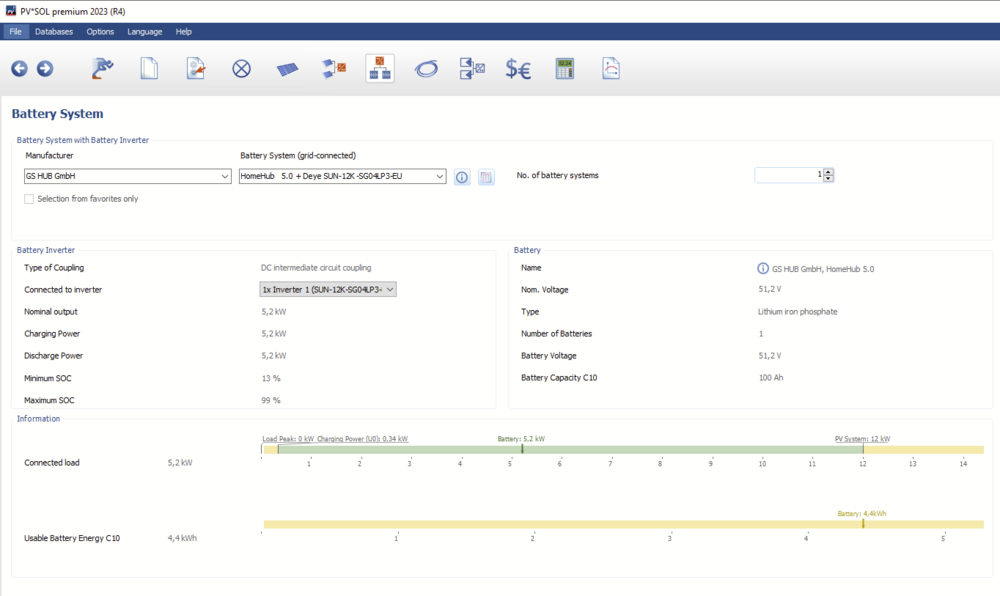
-
Hallo M.Brade, das wirkt auf den ersten Blick so, als käme die 3D Umgebung von PV*SOL mit dem Dezimaltrennzeichen durcheinander. Am besten mal PV*SOL schließen und nachschauen, welches Dezimaltrennzeichen in den Windows Einstellungen steht und ggfs. anpassen. Beste Grüße, Martin
- 1 reply
-
- 1
-

-
Neue Hybridwechselrichter GoodWe (GM15/20/25/29.9K-ET)
developer_mh replied to Die Solarmacher's topic in PV*SOL
Hi Tjarko, danke dir fürs Melden, ich habe es weitergegeben. Viele Grüße, Martin -
Hi reebal, nein, das ist derzeit leider nicht möglich. Wir haben das schon einige Zeit auf der Liste, aber zur Zeit kann ich leider keinen Ausblick geben, wann wir das Feature implementieren werden. Beste Grüße, Martin
-
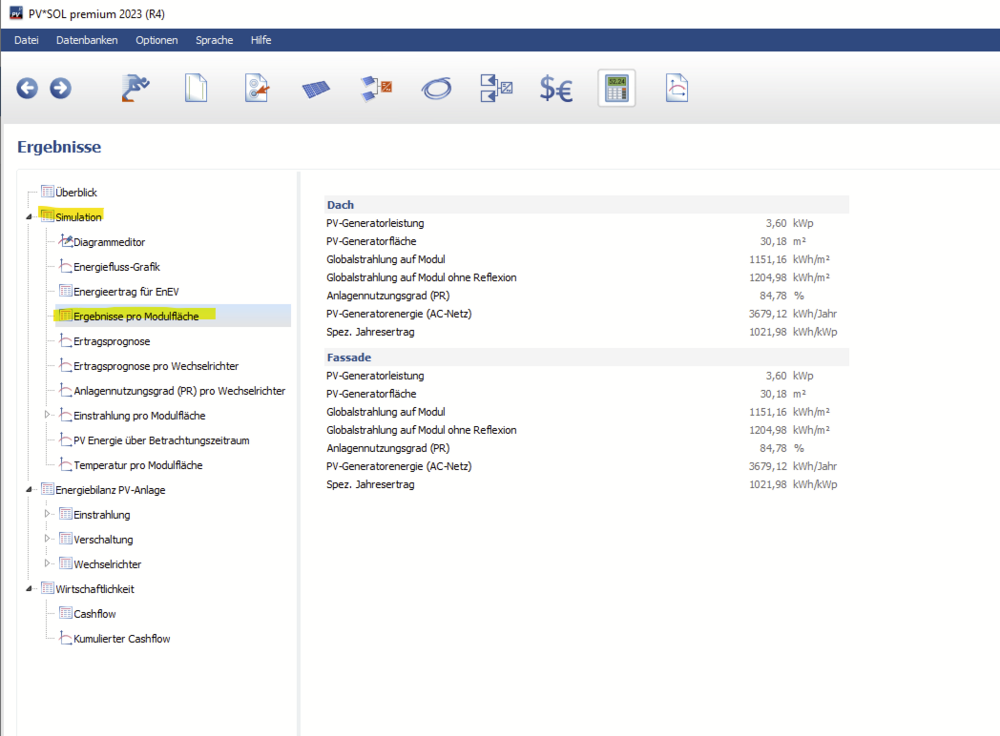
Hi Oliver74, dafür gibt es folgende Übersicht bei den Ergebnissen: Beste Grüße, Martin
- 1 reply
-
- 1
-
-
Hi Sara, which version of PV*SOL premium are you using? Could you send me your project file, please? Here in the forum as private message. Thanks and best regards, Martin
-
Hallo T.Meier, das lässt sich am Besten am konkreten Projekt erklären. Könntest du es mir hier im Forum schicken bitte, als private Nachricht. Danke und viele Grüße, Martin
-
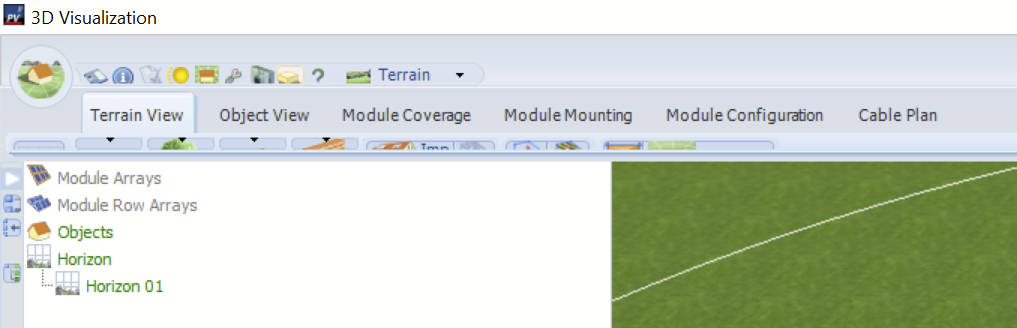
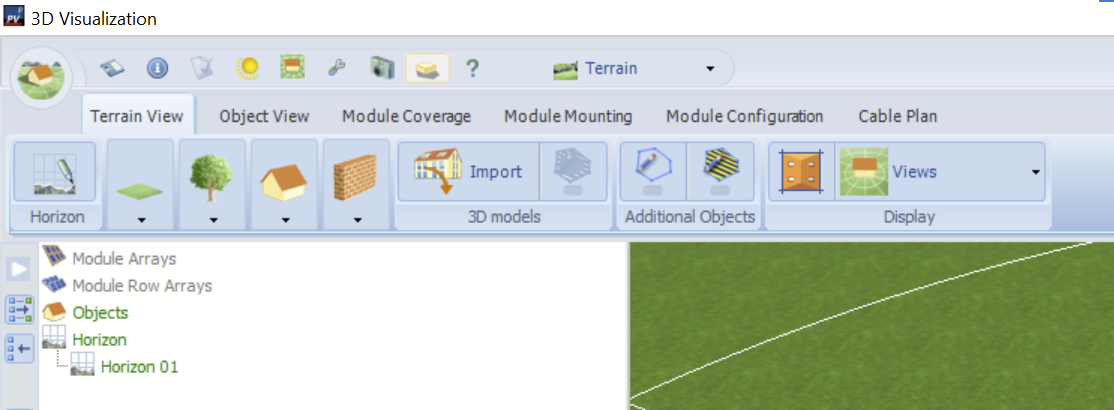
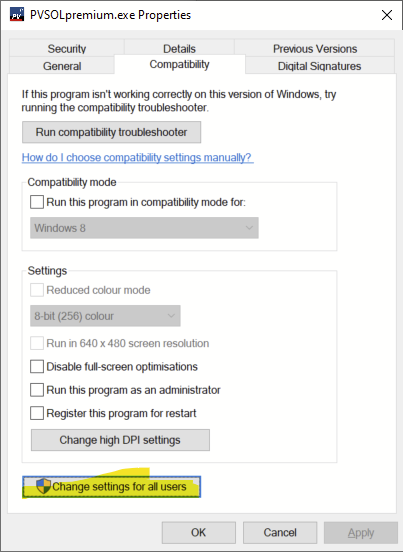
Liebe Anwender, in den letzten Jahren hatten wir immer wieder Anwender, die über Probleme mit der Darstellung der Menüleiste in der 3D-Umgebung von PV*SOL berichteten. In diesem Beitrag möchten wir Ihnen eine klare Anleitung geben, wie Sie dieses Problem entschärfen können. Problem So sollte die Menüleiste der 3D-Visualisierung von PV*SOL aussehen: Aber manchmal sieht sie so aus (oder noch schlimmer) Lösung Schließen Sie alle Instanzen von PV*SOL premium Suchen Sie die PVSOLpremium.exe (normalerweise unter C:\Program Files (x86)\Valentin EnergieSoftware\PVSOL premium 2023\) Klicken Sie mit der rechten Maustaste auf die Exe und wählen Sie "Eigenschaften". Navigieren Sie zur Registerkarte "Kompatibilität" und klicken Sie auf die Schaltfläche "Hohe DPI-Einstellungen ändern". Deaktivieren Sie dieses Kontrollkästchen (kein Überschreiben): Klicken Sie auf OK, wählen Sie im vorherigen Fenster "Einstellungen für alle Benutzer ändern" (wenn Sie diese Option haben) Klicken Sie auf "Einstellungen für hohe DPI ändern" und deaktivieren Sie das Kontrollkästchen wieder (gleicher Dialog wie zuvor) Schließen Sie alle Dialoge mit "OK". Starten Sie dann PV*SOL premium neu und öffnen Sie die 3D-Visualisierung - sie sollte so aussehen wie sie soll Wir haben dies auf mehreren Rechnern getestet, Win10 und Win11. Bitte halten Sie sich genau an die Anweisungen, um das richtige Aussehen zu erhalten. Nachtrag Wenn Sie jetzt die 3D-Visualisierung von PV*SOL öffnen, sehen Sie manchmal eine zu große Buttonleiste. Dies ist auf einen frühere Work-Around zurückzuführen, der nicht mehr notwendig ist. Bitte befolgen Sie die folgenden Anweisungen, um dies wieder in den Normalzustand zu bringen (stellen Sie sicher, dass Sie zuvor die obigen Anweisungen befolgt haben!) Schließen Sie alle Instanzen von PV*SOL premium Suchen Sie die Datei PVSOL.ini (normalerweise hier "C:\Users\USERNAME\Dokumente\Valentin EnergieSoftware\PVSOL premium 2023\PVSOL.ini") Öffnen Sie die Datei in einem Texteditor, z. B. Notepadd++ Suchen Sie die Zeile mit dem Text "<MainPagerWider>-1</MainPagerWider>" (eher am Ende der Datei) Ändern Sie die -1 in 0 Speichern Sie die Datei Starten Sie dann PV*SOL premium neu und öffnen Sie die 3D-Visualisierung - sie sollte so aussehen, wie sie soll Wir hoffen sehr, dass dies für alle von Ihnen hilfreich ist. Wenn es nicht hilft, wären wir sehr an weiteren Details zu Ihrem System interessiert. Postet einfach unten, ob die Anleitung geholfen hat oder nicht. Falls es nicht geholfen hat, würde ich eine Liste schreiben, was wir brauchen, um das Problem genauer zu analysieren. Beste Grüße, Martin


-
Hi Pierre, hi Simon, please refer to this post in order to solve the button bar problems: Kind regards, Martin