developer_mh
-
Posts
1,860 -
Joined
-
Last visited
-
Days Won
173
Everything posted by developer_mh
-
Hi Martinovec, in the 3D environment you can right click objects and select "Edit". Then you can enter the dimensions. Hope that helps. If you were referring to something else, please elaborate (perhaps with a screenshot). Thanks and kind regards, Martin
-
Hi Sk9, can you tell us which interverter models you tried? Kind regards, Martin
-
Hi George, thanks a lot for the project files. The calculation of the shading losses is a complex algorithm that can lead to small differences in the results depending on how the PV modules are connected. Especially the calculation of the shading losses in module independent and module specific losses can vary a little. Please also see this thread: Also, regarding the mismatch losses in the SolarEdge project, there is a 1 x 2 power optimizer layout in your configuration which is more susceptible to mismatch losses than the 1 x 1 layout. Hope that helps, best regards, Martin
-
Hi Gejege, interesting question, thanks for that. It is one advantage of a simulation software like PV*SOL that you can compare the different options directly. And yes, it might be astonishing at first sight that a PV system equipped with SolarEdge power optimizers isn't always the best option in terms of PV yield, but it is true. It always depends on the exact configuration and the shading situation. In order to go into detail a bit more it would be helpful to get the project files. You can send them to me as private message here in the forum. Thanks a lot, kind regards, Martin
-
Hallo Bernd75, die Einspeiseabregelung ist eigentlich genau der richtige Ansatz. Verwunderlich ist, dass die Einstellung nicht in der Simulation und in den Wirtschaftlichkeitsergebnissen nicht berücksichtigt wird. Vermutlich wäre es das einfachste, wenn du dein Projekt hier zur Verfügung stellen könntest. Gerne an mich als private Nachricht hier im Forum. Danke und Grüße, Martin
-
Hi Amir, thank you for the question. In fact there have been quite some users asking for this feature, so we have it already on our list. Yes, we do understand that perspective from single users. It is just that the opinion which is the most important feature changes massively from user to user, and we really have a lot of users. This results really in _a lot_ of feature requests. We are very happy about that because it shows that users really use our software and think about how it can be made even better. We just need to prioritize all these feature requests and make as many of them a reality as possible. Kind regards, Martin
-
Hallo enno, da wir in der Zwischenzeit ja sagen können und dürfen, dass wir an einer Neufassung der 3D Umgebung arbeiten, bitte ich um Verständnis, dass wir solcherlei Dinge in der alten Version der 3D Umgebung nicht mehr umsetzen können. Auch wenn die Dinge nach außen vielleicht manchmal wie kosmetische Feinheiten wirken, so sind sie unter der Haube mitunter so schwer zu beheben. Uns ist aber auf jeden Fall bewusst, dass das für den Nutzer ärgerlich ist, und wir versuchen das in der neuen Version so komfortabel wie möglich zu machen. Beste Grüße, Martin
-
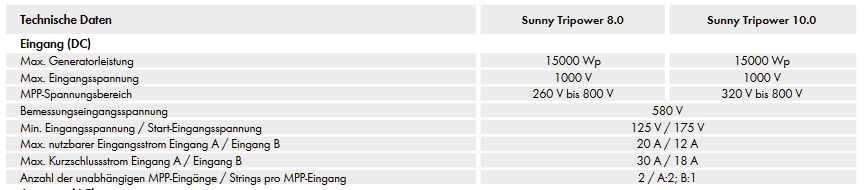
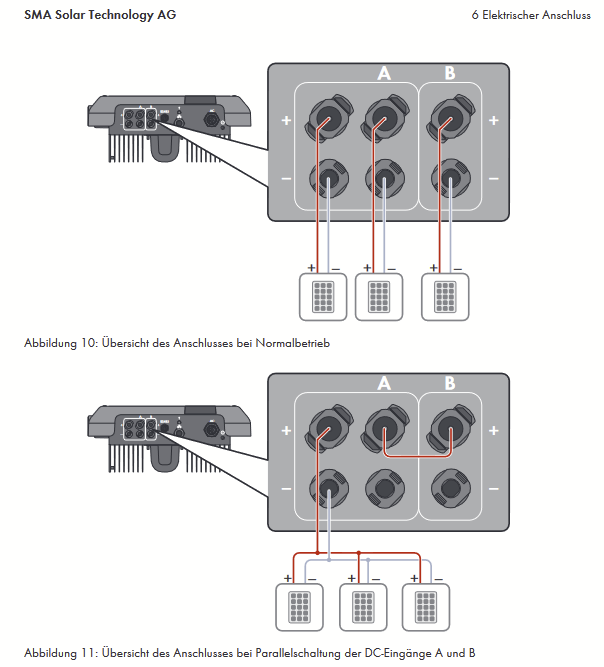
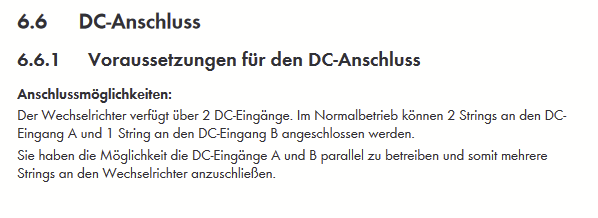
Hallo PV-Planer, ob da das gleiche herauskommt, hängt ein bisschen davon ab, ob der Wechselrichter identische MPP-Tracker bzw DC-Eingänge hat. Und natürlich, wie unterschiedlich die Schatten auf den jeweiligen Strings sind. Bei einigen Wechselrichtern sind die MPP-Tracker nicht identisch, siehe z.B. hier die SMA Tripower Geräte 8 und 10: Wenn man die beiden MPP-Tracker zusammenschließt, kann man unter Umständen mehrere Strings anschließen. Hier ein Auszug aus der Anleitung: Ich hoffe, das hilft weiter. Beste Grüße, Martin
-
Hallo Issam, nein, die Nummer kann man leider (noch) nicht ändern. Wir arbeiten aber daran, dass das in Zukunft möglich ist. Beste Grüße, Martin
-

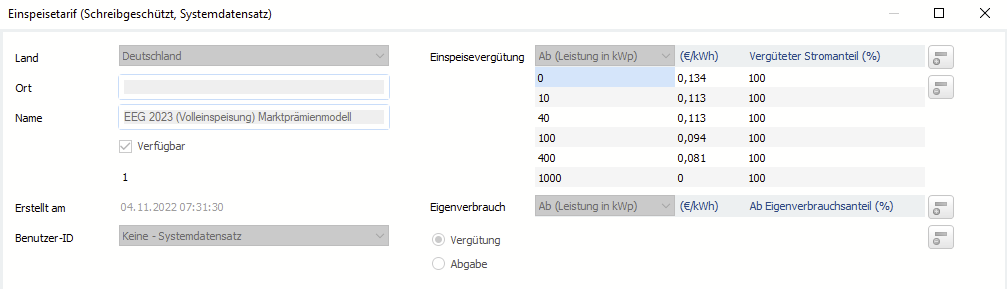
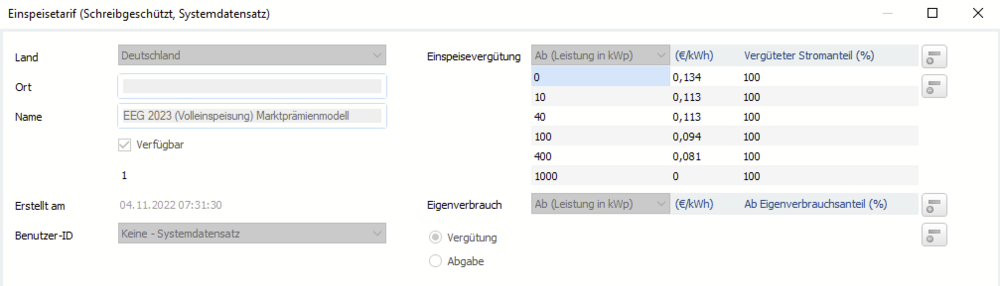
Wirtschaftlichkeitsberechnung Direktvermarktung Berechnungsgrundlagen
developer_mh replied to Fe1ix's topic in PV*SOL
Hallo Felix, genau, die Angaben in den in PV*SOL hinterlegten Tarifen nach dem Marktprämienmodell sind die sogenannten "anzulegenden Werte" Teileinspeisung: Und entsprechend 4,8 bis 3,2 ct/kWh mehr für Volleinspeisung: Beste Grüße und viel Erfolg bei der Projektarbeit, Martin
-
Wärmepumpentarif berücksichtigen, ohne thermisches System zu simulieren?
developer_mh replied to MrBlonde81's topic in PV*SOL
Hallo Max, nein, diesbezüglich gibt es leider keine Neuigkeiten. Aber ja, es steht nach wie vor relativ weit oben auf unserer Liste. Beste Grüße, Martin -
Hallo Arun, hallo Patrick, ja, das ist uns bewusst, und es steht relativ weit oben auf unserer Liste. Ich kann Stand jetzt aber leider noch nicht sagen, wann es kommen wird, Beste Grüße, Martin
-
Hi CarlSEL, we can't recommend other 3D software, but other users have reported to have used SketchUp, Blender and the like. If you want to import a 3D model into PV*SOL, we recommend using the obj format. Hope that helps, kind regards, Martin
-
Hi dht.freelancedesign, no, I am afraid, there are no news regarding this feature. Kind regards, Martin
-
Dear OAM, sorry for the late reply, your question must have slipped through. In fact, there are a lot of differences between PV*SOL and PVsyst, a lot more than you mentioned. The most important probably being the climate data used and the models to calculate the irradiance on the tilted plane, especially if you have a 3D environment with shadows. Also the time step causes huge differences - in PV*SOL you can simulate with 1min as well as 1h resolution. In 1min resolution you can also simulate effects like irradiance enhancements and the like. To your questions: LID: The light induced degradation goes into the module degradation, which you can enter for each module area separately. Module Quality Loss: If you refer to a degradation of the overall module performance over time here, you would enter this in the module degradation as well Thermal Loss Factor: This is a parameter of the PV module that you use. You can either just use a PV module from the database, or you can enter your own. There are three temperature coefficients: for the short circuit current in mA/K (or %/K), the open circuit voltage in mV/K (or %/K) and the MPP power in %/K. Module mismatch losses/string mismatch losses: There is a overall module mismatch loss factor that you can enter in the project options, usually set to 2%. This will cope for the losses to expect from module sorting (i.e. the fact that modules usually don't have the exact power output that is written on the datasheet) The real losses in the modules and strings that you have due to shading are simulated with the help of a very detailed algorithm. For each time step we determine where the shadows are, how many substrings of the module are shaded, calculate the resulting IV characteristics and finally overlay them to string IV curves. From these (and the chosen working point) the losses are calculated IAM loss factor: This is also a factor that is entered in the module data. If you have further questions, please feel free to ask. Kind regards, Martin
-
Hallo Christoph, in dem Fall sieht es so aus, als wäre es unmöglich, dass Direktstrahlung die Modulrückseite erreicht, aufgrund der Berge. Das müsste dann durch eine entsprechende Horizont-Linie dargestellt werden. Was wir in PV*SOL nicht berücksichtigen können, ist die richtungsabhängige Bodenreflexion, und auch nicht die Bodenreflexion an nicht-ebenem Gelände. Ich fürchte ehrlich gesagt, dass es nur vielen Tricks möglich sein wird, die Messergebnisse aus der Studie für genau diesen Standort in PV*SOL nachzubilden. Nein, das ist nicht möglich. Was das angeht, unterscheiden sich die beiden Modelle eigentlich nicht. Es wird in beiden Fällen die Strahlung auf die Rückseite gerechnet, nur mit unterschiedlichen Ansätzen. Aber ja, wenn man so will, rechnen wir den Ansatz für senkrechte Module so, als wäre auf der Rückseite ein zweites Modul, ja. Viele Grüße, Martin
-
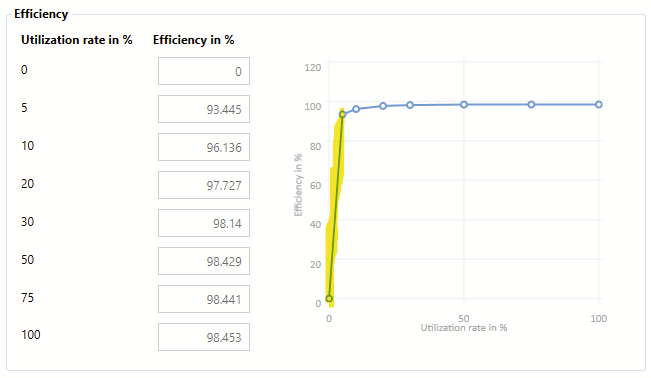
Hi Morteza, thanks for the project and your patience It is like I suspected. The load profile has very low values in comparison to the nominal power of the PV inverter, in the range of under 5% utlisation. The points you marked with a blue X refer to load values of 100 to 300 W, with the nominal power of the Huawei SUN2000-8KTL-M1(380Vac) of 8 kW, it gives us utilisation ratios of 0.1/8 = 1.25% to 0.3/8 = 3.75%. This means, the PV inverter (to which the battery system is connected on the DC intermediate circuit) operates in a very suboptimal range in terms of efficiency: What happens is that the load profile needs e.g. 100W from the battery system at night, and 100W are discharged from the batteries. But the PV inverter effiency is so low that a great part is lost on the way from the battery through the PV inverter to the loads on the AC side. All that is lost needs to be compensated for by the grid. This is why there is often energy from grid in the simulation (and also in reality, depending on the specific setup and the location of the load sensors). Since we have a lot of questions in this regard, in the next major version we will modify the logic so that we take into account the effiency of the PV inverter beforehand, i.e. if the load needs 100 W, we will discharge a lot more from the battery, say 400 W, so that 100 W are still reaching the load in the end. Hope that helps, kind regards, Martin
-
Hallo Christoph, wenn das Modul in der Wirklichkeit um 90° aufgeständert ist, wäre die Frage, wie die Umgebung hinter dem Modul aussieht. Steht das Modul vor einer Wand oder so wie im Projekt auf freier, horizontaler Fläche? Wenn es so wie im Projekt auf freier Fläche steht, erreicht natürlich ein nicht zu vernachlässigender Anteil der Diffus- und auch die Direktstrahlung die Modul-Rückseite. Hier ein CarpetPlot aus dem Projekt: Der plötzliche Rückgang der Strahlung auf die Rückseite hängt mit der Albedo zusammen, die im Projekt für den Mai noch mit 55% angegeben wurde und dann im Juni mit nur 20%. Für diesen Fall würde ich also sagen, dass die Werte durchaus plausibel sind. Der "unschöne" Sprung in deiner Grafik oben erklärt sich, wie Frederik schon gesagt hat, durch die unterschiedlichen Modelle, die je nach Neigungswinkel der Anlage verwendet werden. Viele Grüße, Martin

-
Hi Morteza, sorry for the late answer. And I am afraid that I didn't have a chance to download the project file so far. Could you please upload it again. I am very sorry for the inconvenience caused. Kind regards, Martin
-
Hi Richie, thank you for your question. Ads vs simulation vs reality - in the field of bifacial PV modules there is a lot of diverging information. I'd recommend to have a look at the results of the Bifacial PV Project from the Sandia Lab, USA. They have published some interesting insights on the topic. For example, here is a short study of the bifacial gain, where they report a bifacial gain of around 10%: https://pvpmc.sandia.gov/pv-research/bifacial-pv-project/outdoor-bifacial-pv-performance-data/field-example-of-bifacial-gain-at-sandia/ Or here, the proceedings of the 2018 conference on Bifacial Modules might be interesting: https://www.bifipv-workshop.com/2018denverproceedings This one here is on bifacial performance, check page 8, where they report around 10% as well. http://npv-workshop.com/fileadmin/images/bifi/denver/presentations/5__Shan-_comparison_between_mono-_and_bifacial_performance_bifiPV2018.pdf As you can see, the bifacial gain is dependent on a lot of parameters. In PV*SOL, we account for some of them, more on that here: https://help.valentin-software.com/pvsol/2023/en/calculation/pv-modules/bifacial-modules/ From what I saw so far in terms of independent measurements, I'd consider the 10% much more likely than the 30%. Kind regards, Martin
-
Hallo Max, ja, das kann schon sein, das unterscheidet sich von Modul zu Modul. Und ja, die Startspannung muss überschritten sein, damit der Wechselrichter anläuft. Danach kann die Spannung auch wieder absinken, da oftmals der untere Rand des MPP-Bereichs tiefer liegt als die Startspannung. Beste Grüße, Martin
-
Hi glekaj, I was referring to the PV modules, which company and model are they? I need to know so that I can reproduce your situation. Thanks and kind regards, Martin
-
best model for diffuse irradiance and irradiance model for inclined plane
developer_mh replied to anees's topic in PV*SOL
Hi anees, there is no simple answer to this question. Based on our studies we recommend the usage of the "Hofmann" model for diffuse irradiance*, especially when simulating in one-minute resolution. As model for the inclined plane we recommend the "Hay & Davies" model. You can find out more here: https://help.valentin-software.com/pvsol/en/calculation/irradiation/diffuse-irradiation/ https://help.valentin-software.com/pvsol/en/calculation/irradiation/irradiation-onto-inclined-plane/ If you really want to dive deep into the models, I'd recommend our paper on the influence of the various models on the energy yield: https://www.mdpi.com/1996-1073/10/10/1495 * disclaimer: This model was developed by us as part of my PhD thesis, so our opinion might be biased But we tested and validated it a lot, see the paper here: https://www.mdpi.com/1996-1073/10/2/248 Hope that helps, kind regards, Martin- 1 reply
-
- 1
-

-
Hi Norwegian solar, what kind of error message do you get? Could you provide a screenshot, please? Or even better, you can send your project as a private message here in the forum so that we can have a look. Kind regards, Martin
-
Hi glekaj, could you tell me which modules you are using? I could then try to reproduce the issue, thank you. Kind regards, Martin