developer_mh
-
Posts
1,859 -
Joined
-
Last visited
-
Days Won
173
Everything posted by developer_mh
-
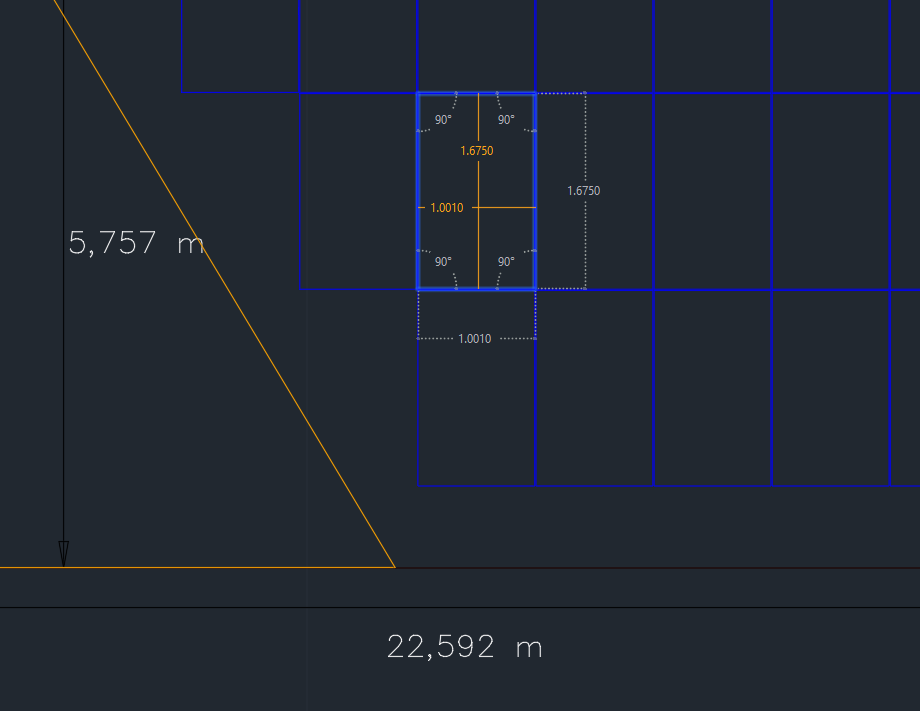
Hallo Solar_ ich habe das eben (nochmal) geprüft, bei mir kommen die Maße korrekt an. Plan aus Beispielprojekt 3D Side Wing: Maße in der dxf (Ausschnitt): Könntest du uns mal das Projekt und die dxf zukommen lassen, bitte? Gerne hier im Forum als private Nachricht, danke. Beste Grüße, Martin
-

Volleinspeisung & Überschusseinspeisung zusammen planen
developer_mh replied to Tempest's topic in PV*SOL
Hallo Norman, wenn man keine Verbraucher hat, kann man nur Volleinspeisung wählen. Mit Verbrauchern kann man wählen zwischen Überschusseinspeisung und Net Metering. Letzteres ist für Deutschland allerdings nicht zutreffend. Volleinspeisung in Kombination mit Überschusseinspeisung in einem Projekt ist derzeit nicht möglich. Die beiden Anlagenteile muss man also in zwei Projekte auftrennen. Beste Grüße, Martin -
Hallo N.Pauly, ja, diese Anlagenart gibt es derzeit nicht in PV*SOL. Dieses Feature steht sehr weit oben bei uns auf der Liste, aber ich kann leider derzeit nichts dazu sagen, wann es kommen wird. Man kann aber zum Beispiel eine Anlage mit Batterie und E-Fahrzeug machen, und dann den elektrischen Bedarf der Wärmepumpe als Lastprofil anlegen. Das ist zwar nicht das gleiche, vor allem weil die Wärmepumpe dann als "normaler" Verbrauch behandelt wird und damit quasi nicht steuerbar ist, aber man bekommt schon mal ein grobes Ergebnis. Beste Grüße, Martin
-
Hallo Tamara Hüser, PV*SOL ist prinzipiell (so gut wie) unbegrenzt in der Leistung, die berechnet werden kann. In der 3D Planung allerdings liegt das Limit für aufgeständerte Module bei 7500, für dachparallele bei 10000. Möchte man 50 MW simulieren, bräuchte man grob 100 000 Module. Da würde ich empfehlen, das Projekt in kleinere Einheiten aufzuteilen. Freiflächenanlagen dieser Größenordnung mit all ihren spezifischen Anforderungen sind aber ehrlich gesagt auch nicht der Hauptanwendungsfall von PV*SOL. Modultische, die dem Terrain folgen, sind z.B. nur sehr schwierig umzusetzen. Beste Grüße, Martin
-
Hallo Simon, gute Frage, auf die ich leider auch keine konkrete Antwort weiß. Mir würden folgender Ansatz einfallen, der eher vergleichender Natur ist: Zuerst berechnet man die PV-Anlage, wie sie jetzt ist, also rückwirkend seit Installation, mit der damaligen Investition. Dann schaut man sich im Cashflow an, wo man da heute steht und schreibt sich diesen Wert raus. Dann legt man eine Kopie des Projektes an und trägt den aktuellen Wert des Cashflows als Investition ein. Den Betrachtungszeitraum muss man dann natürlich ebenfalls entsprechend anpassen. Dann rechnet man sich diese Variante durch. Im Vergleich dazu legt man eine weitere Kopie an und fügt den Speicher samt Investitionskosten hinzu. Dann kann man am Ende den Cashflow oder die Gesamtkapitalrendite der beiden Varianten vergleichen und hat damit eine Aussage über die Wirtschaftlichkeit. In diesem Fall ist ja in der Regel die Anlage schon abgeschrieben/amortisiert. Beste Grüße, Martin
-
Hallo Gerhard Strack, die Ergänzungen verstehe ich nicht ganz, für mich liest sich das wie eine Umformulierung des vorherigen Posts. Daher würde ich einfach mal auf diesen und meine Antwort dort verweisen: Wenn möglich, in Zukunft gerne einfach in den gleichen Thread schreiben, dann bleiben die Einträge thematisch beisammen. Danke! Beste Grüße, Martin
-
Hallo Lionel, das sieht schon korrekt aus so. Die angezeigten Ströme sind die Summeströme über die drei Phasen. Für die AC-Seite gilt grob: 30 kW Nennleistung geteilt durch 230 V Nennspannung je Phase = 130 A Nennstrom. Heißt also 43,5 A pro Phase. Beste Grüße, Martin
-
Berechnung für PV-Inselanlage im DC-Betrieb nicht möglich
developer_mh replied to Gerhard Strack's topic in PV*SOL
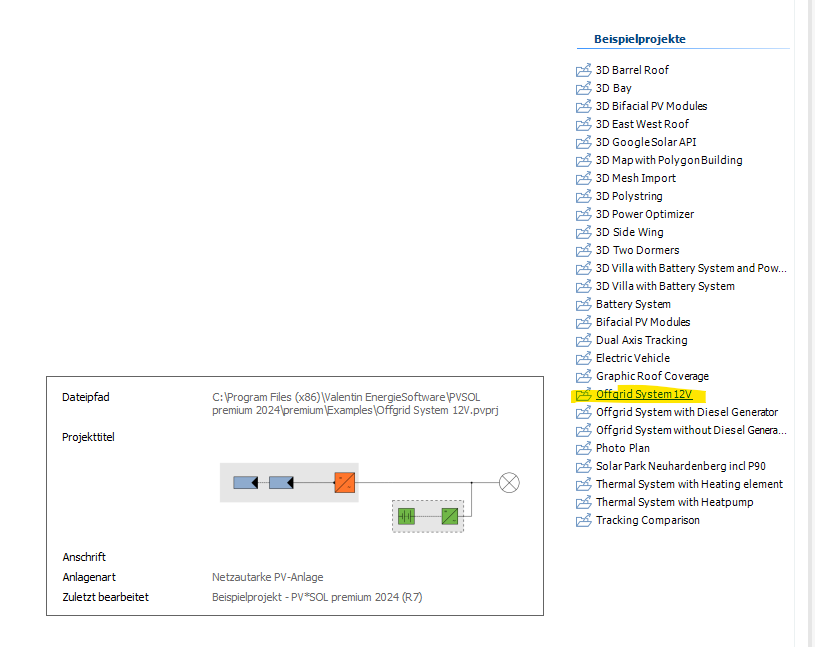
Hallo Gerhard Strack, das ist leider korrekt - netzautarke PV-Anlagen mit DC-Kopplung sind derzeit nicht möglich in PV*SOL. Wenn man darüber hinweg sieht, dass man geringfügige Fehler macht und hier und da etwas von "AC" steht, obwohl es eigentlich DC ist, kann aber aber zumindest grob in die richtige Richtung kommen, indem man Netzspannung auf 24V setzt. Wir haben auch ein Beispielprojekt, wo der Ansatz gezeigt wird: Dauerverbraucher gehen problemlos: Einfach das Lastprofil mit konstanter Last wählen und nach Wunsch auf den korrekten Jahreswert skalieren: Ich hoffe, das hilft weiter, beste Grüße, Martin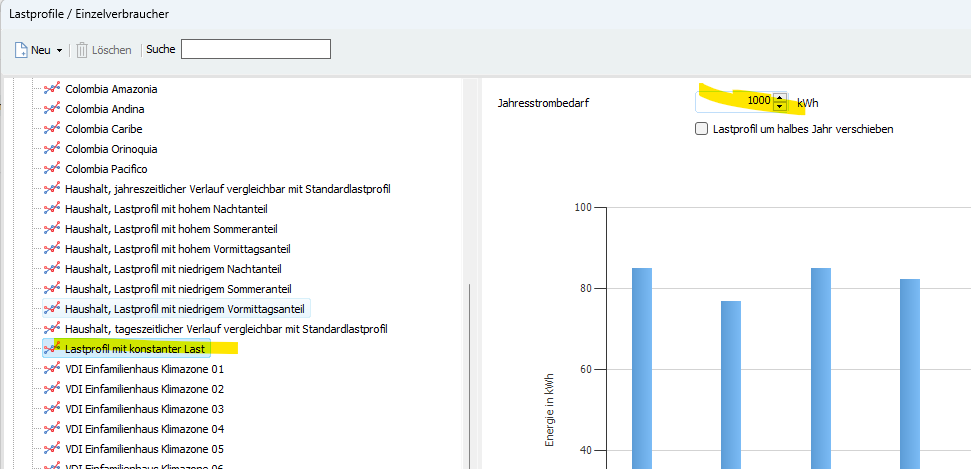
-
Simulation einer PV-Anlage auf einem Gründach
developer_mh replied to theblackman7800's topic in PV*SOL
Hallo Gabriel, die Modultemperatur als solche wird ja für jeden Zeitschritt simuliert. Was du aber anpassen kannst, ist die Einbausituation. Damit änderst du den DT-Faktor, der angibt, um wieviel Grad über Umgebungstemperatur sich das Modul bei einer Einstrahlung von 1000 W/m² erwärmt. Auf der Seite der PV-Module: Und hier mehr zur Berechnung: https://help.valentin-software.com/pvsol/de/berechnungsgrundlagen/pv-module/modultemperatur/ Beste Grüße, Martin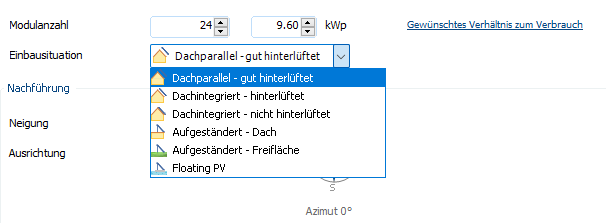
-
Hi CarlSEL, thanks for your question. I don't know if we are the best choice for answering this question - we might be a bit biased PPAs are contracts that regulate the supply of electricity between two parties, the producer and the consumer. A fixed quantity of electricity and a fixed price are agreed. In contrast to normal feed-in tariffs with own consumption, with PPAs it does not usually matter at what exact time the electricity is supplied. In this respect, the required values for the energy fed into the grid are also much easier to determine in simulation software such as PV*SOL. Both PV*SOL and other simulation programmes are able to do this, although I can of course only speak for PV*SOL here. Parameters relevant to bankability, such as P90 (or any other P value), can also be easily entered in PV*SOL. PV*SOL is considered absolutely "bankable" due to its widespread use and many years of existence (more than 25 years). Various sources of climate data are also available, which can be used to estimate the potential yield of the system even better. In addition to Meteonorm and PVGIS, these include Solcast and SolarAnywhere. In any case, good luck with compiling the report. If you need any further information, please let us know. Best regards, Martin
-
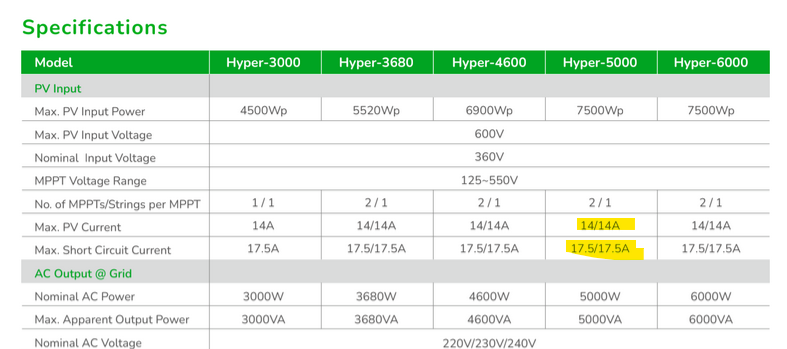
Hi Keith, you are right, the max input current at inverter level should be the sum of the max input current values per MPP tracker. In the datasheet of the Hybrid-5000 it is stated that the 14 A are the max PV current. In total or per tracker? We don't know. It would be best if you contact the manufacturer and ask. When we divide the 5000 W by 360 V, we get a "nominal current" at inverter level of 13.9 A. So I personally doubt that the max current at inverter level is 14 A. I guess it is 28 A, whereas it is 14 A at MPP tracker level. I will forward this to our database team as well so that they can have a look. Kind regards, Martin
-
Fehlermeldung beim Start "Die Datei.... kann nicht geladen werden"
developer_mh replied to Ralf's topic in PV*SOL
Hallo Bell Inchen, wir sind ja bereits in Kontakt über den technischen Support. Wenn wir eine Lösung gefunden haben, können wir das ja hier posten, damit andere eventuell Betroffene auch davon profitieren können. Viele Grüße, Martin -
Hallo Eisenmann Photovoltaik, danke für die Anfrage. Wann genau wir dieses Feature so anbieten können, ist derzeit nicht absehbar. Wir halten es aber ebenfalls für ein wichtiges Feature und haben es auch bereits auf unserer Liste. Beste Grüße, Martin
-
Simulation einer PV-Anlage auf einem Gründach
developer_mh replied to theblackman7800's topic in PV*SOL
Hallo Gabriel, was genau soll denn bei dem Gründach simuliert werden? So etwas wie Pflanzenwachstum oder Temperatur- und Feuchtigkeitsregulierung durch das Dach kann nicht simuliert werden. Aber die PV-Anlage auf dem Dach kann natürlich simuliert werden, keine Frage. Beste Grüße, Martin -
Fehlende Textur nach 3D-Modell import mit DroneDeploy
developer_mh replied to Krys's topic in PV*SOL
Hallo Krys, sorry für die späte Rückmeldung. Leider können wir ohne das konkrete 3D Modell keine zuverlässliche Angabe zu den Gründen machen. Und auch, wenn wir das Modell bekommen, ist leider nicht gesagt, dass wir die Ursache herausfinden. Die entstehenden 3D Modelle können allerlei unterschiedliche Eigenschaften aufweisen, die dann zu solchen Artefakten führen. Du kannst das Modell aber mal dem technischem Support schicken, manchmal können sie sehen, was los ist: https://valentin-software.com/support/technischer-support/ Beste Grüße, Martin -
Hallo diwiro, danke für das Teilen des Workarounds mit den anderen Usern, das hilft bestimmt weiter. Ja, das ist ganz richtig. Wir sind daher auch dabei, die 3D Umgebung von grund auf neu zu entwickeln. Hier haben sich so viele neue Feature-Wünsche und komplexe Bugs angesammelt, dass sie mit der jetzigen Codebase nicht mehr (in einem angemessenen Zeitraum) zu beheben sind. Angefangen beim fehlenden Undo, über die besagte Belegungsgrenze an virtuellen Dachstößen bis hin zu Performance- und Arbeitsspeicher-Problemen. In der Summe macht es so für uns und vor allem unsere Kunden viel mehr Sinn, die ganze 3D Umgebung auf einen modernen Stand zu heben. Das ist eine Jahrhundertbaustelle, wir arbeiten mit Hochdruck daran, aber trotzdem braucht es einfach seine Zeit. Obwohl die Neuentwicklung einen Großteil unserer Entwickler-Kapazität frisst, versuchen wir trotzdem, in der jetzigen 3D Umgebung Bugs zu fixen und hier und da sogar ein neues Feature zu implementieren. Größere Fixes oder Features, die einen kompletten Umbau des Codes erfordern würden, können aber natürlich nicht mehr erfolgen. Das tut uns natürlich leid zu hören. Wir tun jedenfalls unser Bestes, um unseren Kunden eine Software anzubieten, die sie möglichst gut bei der Arbeit unterstützt. Es ist ja prinzipiell bei der Software-Entwicklung so, zumindest bei Software, die sich mit einer aktuellen, sich ständig weiterentwickelnden Technologie wie der Solartechnik beschäftigt: Egal, in welche Richtung man schaut, es gibt zu jedem Teil-Bereich in der Software hunderte Kundenwünsche. Die Wunschlisten hier im Forum sind nur ein kleiner Teil davon. Da liegt es in der Natur der Sache, dass nicht jedes Feature, dass sich Kunde A wünscht, umgesetzt werden kann. Wir bitten daher um Verständnis und wünschen uns, dass Sie uns weiter als Kunde gewogen bleiben. Beste Grüße, Martin
-
setting up PV*Sol for distibution through Microsoft Intune.
developer_mh replied to Admincs's topic in PV*SOL
This is great, thanks a lot, Valintune! I am sure it will be helpful for a lot of other users. One important point though: Photoplan does not need to be installed separately, it is now part of the standard PV*SOL installation (since 2024 R1). Even if you install PhotoPlan from the sources that you mentioned, a current version of PV*SOL will not use it, but will use the Photoplan executables and dlls inside C:\Program Files (x86)\Valentin EnergieSoftware\PVSOL premium 2024\Bin\Photoplan1.2 -
Hi dekay, this is absolutely reasonable. The 4% that you see in the 3D environment is the frequency of direct shadows on the modules, not the reduction of energy yield per year. It serves more as an indicator whether or not a module receives shadow. The impact on the energy yield per year depends on many other factors, e.g.: How are the modules interconnected? When does the shadow occur? How high is the direct and diffuse component of the solar irradiance at that moment This can only be determined in the energy simulation, after which you see the results that you showed us here. On our help pages you will find some more detail about the calculation of shadows, the effect of shadows on PV modules and PV fields and much more: https://help.valentin-software.com/pvsol/en/calculation/irradiation/ https://help.valentin-software.com/pvsol/en/calculation/pv-modules/ https://help.valentin-software.com/pvsol/en/calculation/pv-field/ Hope that helps, kind regards, Martin
-
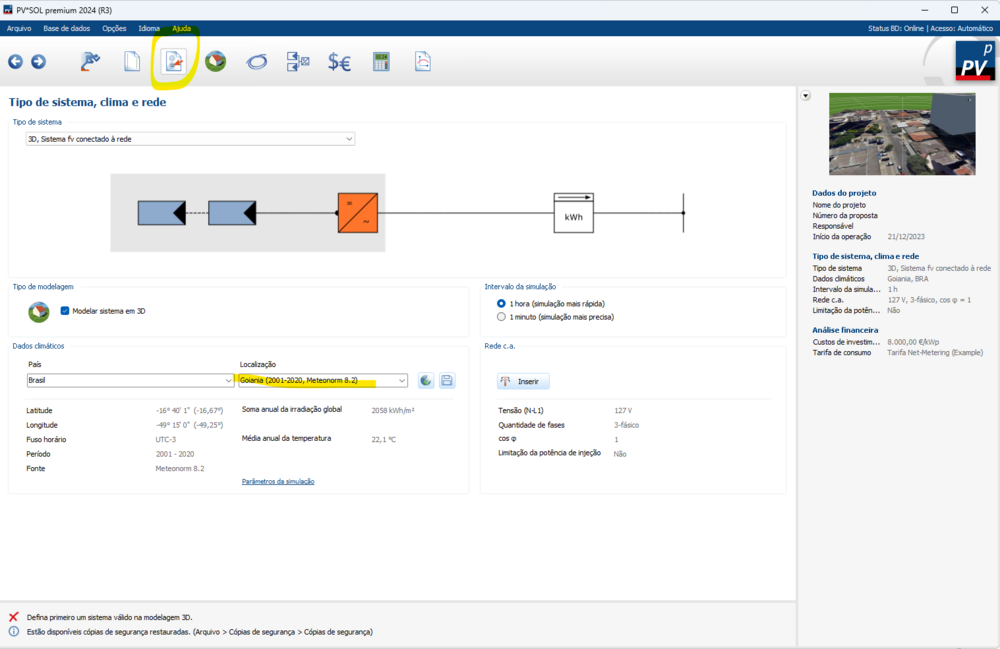
Dear José Carlos, I guess what you experience there is that you have selected the location on the maps in the 3D environment, but perhaps not as climate data? Please close the 3D environment (you can adopt all data, if you wish), go back to the main application, head to the page "Tipo de sistema, clima e rede", and select the correct location: Then, when you enter 3D, the shadows are displayed correctly. Kind regards, Martin
-
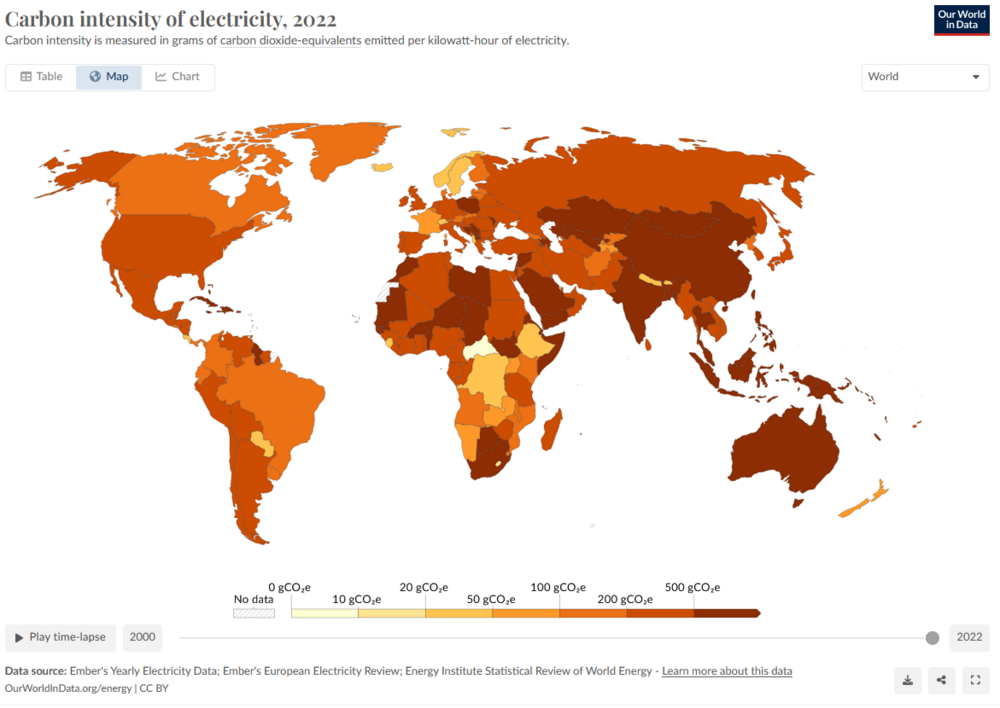
Dear all, I'd like to share an interesting website I found recently where you can look up the specific CO2 emissions per country on a map: https://ourworldindata.org/grapher/carbon-intensity-electricity This was really a very rough estimate, by just diving the CO2 emissions by the electricity consumption, 37.5 Mt / 133.2 TWh = 282 g/kWh. This calculus does take into account a whole bunch of factors and actually we should forget that I even did that calculation We should look it up on the above website instead. Kind regards, Martin
-
Hi Asgar Kappel Skau, when you have a normal PV system that is connected to the grid, and the house consumption also connected to the grid, you can just choose a from-grid tariff and a feed-in tariff. You don't have to modify the tariffs. The PV energy that is generated is first used by the consumption in the house. If there is more PV energy than consumption, the rest of the PV energy is fed into the grid and you get paid for that with the price per kWh that is defined in the feed-in tariff. If there is more consumption than PV energy, the rest of the consumption energy has to be covered by the grid, and you will have to pay for it according to the from-grid tariff. "The price of electricity sold to third party" is something else that doesn't matter here in your case. It is only applicable if you have no tariff selected or if the selected tariff is not valid anymore. See here for more details: Hope that helps, best regards, Martin
-
Hi Luís, thank you for the project file. The reason for the error is the PV module that was created by a user. It has a relative efficiency in low light of over 376%: In future releases it won't be possible to enter data that lead to a relative efficiency of over 120%. And a general suggestion to users creating their own PV module data is to use the standard low light performance check box. This ensures that nothing can go wrong. Hope that helps, best regards, Martin

-
oh, thank you for the hint! Somehow we do not get noticed when our inbox is full. Should work now again
-
yes, of course!
-
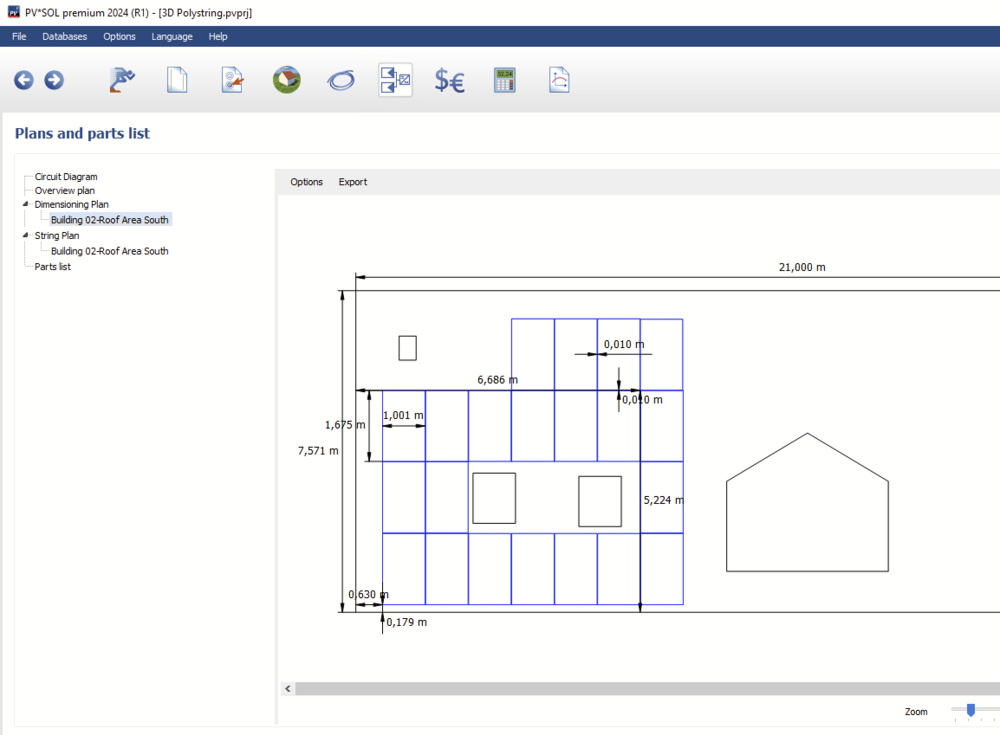
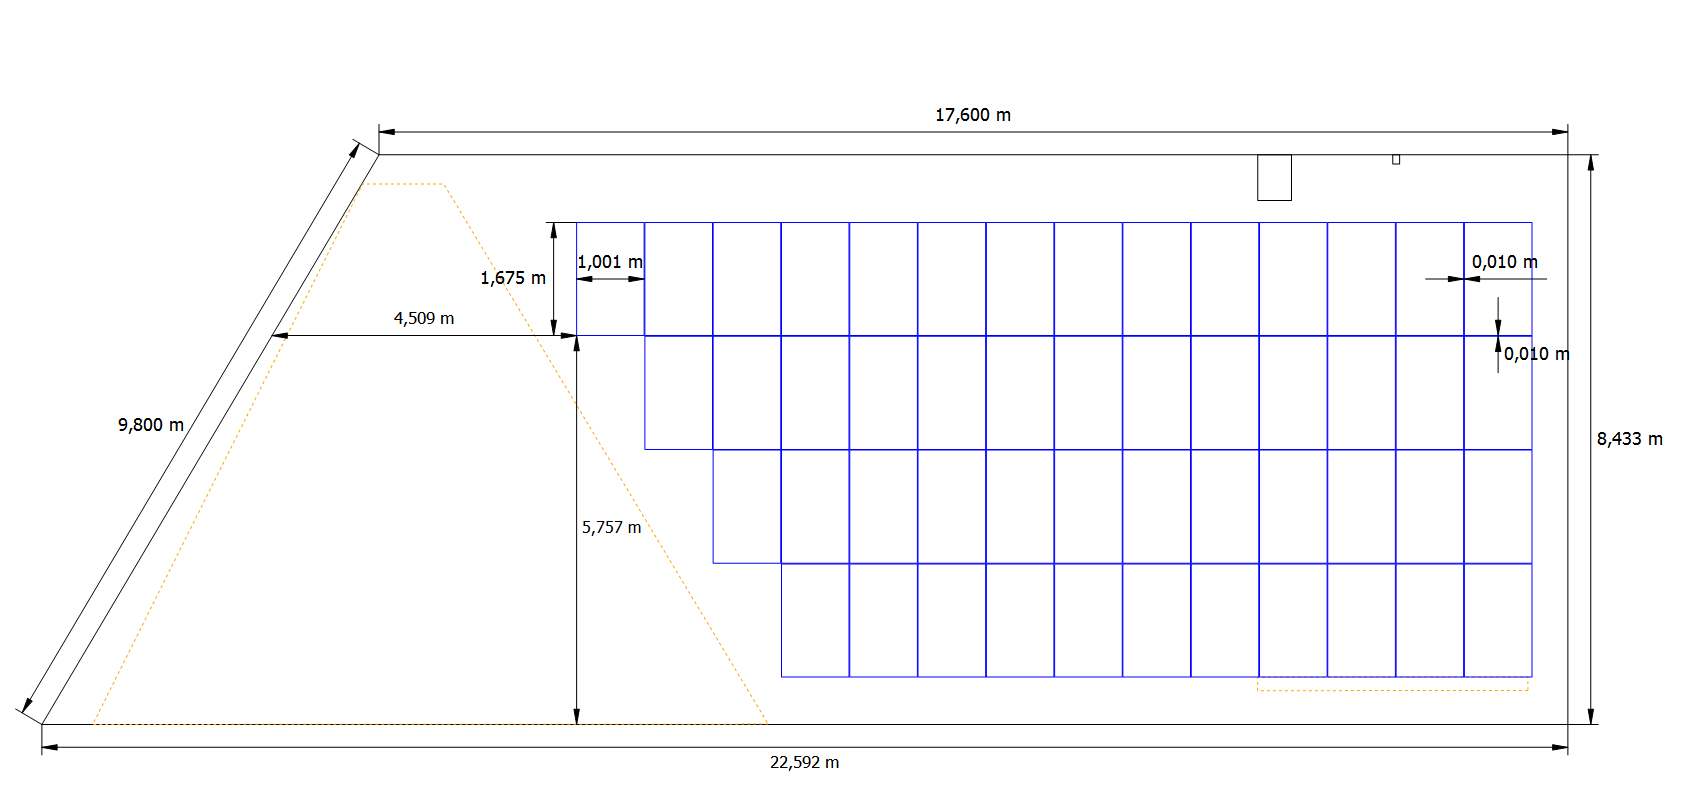
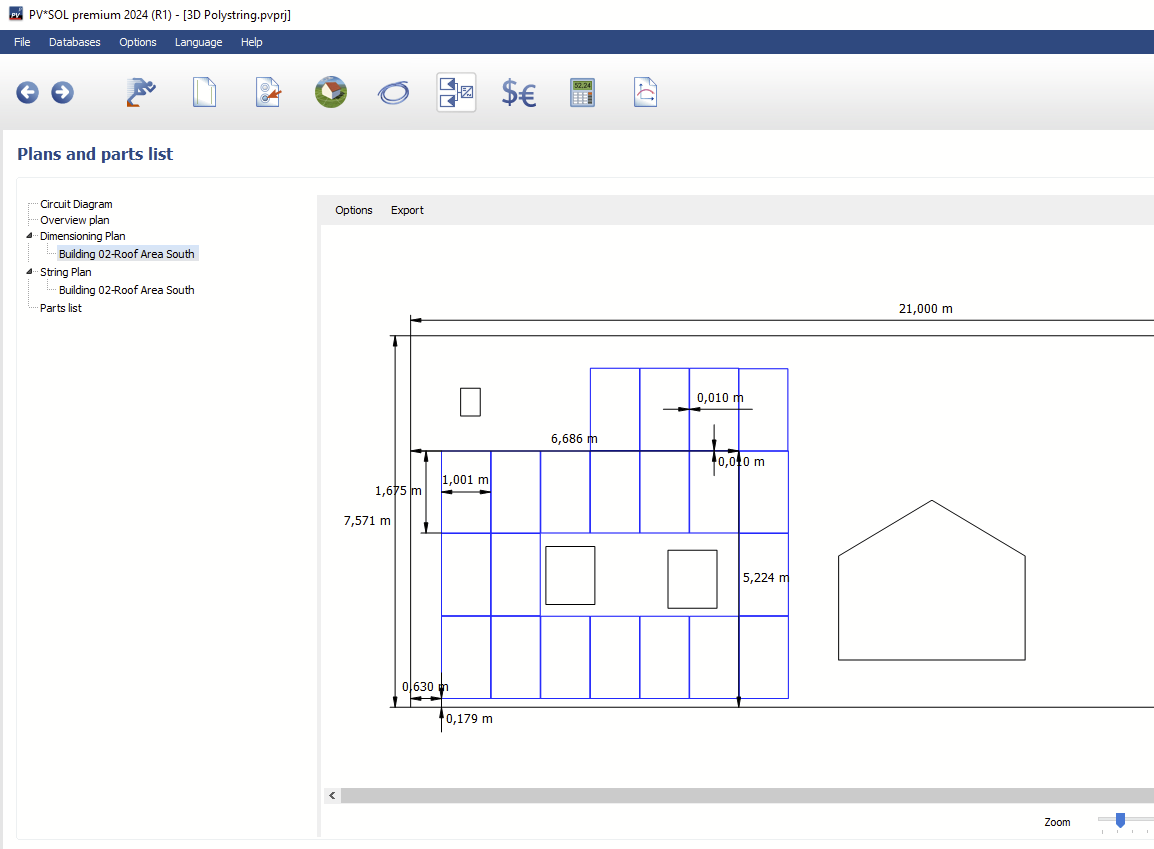
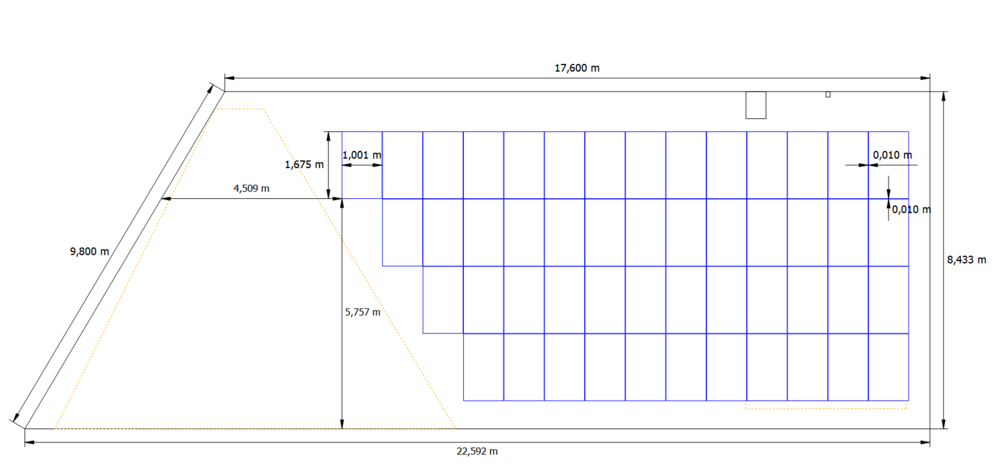
questions - assembly system, bifacial module, dimensions
developer_mh replied to Go green BG's topic in PV*SOL
Hi Go green BG, thank you for your questions and the screenshots. You choose to create a copy and then see all the details in the edit dialog. Then choose cancel. I will forward this request to our database team. If you create your own PV modules e.g. by copying existing ones and you don't know the low light parameters, just choose "standard" Yes, the module dimensions are displayed in the dimensioning plan, and are also listed in the PV module datasheet table Hope that helps, kind regards, Martin