hotline_oh
-
Posts
556 -
Joined
-
Last visited
-
Days Won
31
Everything posted by hotline_oh
-
Dear J. Esteban, Thank you for your inquiry. Unfortunately, there is no other way to display large module areas. We will forward your request to our development team.
-
Hallo F.Hiecke, vielen Dank für deine Nachricht. Wir werden den Hersteller Sigenergy kontaktieren und um Eintragung der fehlenden Produkte (Sigen Hybrid Wechselrichter TP2 mit 1-6 Batteriemodulen) in unsere Datenbank bitten.
-
 Dear Alexandre, Thank you for your inquiry. Unfortunately, it is not possible to define seasonal temperature settings. We have informed our development team about your requirement.
 -
Guten Tag, vielen Dank für Ihre Anfrage. Eine Legionellen-Schaltung kann ich T*SOL und in PV*SOL berücksichtigt werden, jedoch leider nicht in GeoT*SOL. Das Entwicklungsteam hat Ihren Wunsch aufgenommen. Wenn Sie sich die Testversion von T*SOL herunterladen, könnten Sie den Mehrverbrauch für den Legionellenschutz beispielsweise wie folgt abschätzen: 300 Liter, T_soll = 50 °C, für Legionellenschutz auf 60 °C aufheizen ohne Legionellenschutz: Kessel: 2742 kWh/a, Verluste 366 kWh/a mit Legionellenschutz 1x/Woche: Kessel: 2795 kWh/a, Verluste 375 kWh/a (+ 2 % Mehrverbrauch) mit Legionellenschutz 7x/Woche: Kessel: 3151 kWh/a, Verluste 442 kWh/a (+ 15 % Mehrverbrauch) Fazit: Bei deltaT = 10 K sind es etwa 2 % pro Tag extra
-
Guten Tag, vielen Dank für Ihre Nachricht. Bedauerlicherweise ist es nicht möglich, die Anlagenschemata anzupassen. Wir geben Ihre Wünsche, auch die Möglichkeit zum Abbilden eines Nachheizstabs in einem Speicher, an das Entwicklungsteam weiter.
-
Dear CarlSEL, Thank you for your inquiry. Unfortunately, the cable diagram is not available for roof-spanning wiring (as in your case), polystring wiring, or elevated systems. Instead, a string diagram is available, based on the sorting on the Module Configuration page.
-
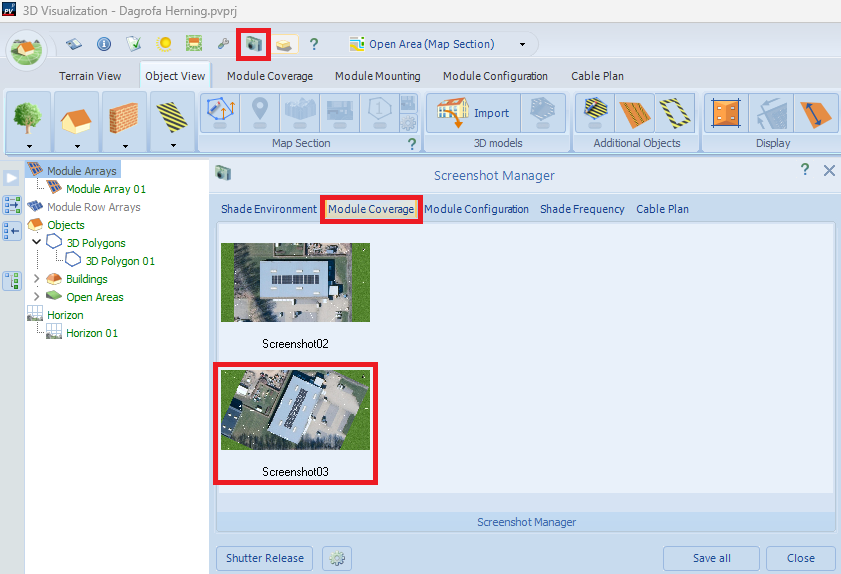
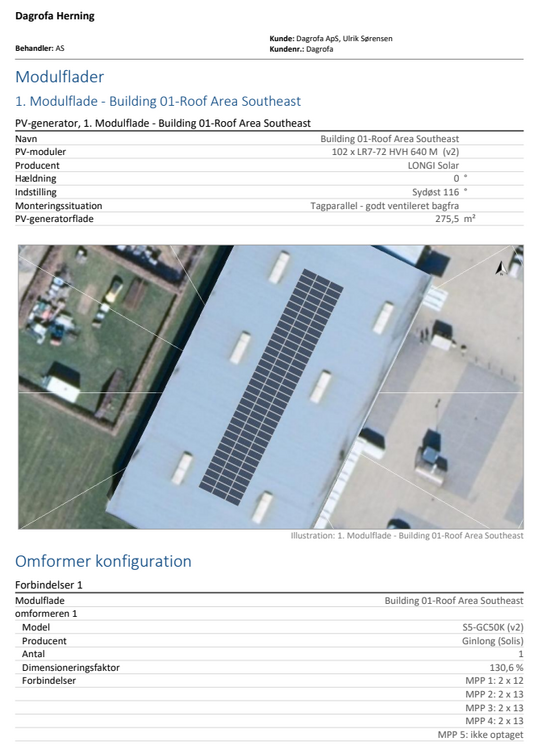
Dear Anders, Thank you for your inquiry. We took another screenshot in the screenshot manager: This one will be included in the project report: The project file we edited is attached. Dagrofa Herning - VAL.pvprj
-
Hallo Joceblaze, vielen Dank für deine Anfrage. Bitte sende uns die Projektdatei (*.pvprj) an hotline@valentin-software.com, dann sehen wir uns das mal an.
-
Hallo Solaris, vielen Dank für deine Anfrage. Bitte sende uns die beiden Projektdateien (*.pvprj) an hotline@valentin-software.com, dann sehen wir uns das mal an.
-
Hallo F.Hiecke, vielen Dank für deine Anfrage. Auf der Seite "Kabel" kannst du Schaltzeichen hinzufügen und diese auch individuell beschriften. Es gibt bisher kein Schaltzeichen für eine Notstrombox. Falls du eine Vorgabe vom Netzbetreiber hast, wie das Schaltzeichen aussehen soll, schick es uns gern an hotline@valentin-software.com, dann leiten wir das ans Entwicklungsteam weiter.
-
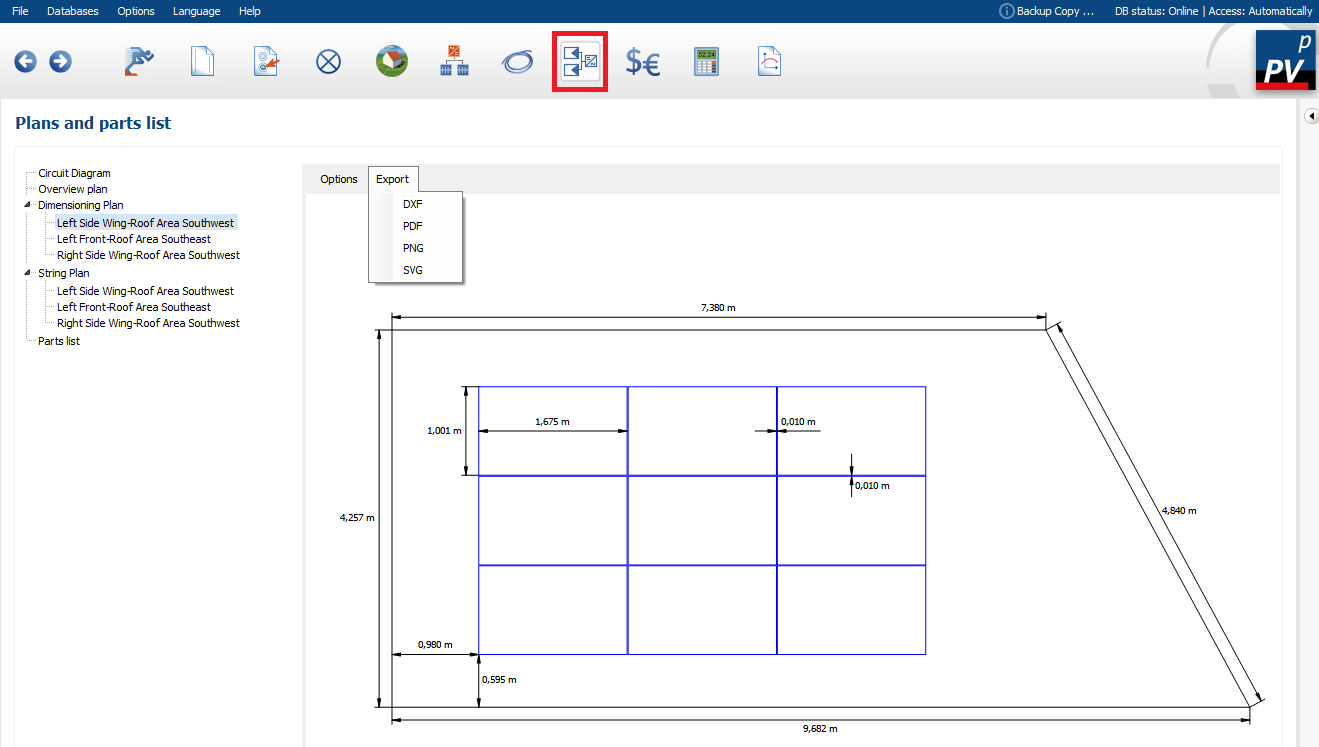
Dear xshreck, Thank you for your inquiry. This is a bug that will be fixed in the next software update. PV*SOL premium 2025 R4 is expected to be released on March 18, 2026. You can work around this by exiting the 3D environment and returning to the main program. Exporting works on the "Plans and parts lists" page:

-
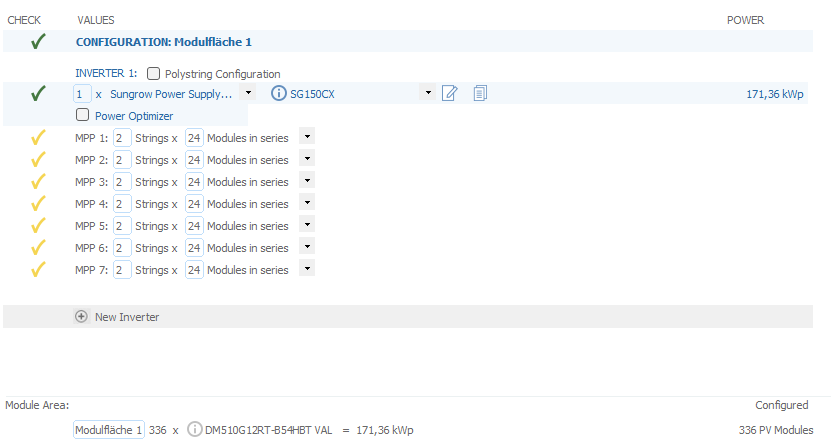
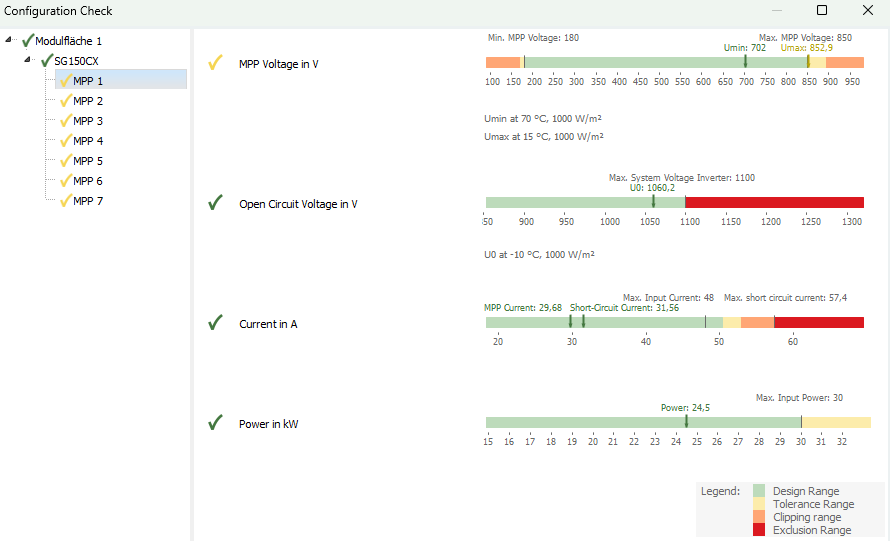
Dear CarlSEL, Thank you for your message. We confirm that 24 modules DM510G12RT-B54HBT may be connected in series: The maximum open-circuit voltage of the string at -10 degrees Celsius is 1060 V:
-
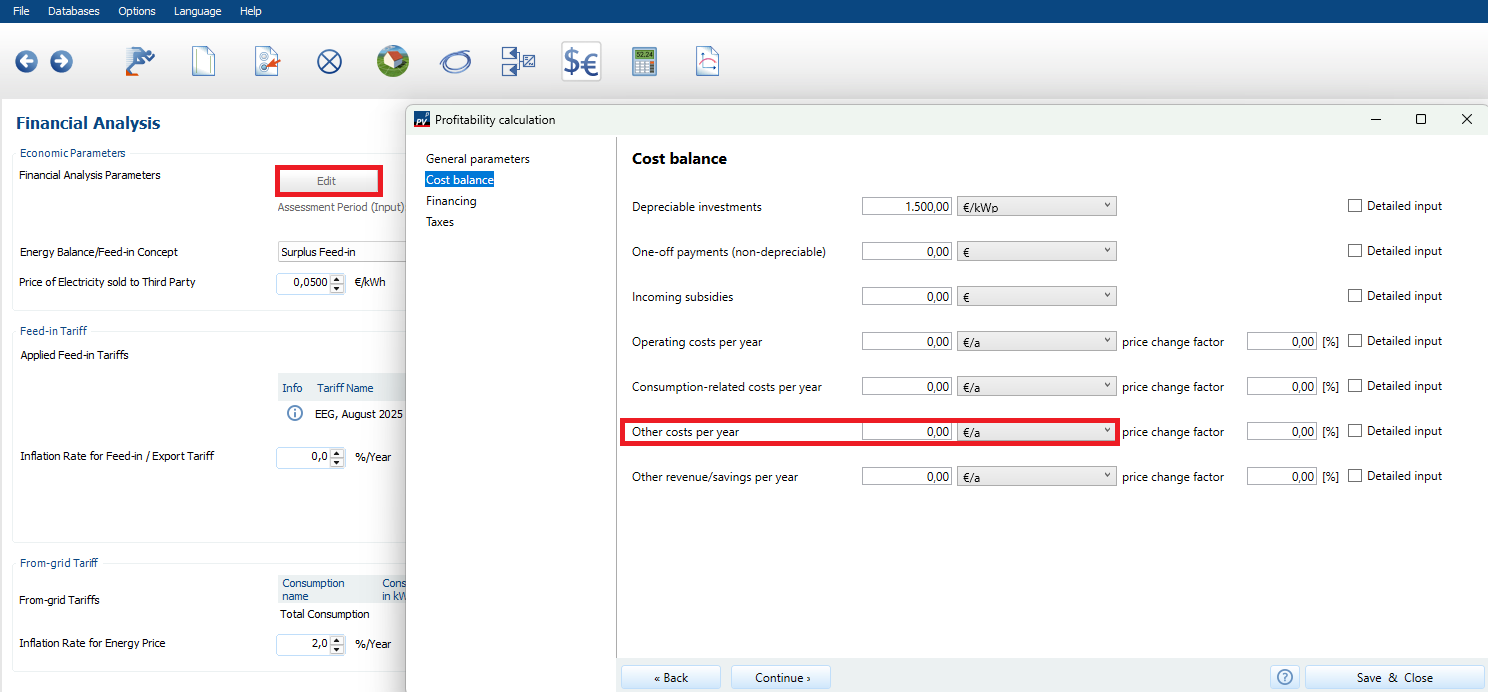
The tenant electricity model is unfortunately not selectable as a balancing/feed-in concept and must be entered/adjusted individually. Assuming that the demand profile represents the tenants' consumption, self-consumption corresponds to selling electricity to the tenants. This can be accounted for through savings by defining a from-grid tariff that corresponds to the selling price to the tenants. The electricity fed into the grid is compensated with a feed-in tariff or via direct marketing. Since the operator may also have to/be able to guarantee security of supply, the generated PV energy may not be sufficient to cover the tenants' demand. In this case, electricity must be purchased from the grid by the energy supplier. To account for this, you must multiply the amount of electricity purchased by the energy supplier's price per kWh and enter this value under "Other Costs" in the "Financial Analysis" under "Economic Parameters --> Cost Balance".

-
No, our PV software cannot calculate costs. Component prices and other costs are not included. You must determine the costs of your planned system yourself. The calculated system price is entered into the profitability analysis and thus forms the basis for the financial forecast. The forms in the "financial analysis" module are pre-populated with sample values and do not represent average or empirical values. You must adjust these to suit your specific project.
-
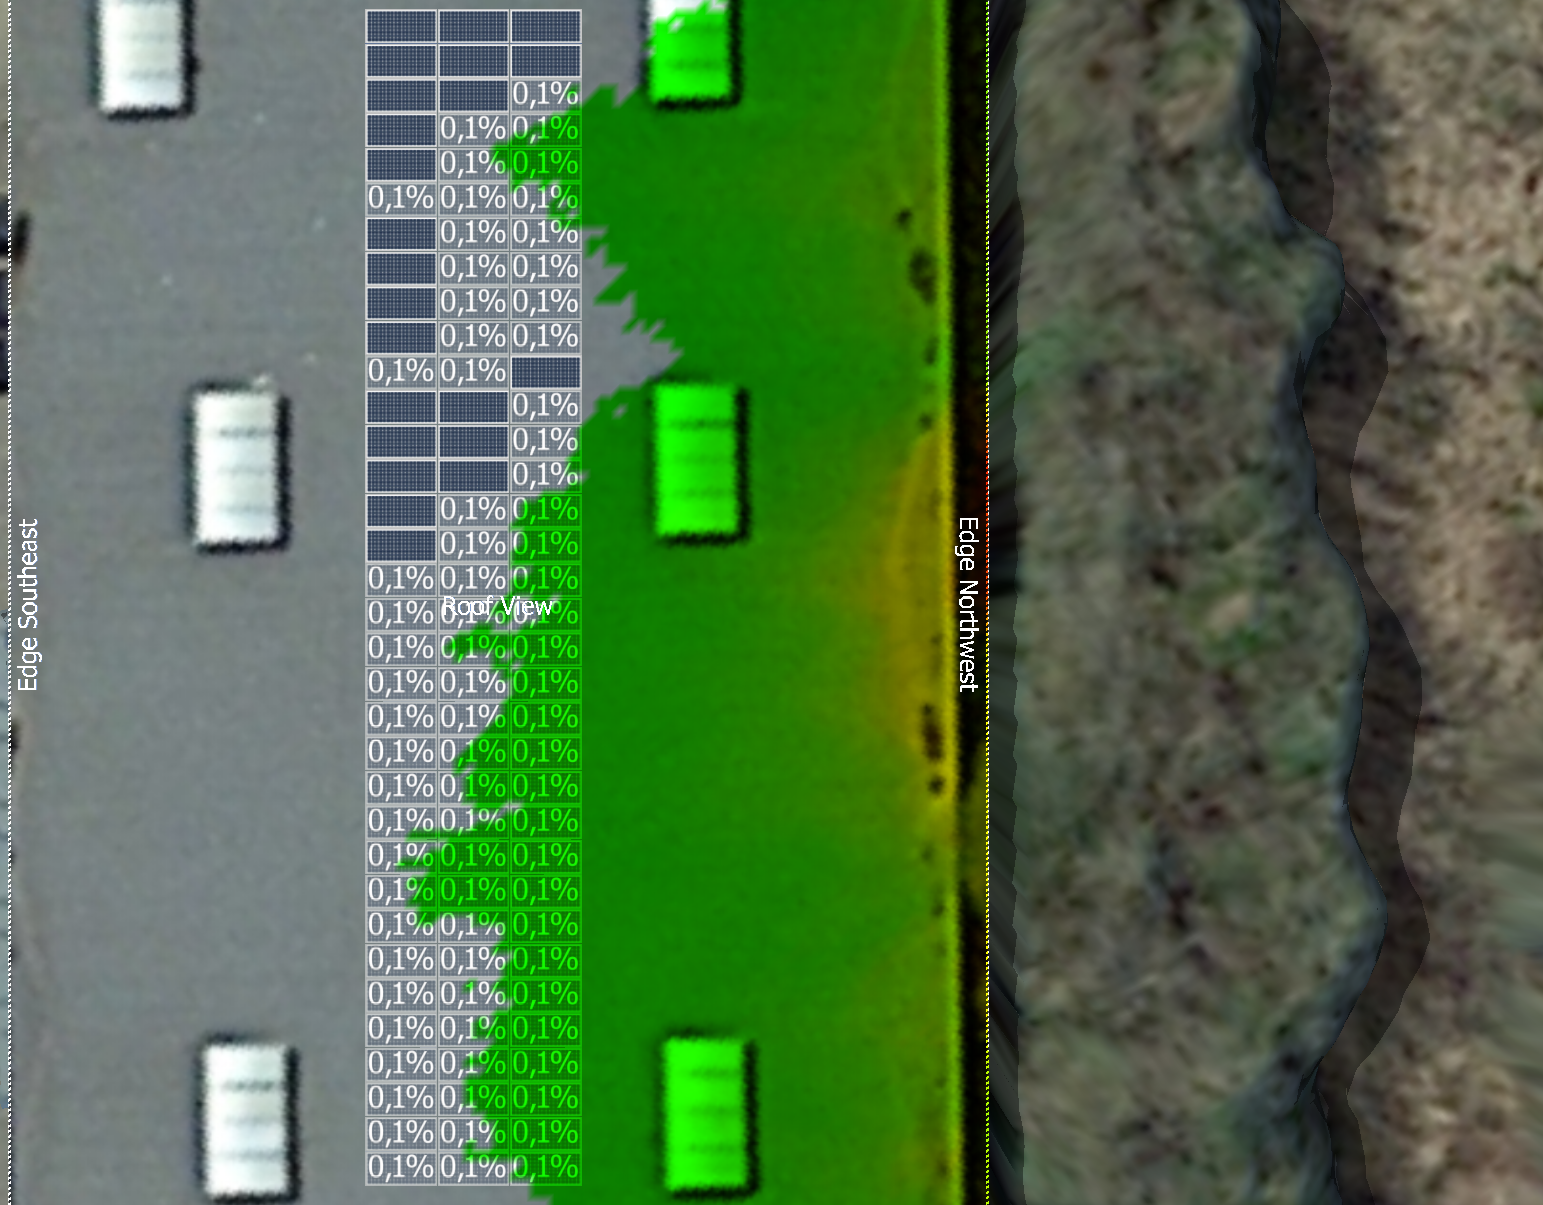
Dear Anders, Thank you for your message. We confirm that the result of the shading analysis is plausible. The trees are not very tall and the modules are not located directly at the roof edge. It should be taken into account that the trees could grow over the operating life of the PV system.

-
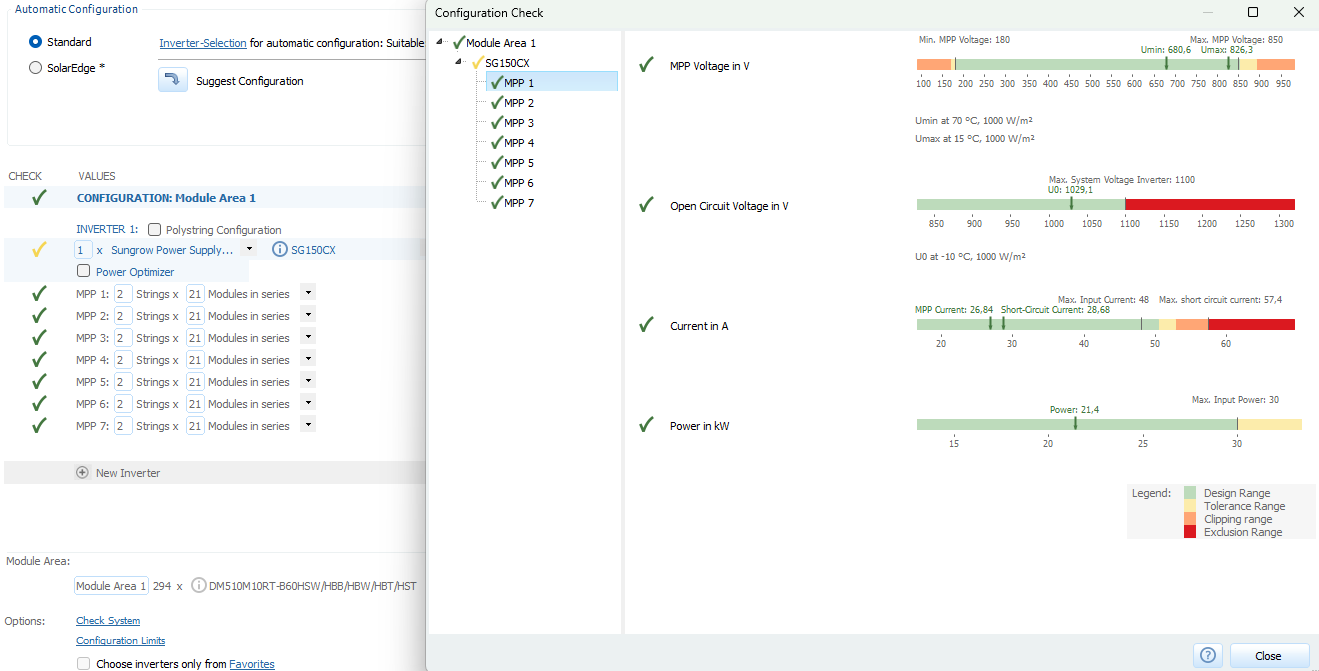
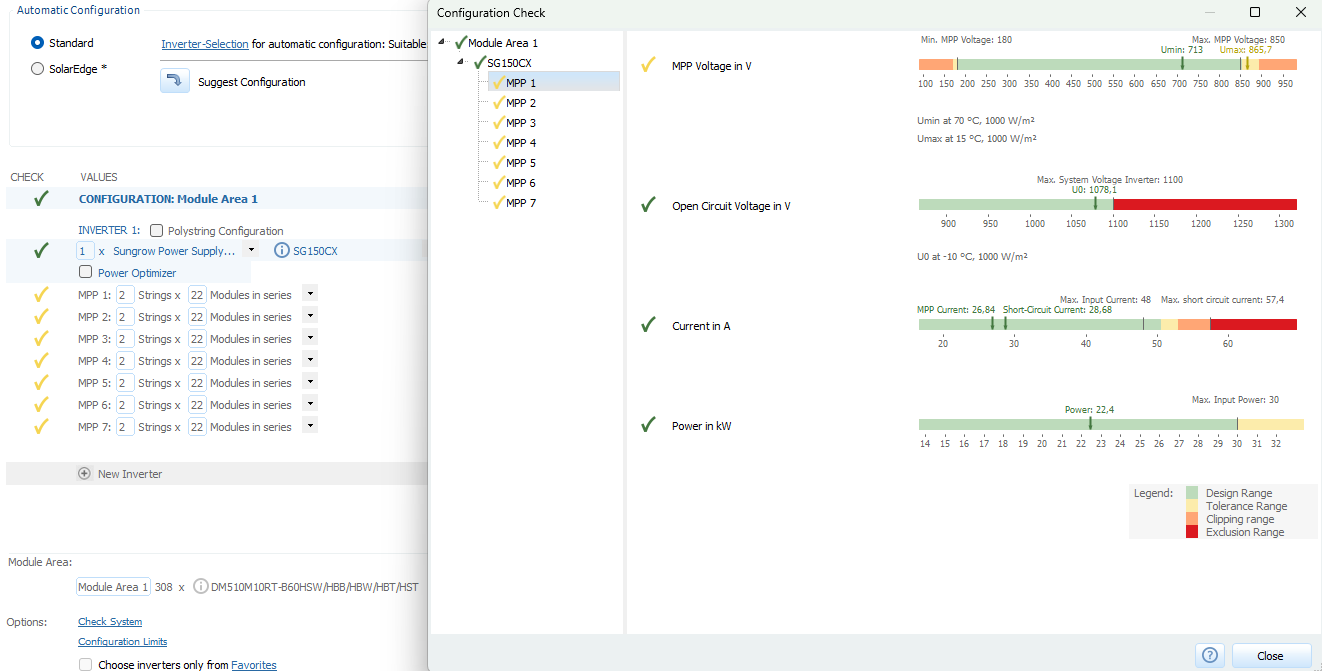
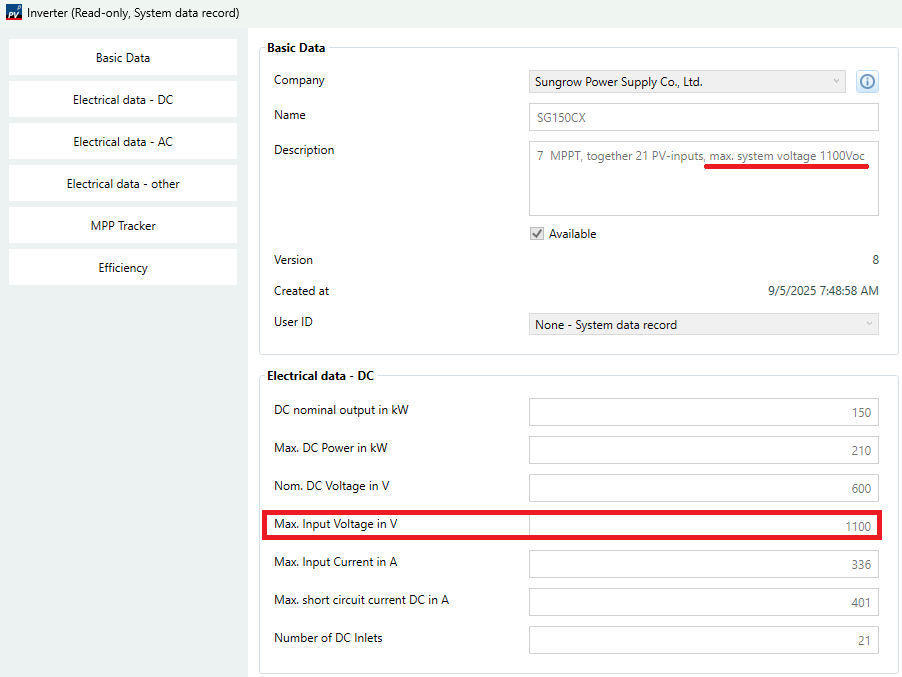
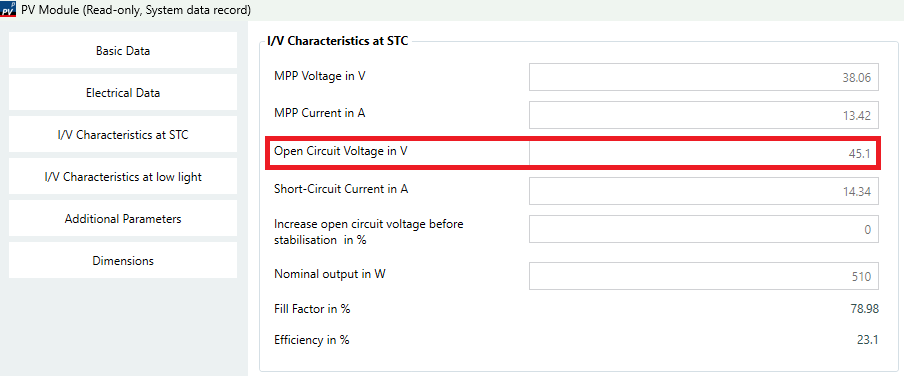
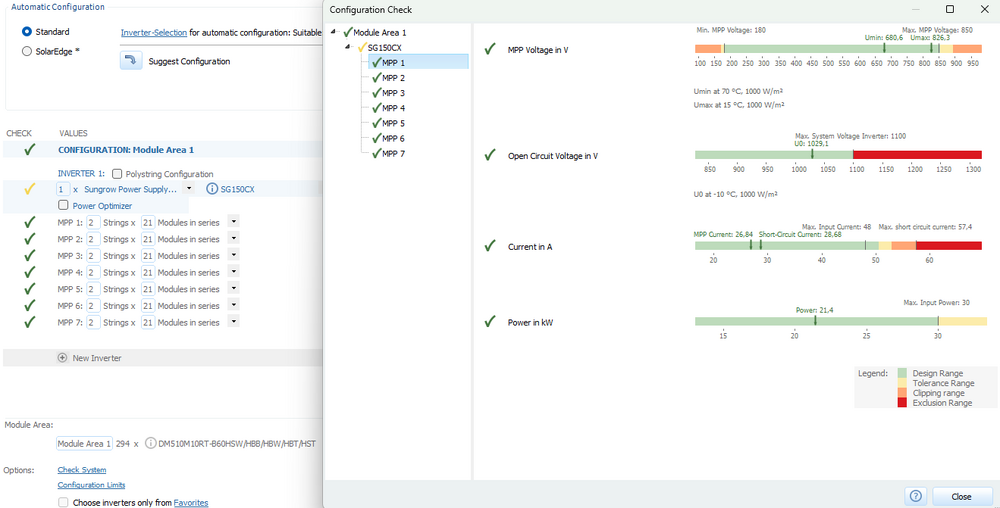
Dear CarlSEL, Thank you for your inquiry. We confirm that the manufacturer Sungrow has listed the SG150CX inverter with a maximum input voltage of 1100 V in our database: According to the datasheet, the open-circuit voltage of the DM510M10RT-B60HSW/HBB/HBW/HBT/HST module under STC conditions (25 °C) is 45.1 V. The maximum open-circuit voltage is calculated for -10 °C. The temperature coefficient of the voltage is -0.247%/K or -111.5 mV/K. The temperature difference from +25 °C to -10 °C is 35 Kelvin. This temperature difference leads to a voltage increase of 35 K * 0.1115 V/K = 3.90 V. This results in a maximum open-circuit voltage of 45.1 V + 35 K * 0.1115 V/K = 49.0 V per module. String with 21 modules: 1029.05 V String with 22 modules: 1078.06 V String with 23 modules: 1127.06 V String with 24 modules: 1176.06 V PV*SOL allows the connection of 21 modules (normal range) or 22 modules (MPP voltage tolerance range of 865.7 V, normal open-circuit voltage range of 1078.1 V). We cannot reproduce your configuration with 24 modules. Please send us a screenshot or the project file (*.pvprj) to hotline@valentin-software.com, and we'll take a look at it.

-
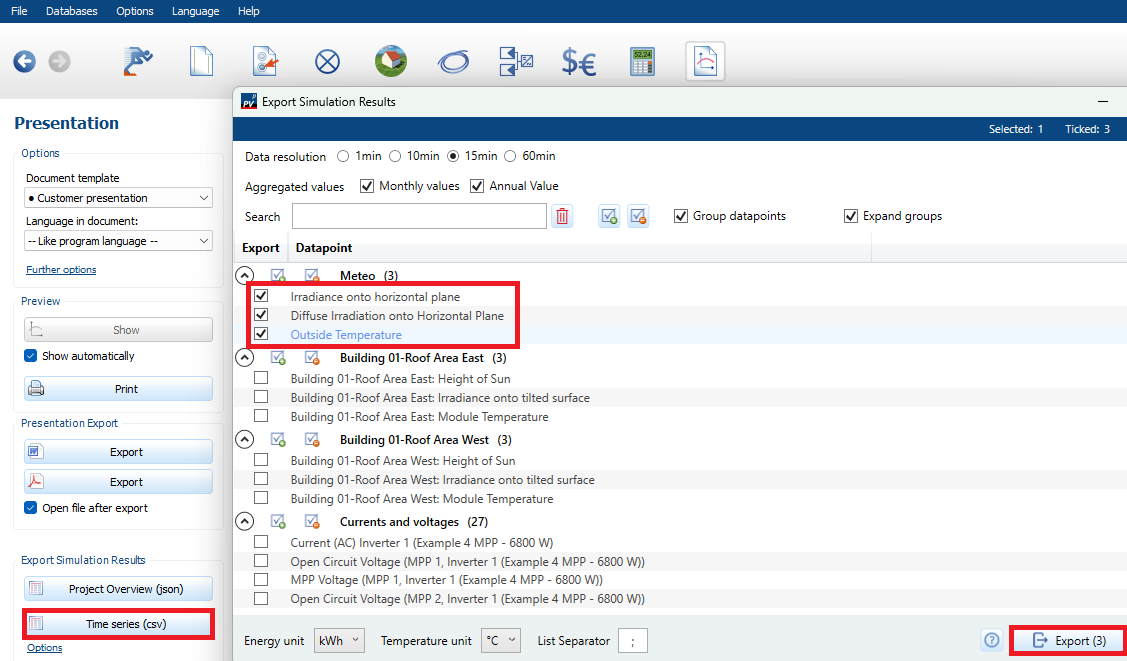
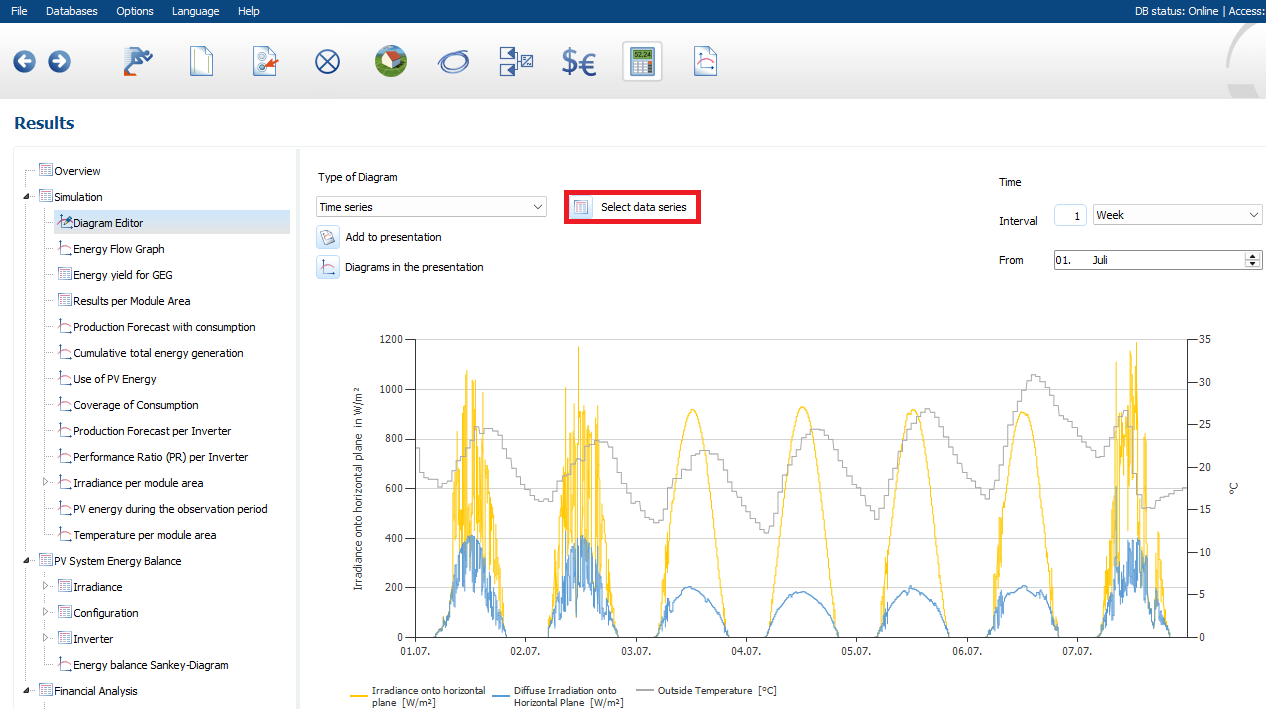
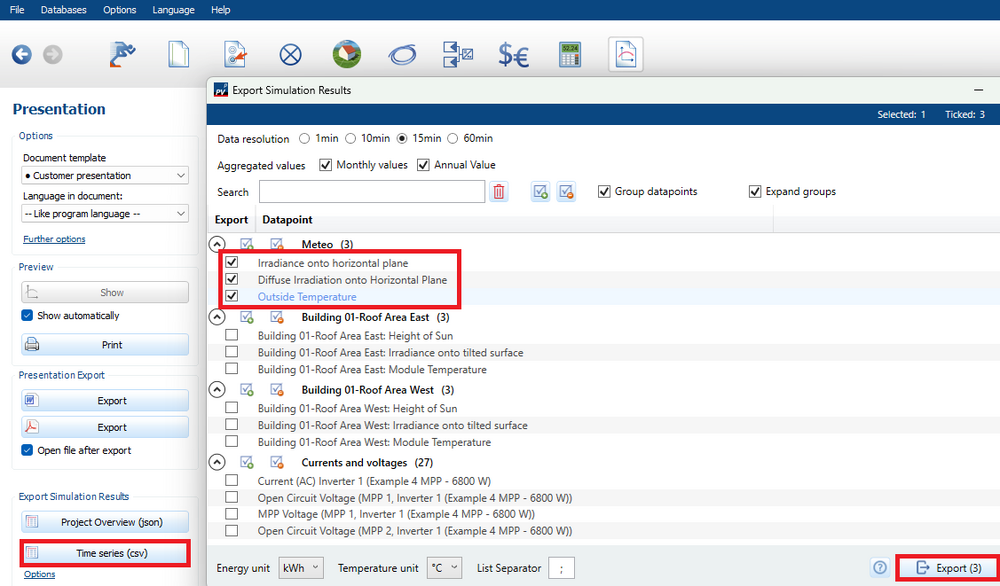
On the "Presentation" page, you can export the simulation results using the "Time Series (CSV)" button. Select the desired meteorological data series, and the radiation data in kWh/m² and the outside temperature in °C will be output to a CSV file: On the "Results" page, you can display the same data series for different time intervals in a diagram using the diagram editor:

-
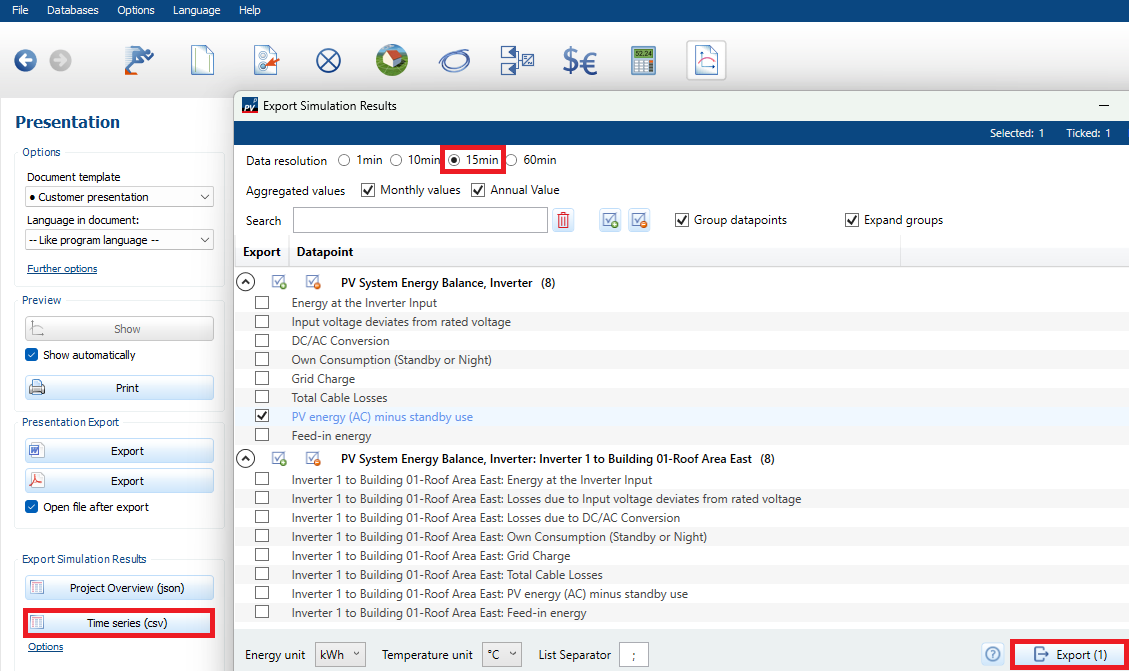
How do I export 15-minute values from the simulation results?
hotline_oh posted a question in FAQ (Read only)
On the "System Type, Climate, and Grid" page, select the 1-minute time step: On the "Presentation" page, you can export the simulation results using the "Time Series (CSV)" button. Specify 15 minutes for the data resolution. Select the desired data series, for example, "PV energy (AC) minus standby use," and the 15-minute values for a year in kWh will be output to a CSV file: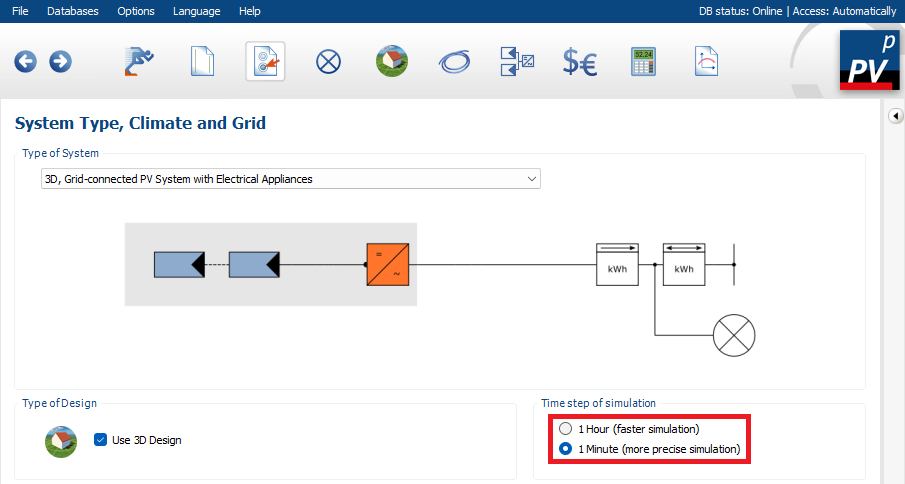

-
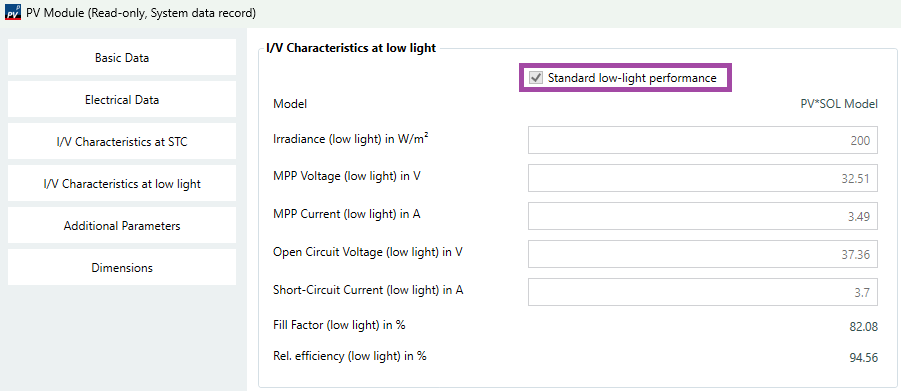
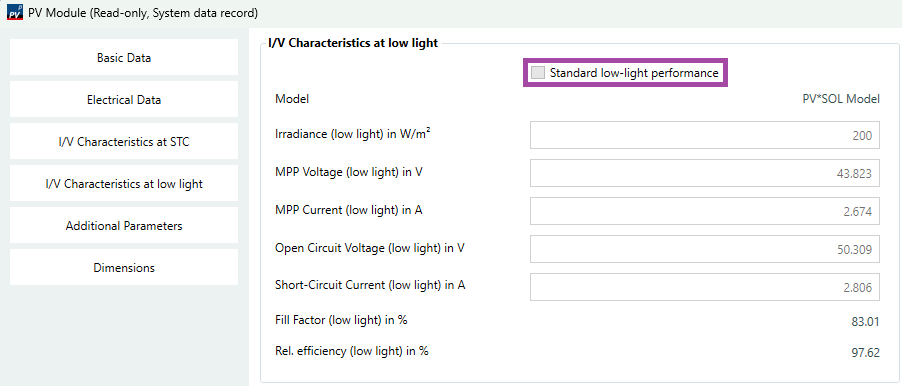
When simulating different modules that have the same power output and similar characteristics, yield differences are usually due to the low-light performance. Module manufacturers enter their own data into the PV*SOL database. They have the option to define a specific low-light performance for the module. A specific low-light characteristic curve is then calculated for the module. If a manufacturer does not do this, a standard low-light performance for the respective module type, e.g., monocrystalline, must be assumed. The low-light performance used for the selected modules can be found in the database. Example module (600 Wp) with specific low-light performance Example module (600 Wp) with standard low-light performance
-
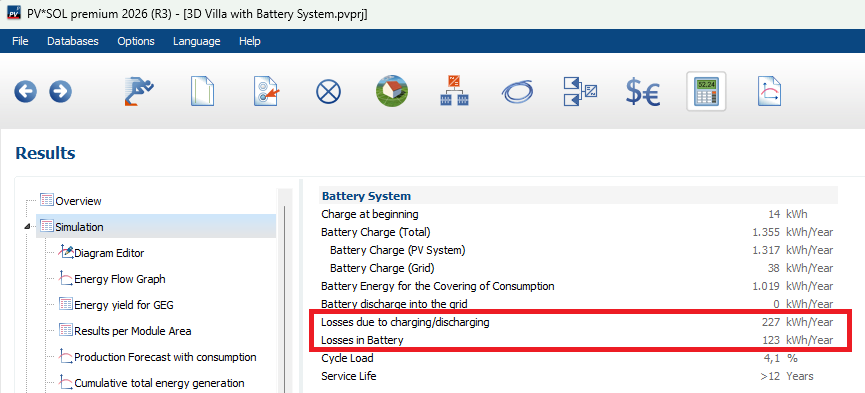
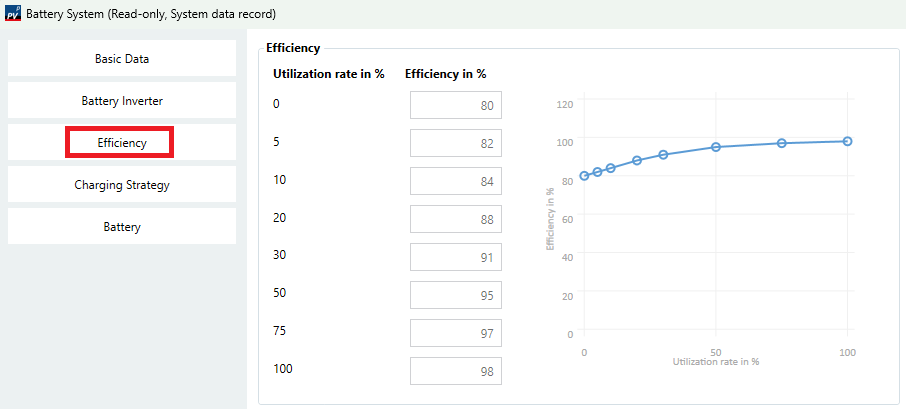
Losses during charging/discharging The efficiency curve of the battery system determines the losses that occur during the conversion of electrical to chemical energy and vice versa: Battery losses The battery's internal resistance and self-discharge rate determine the losses that arise from aging processes:

-
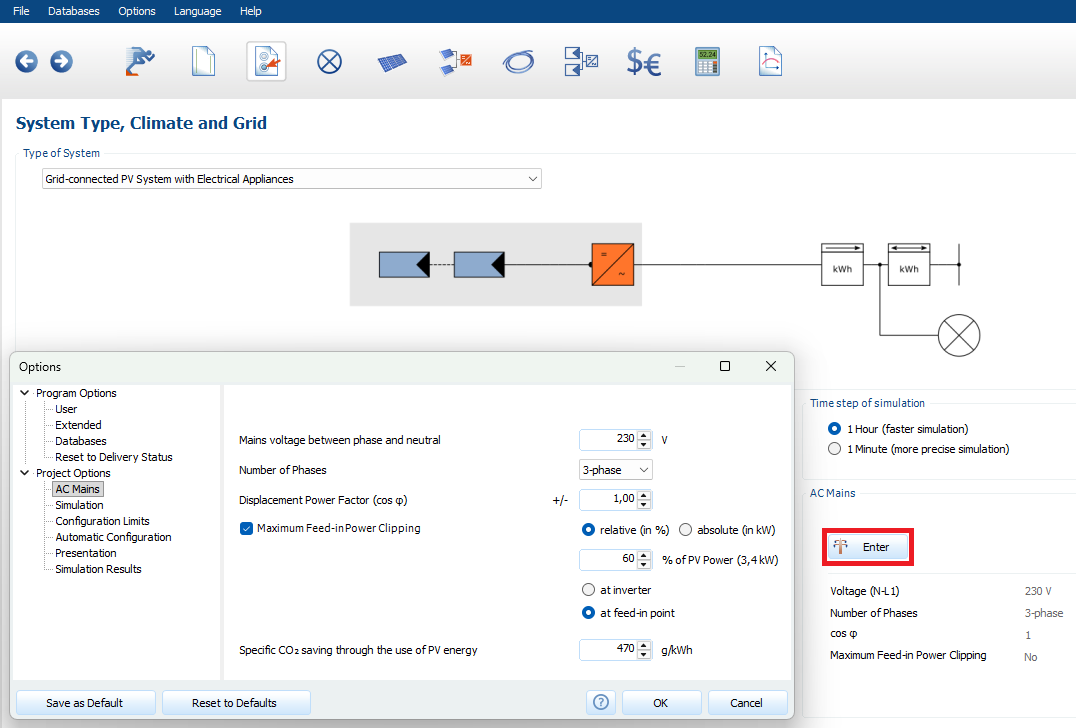
The reduced feed-in power can be entered in relative (in %) and absolute (in kW) terms. If you enter an absolute amount for several inverters of different sizes, this is converted by the software into a relative amount and distributed accordingly to all inverters. Small inverters are still penalised compared to large inverters because the small inverters are curtailed first when very small quantities are curtailed.

-
How can I use my own company logo in the project report?
hotline_oh posted a question in FAQ (Read only)
You can import your logo under "Options" → "User". Supported file formats are *.gif, *.bmp, *.png, and *.jpg. However, T*SOL only supports logos in bitmap format (*.bmp).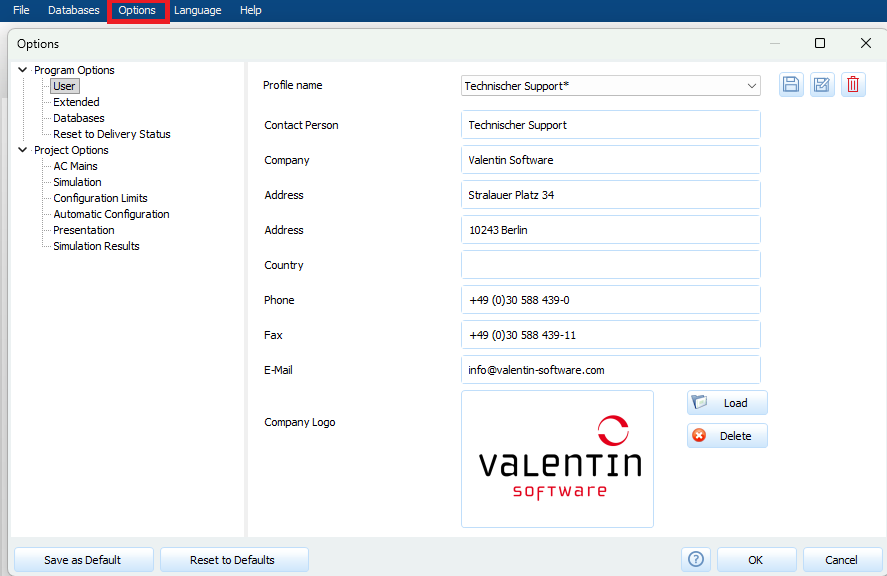
-
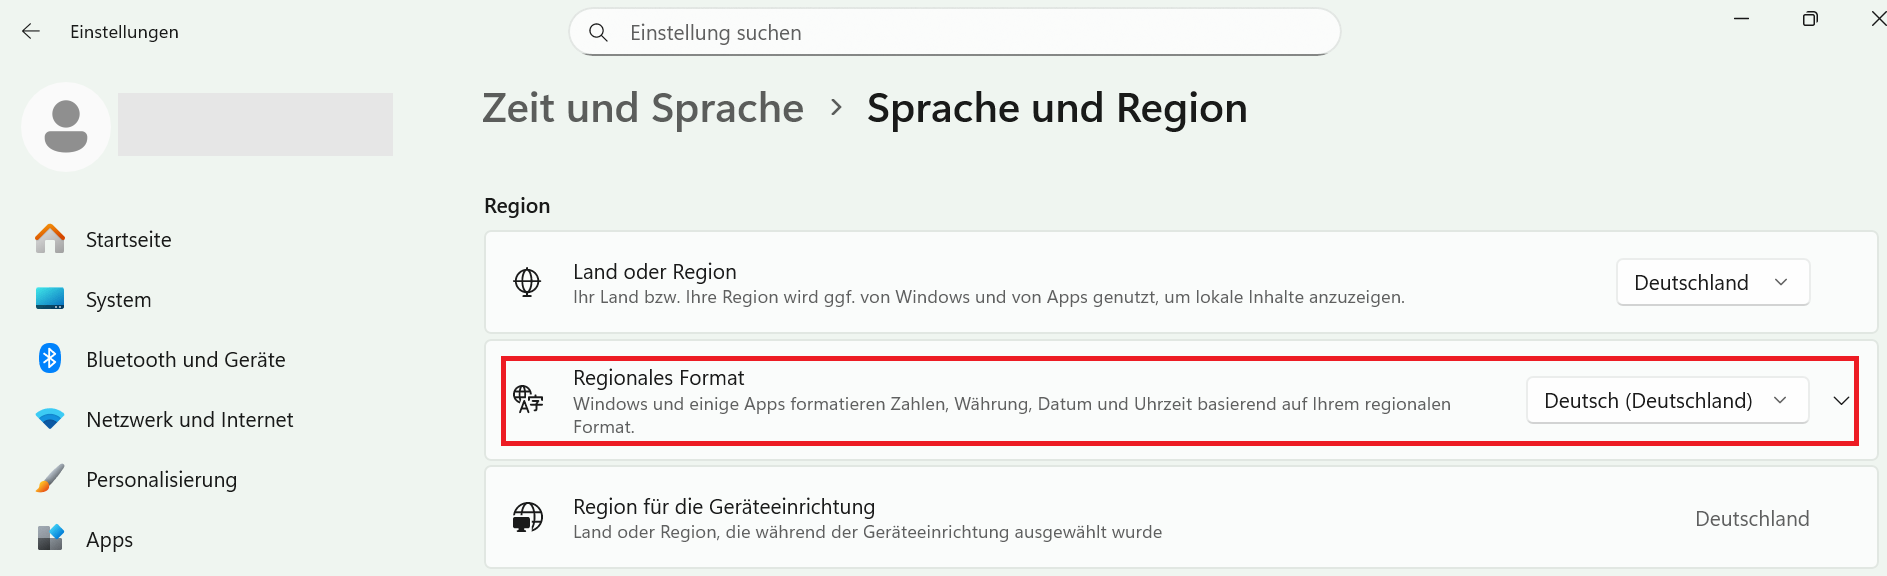
The unit of the currency in the program depends on the system settings of your operating system and can be changed in the Regional and Language Options of the Windows Control Panel.

-
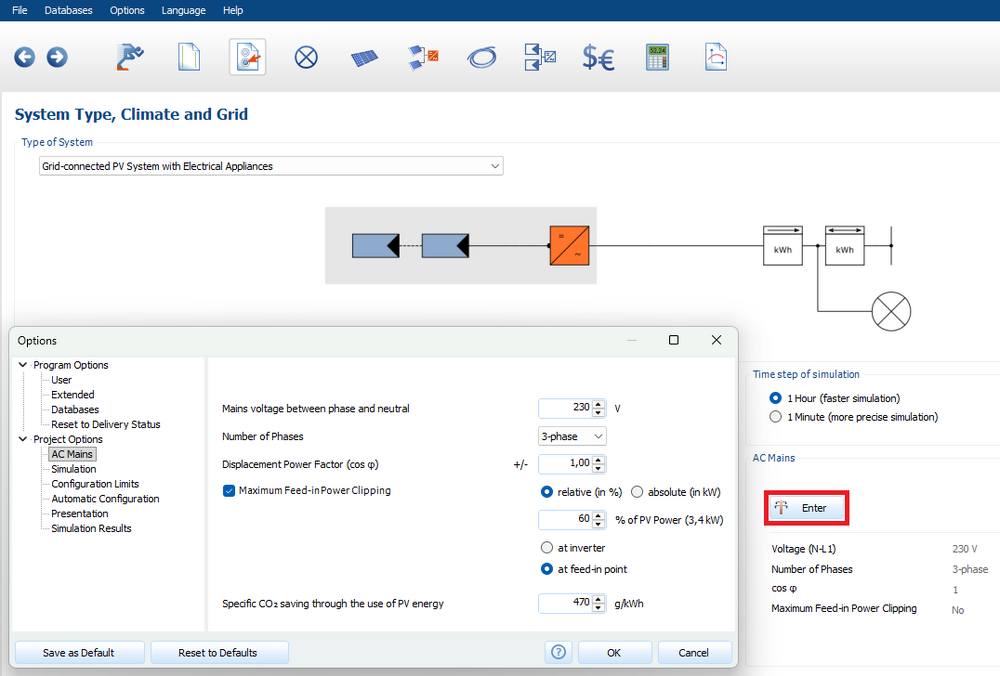
In the window "System Type, Climate and Grid" under "AC Mains" you will find the settings for the maximum feed-in power clipping and for the displacement power factor cos φ:
-
Installation Problems If you receive error messages during the software setup, please send us a screenshot of the error message via e-mail. Please note the following: Are you using the correct version? We provide the latest version of our software on our website. Your user license is valid for program versions from 2025 Release 1 onwards. Older program versions cannot be activated with a user license. Are you using the correct software? Some users confuse PV*SOL and PV*SOL premium. Has your license manager prompted you to register as a license user in our license portal? Have you registered and been assigned a valid license? You can find step-by-step instructions for using a user license in our help section, and further information can be found in the FAQs for the new licensing model.