
developer_mh
-
Posts
1,860 -
Joined
-
Last visited
-
Days Won
173
Everything posted by developer_mh
-
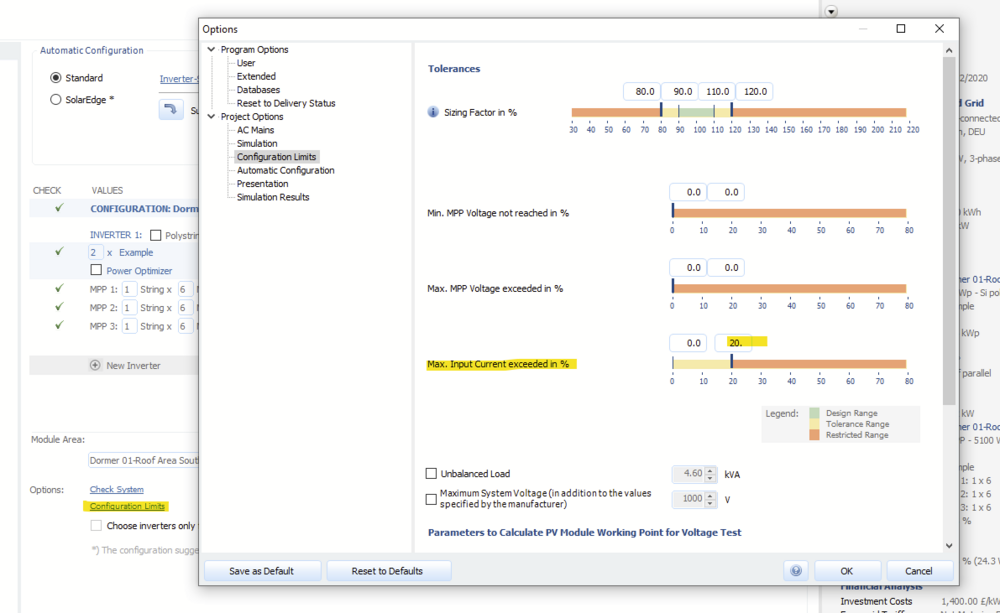
Hi Codrin, in addition to what Jimmy wrote, you can set the maximum allowed exceedance of the input current in the configuration limits dialog: Hope that helps, kind regards, Martin
-
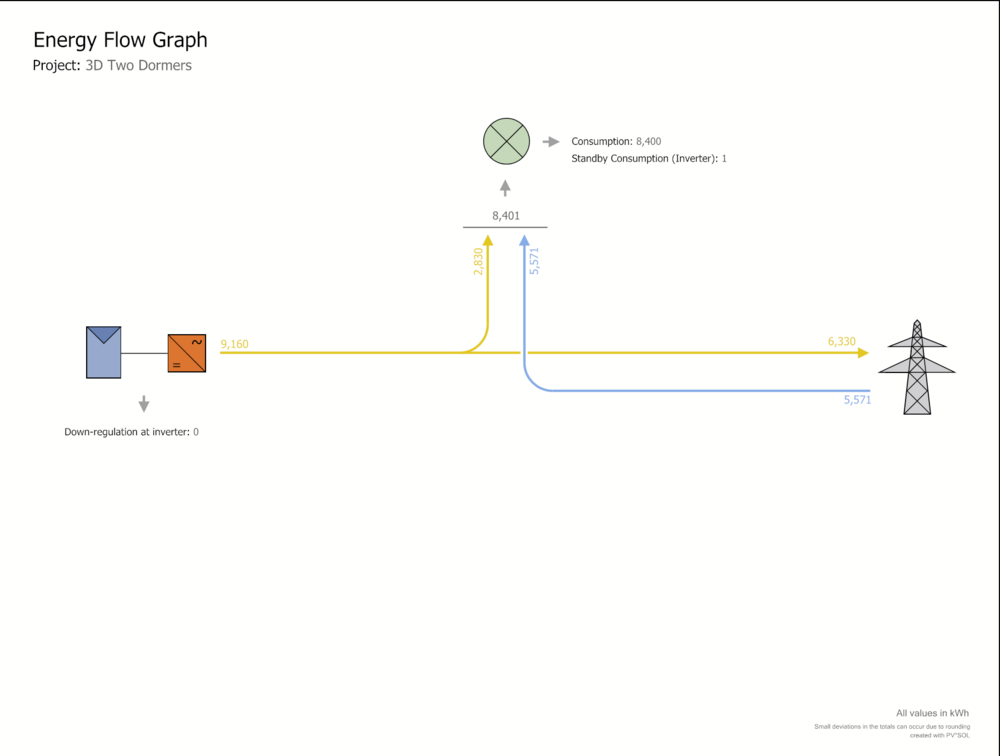
Hello Luai, in order to explain the direct use, grid feed-in and so on, let me copy a energy flow diagram from PV*SOL here: Direct own use is the fraction of the PV energy that is used directly to cover the loads, in this case 2830 kWh. The own power consumption ratio would be 2830 kWh / 9160 kWh = 30,9 %. The solar fraction is the amount of the consumption that can be covered directly by the PV. So in this example it would be 2830 kWh / 8401 kWh = 33.7 %. Concerning your second question, it would be very helpful if you could send me over the project file (here in the forum as private message). Kind regards, Martin
-

PV*SOL Google map data is older than the Google map data in browser
developer_mh replied to Jimmy's topic in PV*SOL
Hi Jimmy, we are sorry that you are experiencing this flaw with the outdated maps more often now. It seems that Google is updating its map material region-wise, and most probably you are planning a lot in a region where Google is currently updating. We do not have a release date for R5 yet, I am afraid. It will be released in the coming weeks, but when exactly is not yet decided. Kind regards, Martin -
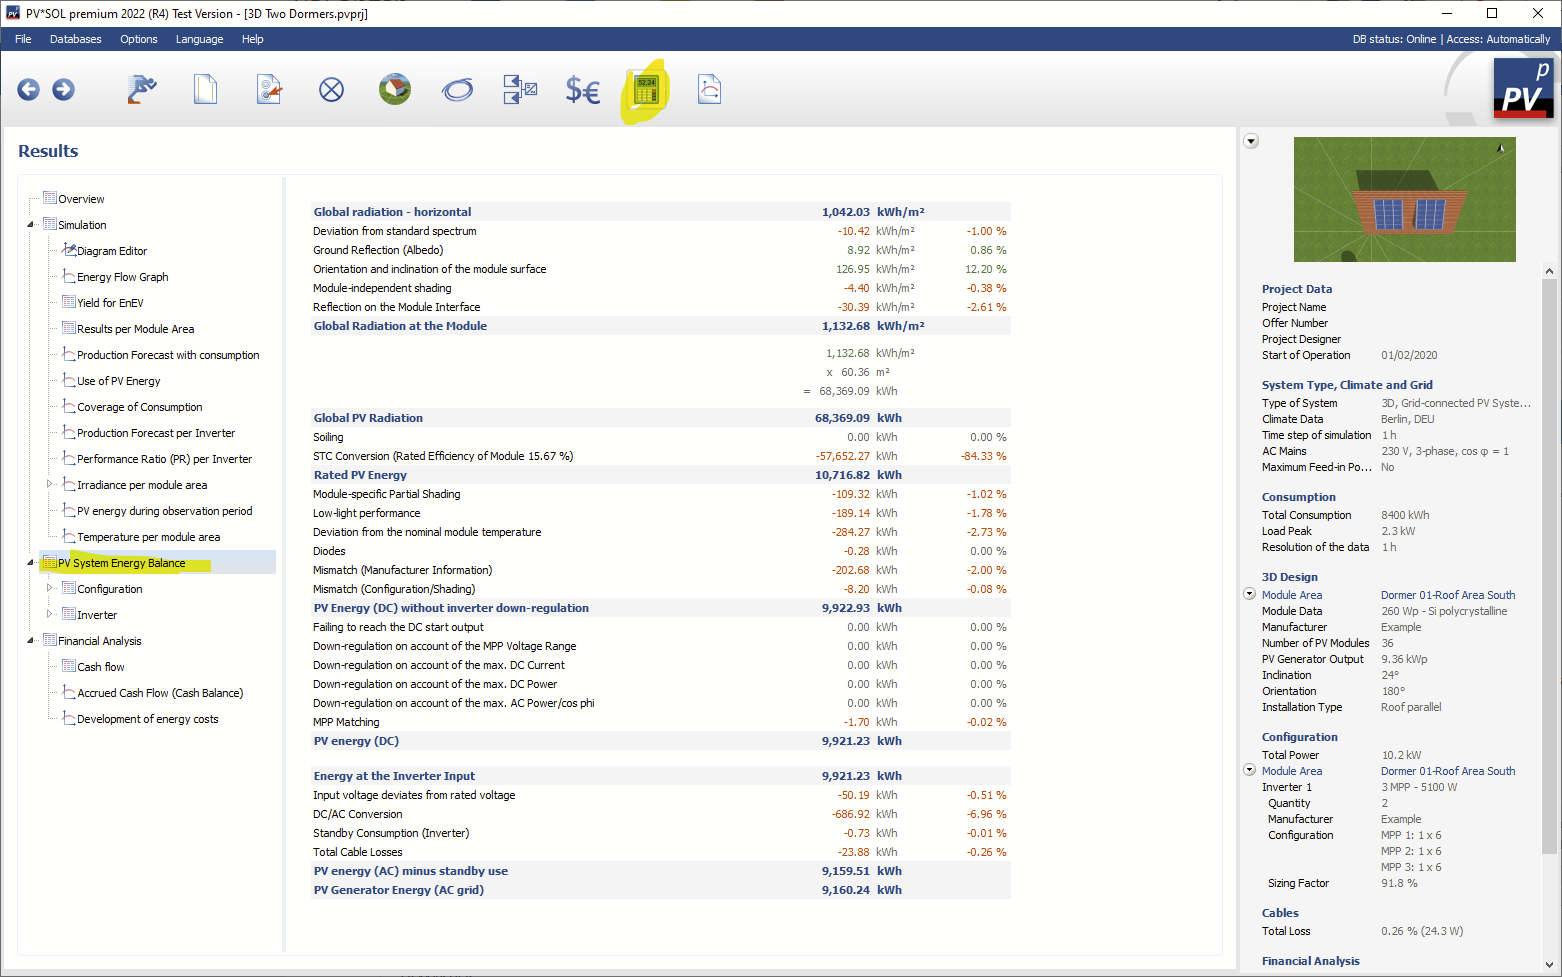
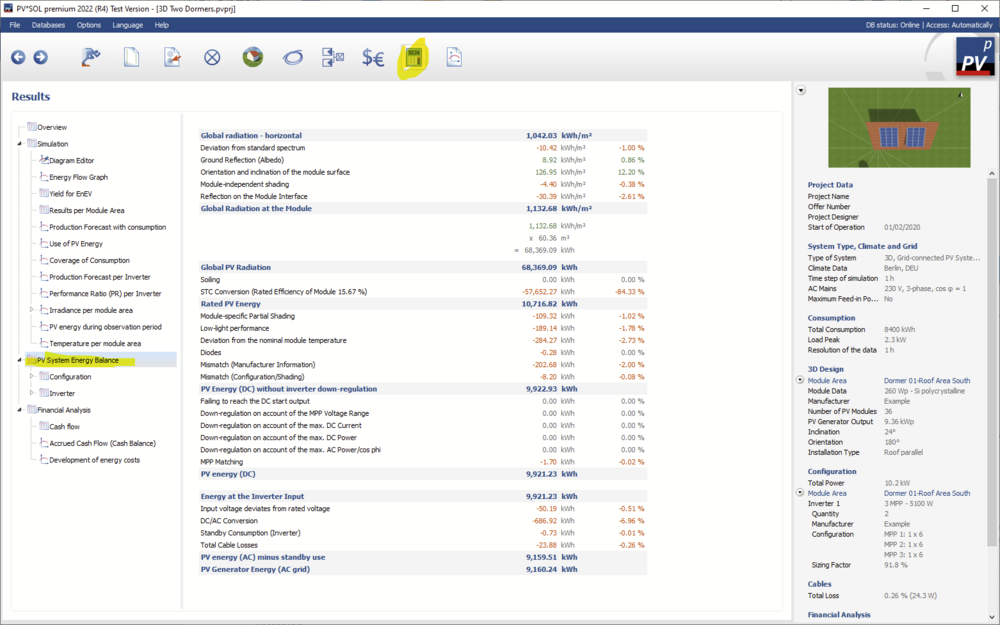
Hi M4KROS, the specific annual yield is the annual yield of the PV system (in kWh, AC) divided by the installed DC power in kWp. This means that literally everything from the solar irradiation and ambient temperature, over module inclination, orientation, shading, soiling, electrical configuration, inverter performance, cable losses and so on is taken into account. If you need to know in detail how a PV plant performs, a good start is always to check the energy balance in the results section: Then, also, if you need to investigate some losses more in detail, you can go to the diagram editor, choose time series or carpet plots to analyse single data series. You can also export them to Excel or LibreOffice Calc if you wish. Hope that helps, kind regards, Martin
- 1 reply
-
- 1
-

-
Design with DC combiner on 1 MPPT inverter with 2 string input
developer_mh replied to Paul's topic in PV*SOL
Hi Paul, you'll have to activate the polystring option in the configuration dialog. Then you can combine the strings and modules as you wish, in series or parallel. Hope that helps, kind regards, Martin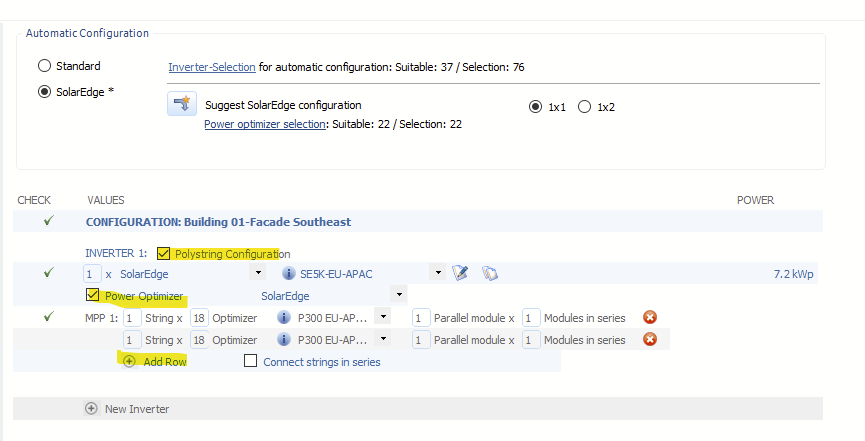
- 1 reply
-
- 1
-

-
Hallo AoS, doch, eigentlich geht das schon. Könntest du mir das Projekt zukommen lassen, dann kann ich mal schauen. Gerne hier im Forum als private Nachricht. Beste Grüße, Martin
-
Belegung gemeinsamer Fassadenfläche und Problem mit Verschiebung der Tiefe
developer_mh replied to Lukas615's topic in PV*SOL
Hallo Lukas, am besten arbeitest du in diesen Fällen nicht mit Stockwerken, sondern extrudierten Objekten. Diese kann man beliebig aufeinander setzen, und auch mit Attikas versehen: Die äußere Attika-Fläche kann jedoch leider nicht mit belegt werden. Beste Grüße, Martin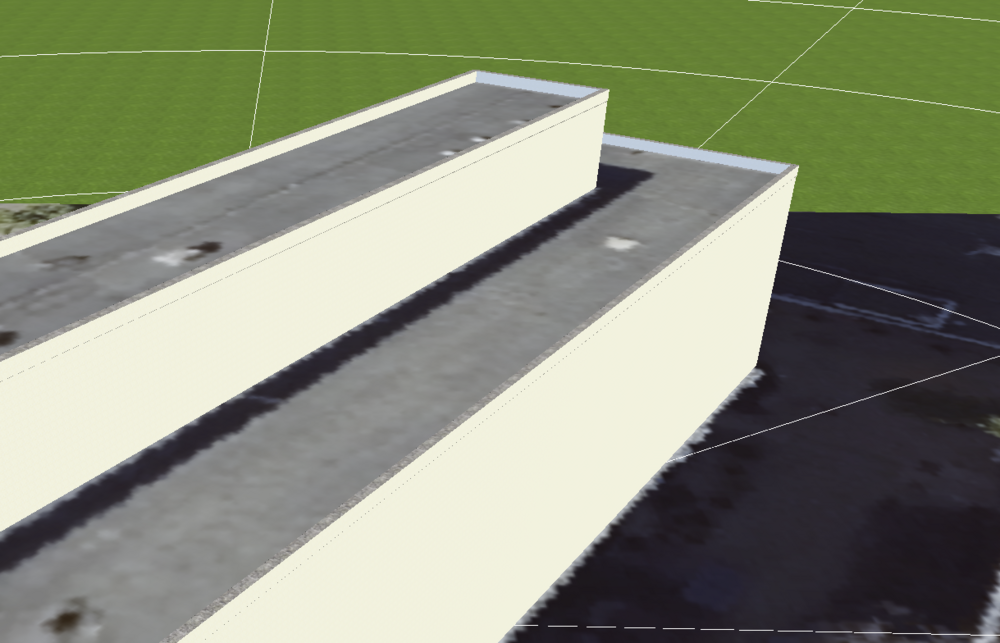
-
Modeling cable losses on AC side for multiple inverters
developer_mh replied to Rob's topic in PV*SOL
Hi Rob, this is not possible right now in PV*SOL, but we already have this feature request on our list. What I would recommend right now is to model the cable for each inverter as if it was part of the long distance cable. As an approximation this is possble if your inverters roughly have the same power. As the loss power is calculated with P = I_big² · R_big, and R_big = ρ · l / A_big. So through your big cable with cross section A_big you have the current I_big, which is the sum of the currents of your individual inverters. If we suppose that all inverter currents are the same at any time (which they aren't, but we have to assume it as an approximation), we can say that I_big = n · I_inv, with n being the number of inverters. So the cross section of each individual inverter cable would have to be divided by n in order to obtain approximately the same result. Example: You have one big cable of 300m length with 300mm² cable with 4 inverters connected to it. This is roughly the same, in terms of power loss, as 4 individual cables with 75 mm² (300 / 4). If each inverter would have an output current of 10A, the power loss in the big cable would be (4 · 10 A)² · R_big = 1600 A² · 0.028 Ωmm²/m · 300 m / 300 mm² = 44.8 W If each inverter has its own cable, then it is (10A)² · 0.028 Ωmm²/m · 300 m / 75 mm² = 11.2 W, but you have that four times, so its 4 · 11.2 W = 44.8 W Hope that helps, kind regards, Martin -
Hi TurtlesOG, try to deselect "Corrigir distorção" in the extrude dialog and see if the texture is correct now. Kind regards, Martin
-
Guten Morgen Tom_ebr, das geht relativ einfach und ist hier beschrieben, Abschnitt "Lastprofile importieren" https://help.valentin-software.com/pvsol/2022/de/navigationsseiten/verbrauch/#gemessene-verbraucher Viele Grüße, Martin
-
Hi Tiago Motta, we are currently investigating this issue. The attica shading problem and the problem with obj models are possibly unrelated, though. It would be very helpful if you could provide the original obj files, along with the information which photogrammetry software you used to create it. Also the PV*SOL project that you took the screenshots of would be very helpful. Could you please send these files to our technical support team at hotline@valentin-software.com? Just add a short hint in your email that they should forward it to me. Thanks a lot and kind regards, Martin
-
Combine multiple PV arrays / Edit PV grid layout
developer_mh replied to TurtlesOG's topic in PV*SOL
Hi TurtlesOG, hi Jimmy, it is possible to combine module areas of the same orientation and inclination already in the "Define Module Areas" dialog: Hope that helps, kind regards, Martin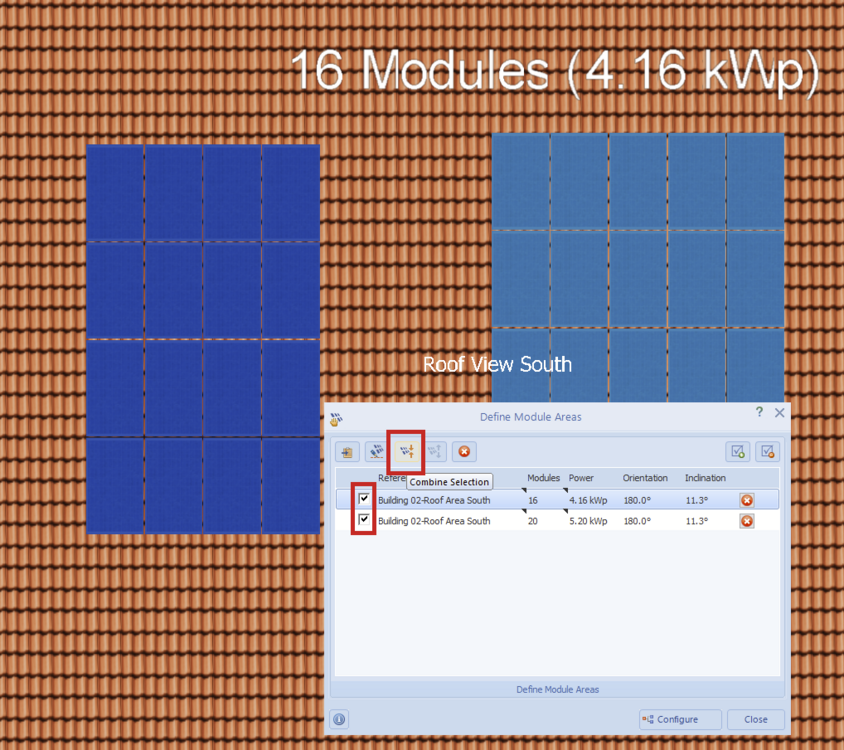
-
Hi GdE, here is a translation of you question, made with deepl.com: You can use the net metering option in PV*SOL. On the economy page, switch to net metering. There you can enter the tariff zones and prices. Then, in the consumption page, you can enter the monthly consumption values. See also this forum thread for example: Hope that helps, kind regards, Martin
-
Hi Silvester, coudl you provide more details about the error? Can you make a screenshot? Also, the logfiles would be interesting. You can find them here: C:\ProgramData\Valentin EnergieSoftware\log C:\ProgramData\Valentin EnergieSoftware\log You can send them to me with a private message here in the forum. Thanks and kind regards, Martin
-
Dear Flavio, does this happen every time that you try to select a PV module in 3D? Could you click on "send bug report", please and let us know the time and date? That'd be helpful, thanks. Also, could you provide your log files, please? You can find them here: C:\ProgramData\Valentin EnergieSoftware\log The files with PVSOLpremium in their name would be helpful. You can send them to me here in the forum as private message. Kind regards, Martin
-
Hi Marius, the optimizers are only shown in the circuit diagram, I am afraid. Kind regards, Martin
-
Hallo N_G, die Rückseitenstrahlung wird tatsächlich simuliert, mit dem View-Factor-Modell. Mehr dazu hier: https://help.valentin-software.com/pvsol/2022/de/berechnungsgrundlagen/pv-module/bifaziale-module/ Beste Grüße, Martin
-
Hallo N_G, nein, das geht auch in der Test-Version. https://help.valentin-software.com/pvsol/2022/de/navigationsseiten/anlagenart-klima-und-netz/meteosyn/#optionen Beste Grüße, Martin
-
Interesting! Thanks, Jimmy
-
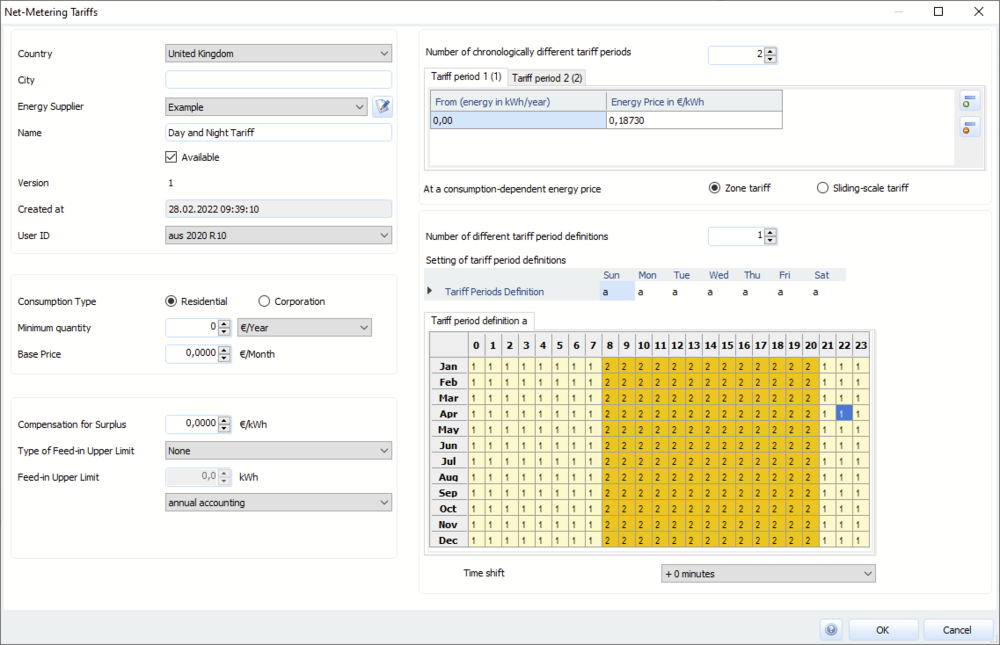
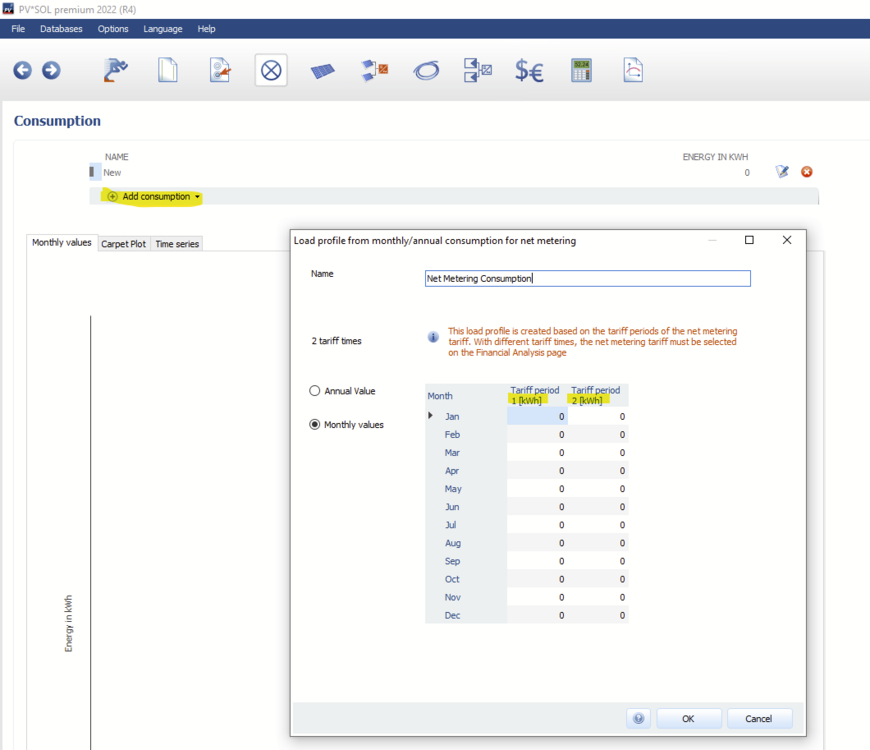
Hi Carl, first you would have to enter a net metering tariff with two periods. You can set the numbers 1 and 2 in the table of the tariff period definition as you require. Then, if you choose " add consumption" on the consumption page, and you choose "Monthly / annual consumption for net metering", you'll get this dialog where you can enter the day and night time consumption values from your customers: Hope that helps, kind regards, Martin
-
Module verschoben oder (automatisch) falsch belegt
developer_mh replied to Gerardo's topic in PV*SOL
Hallo Gerardo, Dachfenster sollten bei der Belegung auf jeden Fall ausgespart werden. Könntest du dich mit Projekt und Kundennummer an unsere Hotline wenden? Dann können die sich das mal anschauen. https://valentin-software.com/support/technischer-support/ Danke und viele Grüße, Martin -
Super! Schön, dass es sich geklärt hat. Beste Grüße, Martin
-
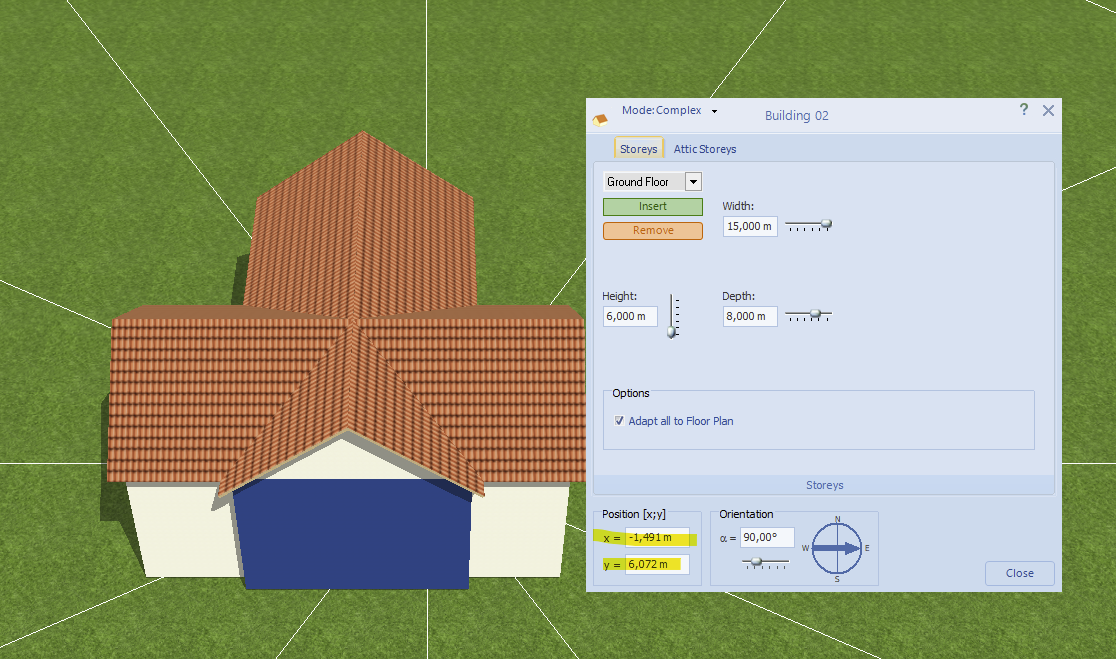
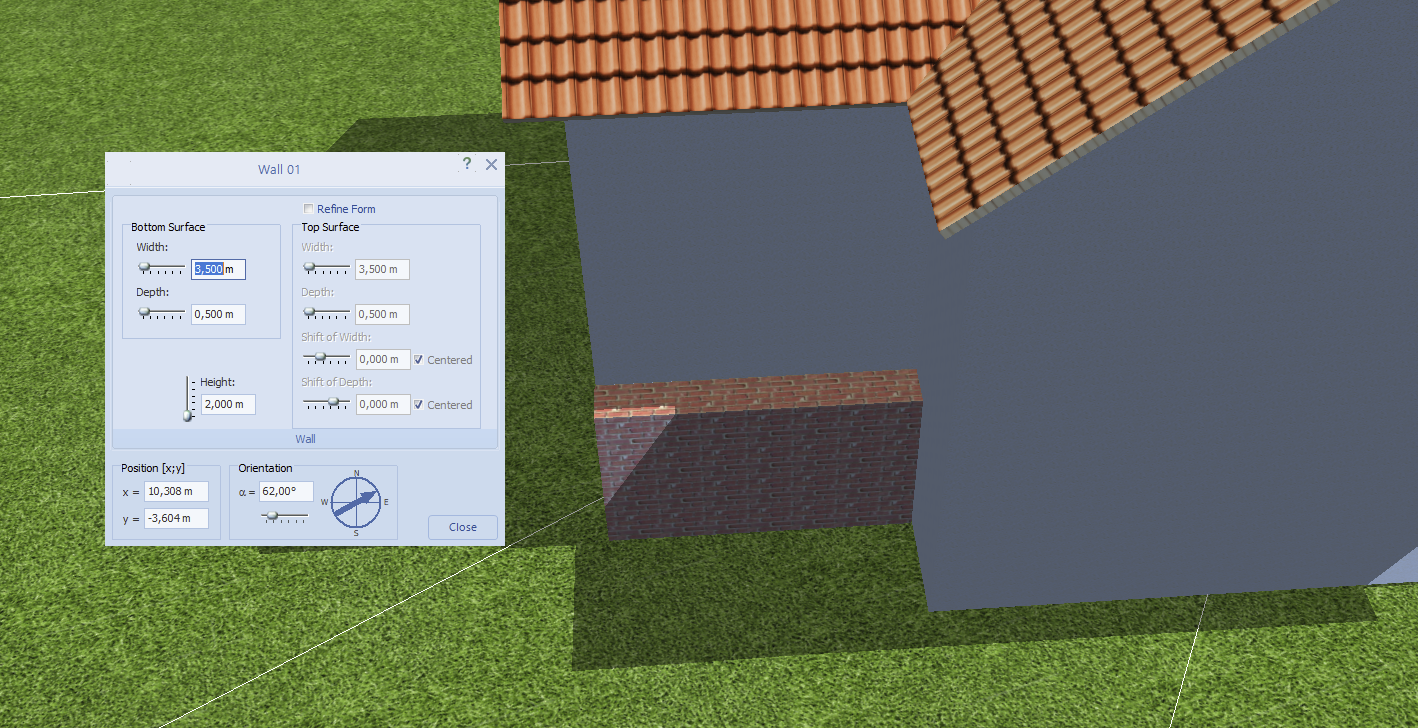
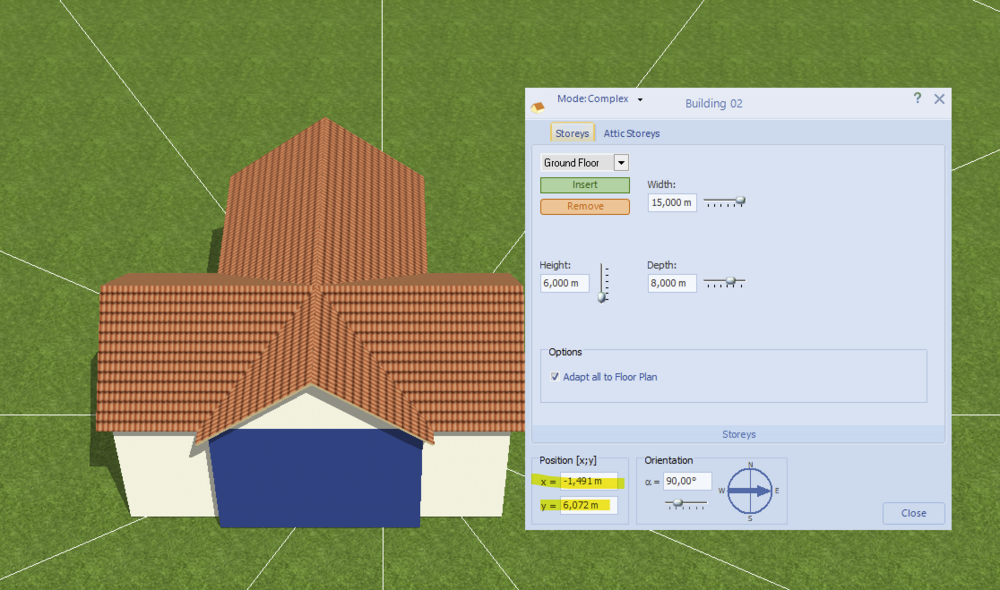
Hi Sondre207, I am sorry, I don't really understand what you mean. Do you mean "green line" instead of "blue line"? If you need to place buildings precisely, you can use the position fields in the edit dialog: If the buildings are rotated, the math becomes a bit more complex. So I'd recommend to create a small wall with the desired distance from the edge, and then place the other house accordingly: Here, my wall segment is 3.5m wide, because my main building is 15m wide and the rotated building is 8m wide. Once you have placed the second building correctly, you can remove the wall segment. Kind regards, Martin
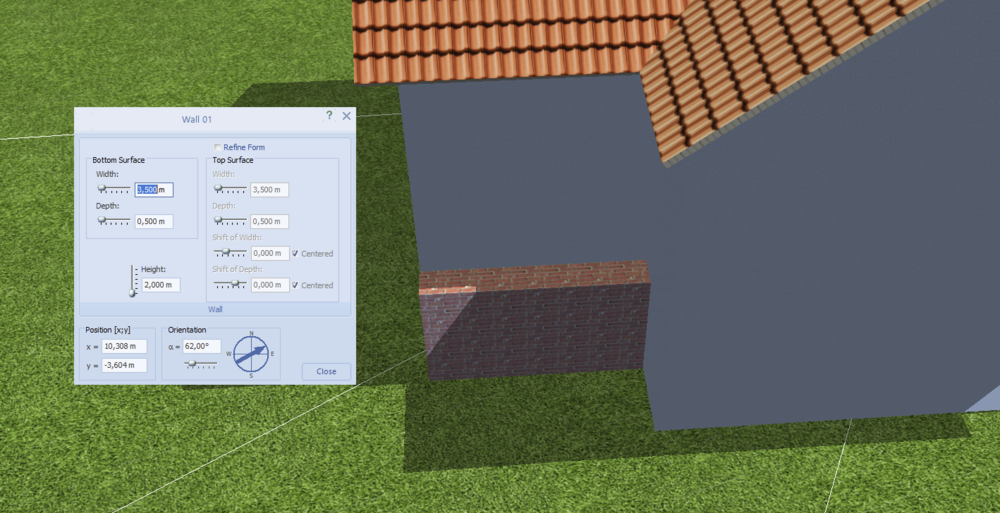
-
Hi Sondre207, no, this is not possible, at least from within PV*SOL. However, you can export the circuit diagram as SVG file, open it in inkscape (or any other vector editing software), and add the text yourself: Hope that helps, kind regards, Martin

-
PV*SOL Google map data is older than the Google map data in browser
developer_mh replied to Jimmy's topic in PV*SOL
Hi Jimmy, thanks for reporting this, and thanks for the coordinates as private message. We will be able to fix this in the new version PV*SOL premium 2022 R5. Kind regards, Martin