developer_mh
-
Posts
1,855 -
Joined
-
Last visited
-
Days Won
173
Everything posted by developer_mh
-
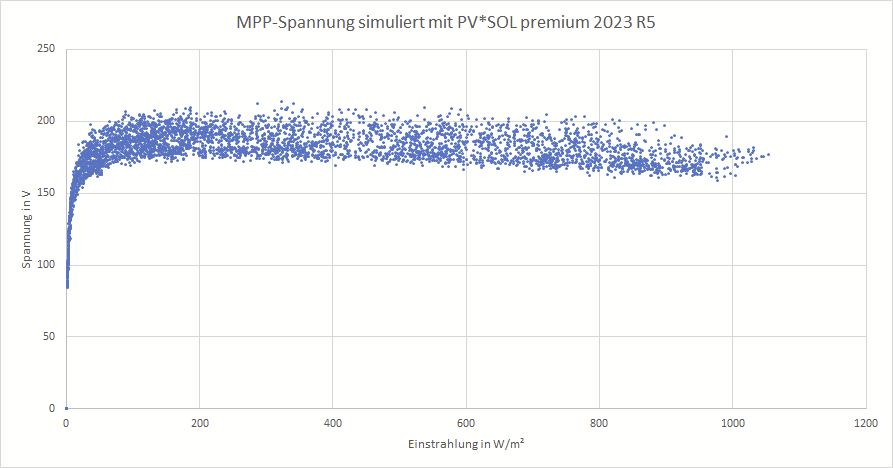
Hallo Max, die Spannung nimmt im Gegensatz zum Strom nicht (nahezu) linear mit der Einstrahlung ab. Sie bewegt sich vielmehr in einem relativ konstanten Bereich, bis runter zu etwa 50W/m². Erst dann nimmt die Spannung rapide ab. Bei 1000 W/m² liegt die MPP-Spannung sogar in der Regel etwas unter der Spannung im Schwachlichtbereich von um die 200 W/m². Ich habe mal eben eines unserer Beispielprojekte simuliert und die Datenreihen "Einstrahlung auf die geneigte Fläche in W/m²" und "MPP-Spannung in V" extrahiert, um daraus in Excel einen Scatter-Plot zu machen: Beste Grüße, Martin
-
Hallo Dennis, das Problem haben in der Tat viele Nutzer, und auch viele Anbieter von Photogrammetrie-Software sind dabei, die Modelle besser zu machen. Es ist leider nach meinem Kenntnisstand momentan nicht trivial, gute Modelle aus Drohnen-Aufnahmen zu machen. Mit "gut" meine ich: Möglichst wenige Punkte und möglichst plane Dachflächen mit geraden Kanten. Es gibt aber durchaus Leute, die das heutzutage produktiv einsetzen und auch einen Weg gefunden haben, der gut funktionert. Damit können wir leider nicht dienen. Aber mit pix4d sollte das schon einigermaßen gehen. Der Schlüssel zum Erfolg ist wirklich, vor dem Export als obj die Anzahl der Punkte zu reduzieren. Wie genau das in pix4d geht, weiß ich nicht, ich weiß nur, dass es geht Kleiner Hinweis: Einer unserer Schulungspartner bietet auch Kurse an, in denen man wohl genau das lernt: https://solarklima.de/solar-schulungen/veranstaltungen/pvsol-premium-aufbauschulung-3d-praesenz-3/ Und vielleicht ergibt ja die Suche hier im Forum noch den ein oder anderen Tipp. Viele Grüße, Martin
-
Hi Rakeshevergen, the own consumption is the result of the interaction between the energy production of the PV system and the energy consumption of the consumers. It cannot therefore be adjusted, so that it is 25%, for example. If the PV system produces 10000 kWh per year, for example, and you have a consumption of 2500 kWh, this would represent 25% of consumption over the year. But it is not said that the PV system can cover the load at all times. The simultaneity and the performance profiles of PV and load are decisive factors here. The time step of the simulation also has a considerable influence on the own consumption. It is best to select a few load profiles, and vary the annual energy consumption and then simulate this. You will see how your own consumption changes in the results. If you PV energy generation is 589 342 kWh, it won't be possible to achieve an own consumption of 480 000 kWh. This would mean a own consumption ratio of over 80%. Even with battery storage it is unlikely to get such a high ratio. But it really all depends on the load profile that you have. If all the energy is consumed during day time it might be possible. If you need more support, let me know. Kind regards, Martin
-
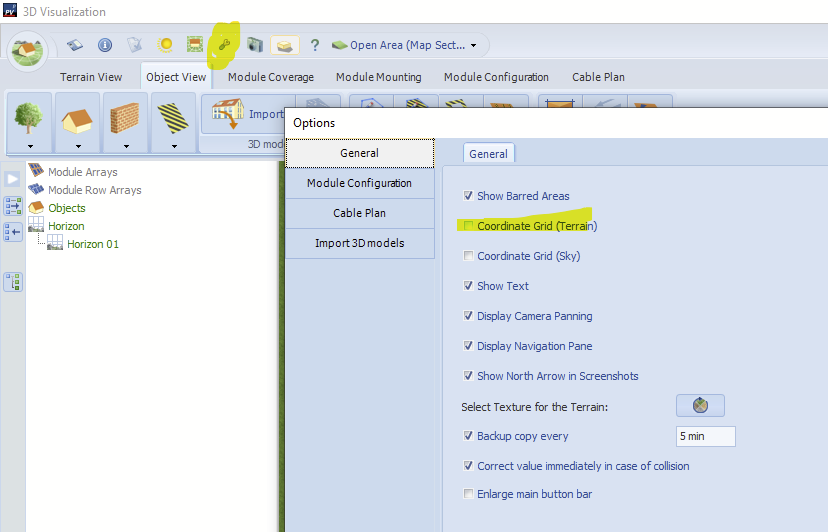
Hi Rekeshevergen, you deselect the option "Coordinate Grid (Terrain)" in the 3D environment: Kind regards, Martin
-
Hi Graniti, do you want to configure the modules manually? Or do you want to get automatic configurations with only one inverter? In your example, the inverter is too small to take all the modules, so you will have to use two. Could you explain what you want to achieve exactly? Thanks and kind regards, Martin
-
Hi Michal, you are right, the cable lengths from 3D are not adopted into the cabling section of the main software. Mostly, this is due to the higher degree of flexibility that you have on the 3D side. If you need the cable lengths for planning and simulation, I would recommend to input them in the cable page of the main software directly. Sure, thanks for the feedback. There have already been other customers who have requested this. But as we are redesigning the whole 3D environment from scratch right now, we probably won't update as much in the old version anymore. Kind regards, Martin
-

Probleme mit der Darstellung der 3D-Menüleiste
developer_mh replied to developer_mh's topic in PV*SOL
Hallo GF-RB, das sollte so nicht sein, zumindest sollte einer unserer Work-Arounds wenigstens in Teilen Linderung verschaffen, so dass man arbeiten kann. Habt ihr euch schon bei der Hotline gemeldet? Wenn nein, würde ich das mal empfehlen, die können das mit euch nochmal durchgehen. Gerade bei Full-HD (1920 x 1080) und 100% Scaling sollte es zu keinerlei Beeinträchtigung kommen. https://valentin-software.com/en/support/technical-support/ Beste Grüße, Martin -
Hi Alison Pereira While we do have this request (API) on our list, I am not sure when we can provide it. However, there is a way of getting to the simulation results of a project after you simulated and saved it. It involves some manual labour and you'll have to do it without our official support. But it is possible, no question. If you are interested, you can write a mail to our technical support team along with your customer number and the use case. https://valentin-software.com/en/support/technical-support/ Thanks and kind regards, Martin
-
Hi Peter, the grid usage can't be limited right now, I am afraid. But if you export the grid usage data as hourly or one-minute values, you can check wether the maximum power of your mains connection is exceeded. Do you refer to stand-alone systems? Could you explain your question perhaps with some examples? I am not sure if you refer to grid connected or stand-alone. If it is grid-connected, there is no error or "no calculation", even if the battery system is too small. If it is stand-alone, you really have to design the system carefully, so that PV and battery system together can cover the loads. But in this case there is no grid. Kind regards, Martin
-
Hi anees, thanks for the project file. Please send it as a private message in the future so that personal data is not made available to the public. The numbers in the project file differ a bit from the numbers of your screenshot. But from going through your project file I can suggest the following in order to make the numbers reproducible by hand: Set the start date of operation to the first day of a month, eg. June 01, 2023 This is because the years of the economic calculation start in the month of the date that you enter as start of operation. Module degradation to 0% (already done in your project) Set the inflation rate for the energy price to 0% Set the Interest on Capital to 0% Then you can calculate the resulting first year saving by hand: (direct own use - standby consumption of inverters) * 0.4 €/kWh You have to subtract the standby consumption of the inverters because this is energy you have to pay for after you operate the PV system Hope that helps, kind regards, Martin
-
Hallo Alex, vielen Dank für die Schilderung des Problems und die Lösung mit der atioglxx.dll. Darf ich fragen, von wo du die Dll heruntergeladen hast und in welcher Version? Das könnte für andere Kunden hilfreich sein. Beste Grüße, Martin
-
Hallo Projektierung_steidle, wenn man ein 3D-Objekt importieren möchte, empfehlen wir das obj-Format. Darüber hinaus findet sich eine Liste aller Formate in diesem pdf hier: https://www.valentin-software.com/wp-content/uploads/legacy-downloads/sonstiges/de/3d-recherche-rev-01.pdf Beste Grüße, Martin
-
Hi Manuel Klimek, I will forward this request to our database team, thanks for reporting. Kind regards, Martin
-
Hi Solarific, this feature is already on our list, and together with other storage releated features it is planned for one of the upcoming major releases. Kind regards, Martin
-
how to select properly, protection of PV systems in PVSol
developer_mh replied to glekaj's topic in PV*SOL
Hi Graniti, this kind of information can't be provided by us, I am afraid. It depends on the local requirements (i.e. what do national and local standards say). Usually you will have at least an over voltage protection device and a circuit breaker on the DC side between PV modules and inverter, as well as a circuit breaker on the AC side between inverter and counter. For larger systems you will also have a fuse for each string on the DC side. But it really depends on the system you plan and local requirements. Try to find an electrical engineering technician with experience of your local market and the common rules of PV system security. Kind regards, Martin -
Hi anees, most probably the difference comes from the module degradation that is already accounted for in the first year. Might also be due to some economic parameters such as interest rates, but this I would have to check. If you can provide a project file that would be helpful. Kind regards, Martin
-
Hi Anees, the "Energieertrag für EnEV" is something different. It is a special calculation for the German EnEV, Energieeinsparverordnung" and follows a predefined procedure. It is only necessary in Germany if you want to apply for special support programmes. https://help.valentin-software.com/pvsol/de/navigationsseiten/ergebnisse/energieertrag-fuer-enev/ Kind regards, Martin
- 1 reply
-
- 1
-

-
Hi Pieter Hamer, could you provide the project file, please? You can send it to me here in the forum as private message, thank you. Kind regards, Martin
-
Hi Rohith, this project also crashes on my machine when running the shading simulation. Although I can't say it for sure I'd guess that this is due to the number of vertices of the imported 3D model. Try to simplify the model and reduce the vertices in another software like Blender. Then re-import it into PV*SOL. Kind regards, Martin
-
Hi Vasilis, geht das Drag n Drop als solches nicht oder bleiben die Objekte rot, egal wohin man sie ziehen will? Viele Grüße, Martin
-
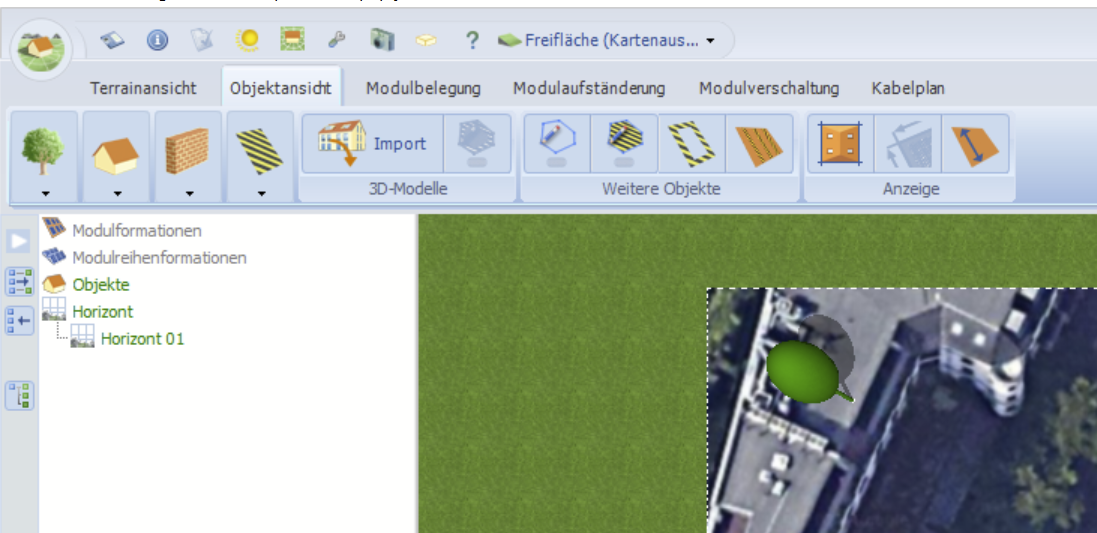
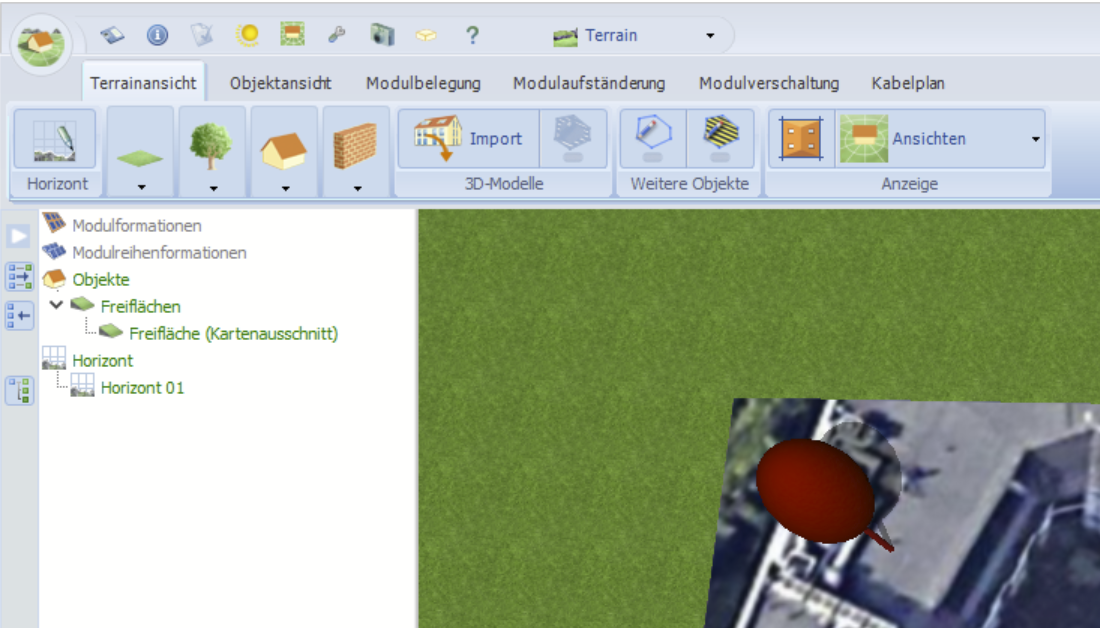
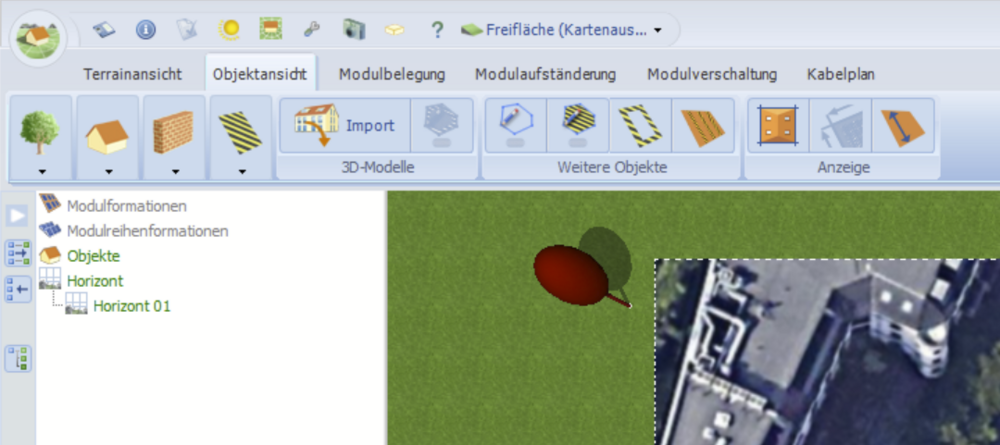
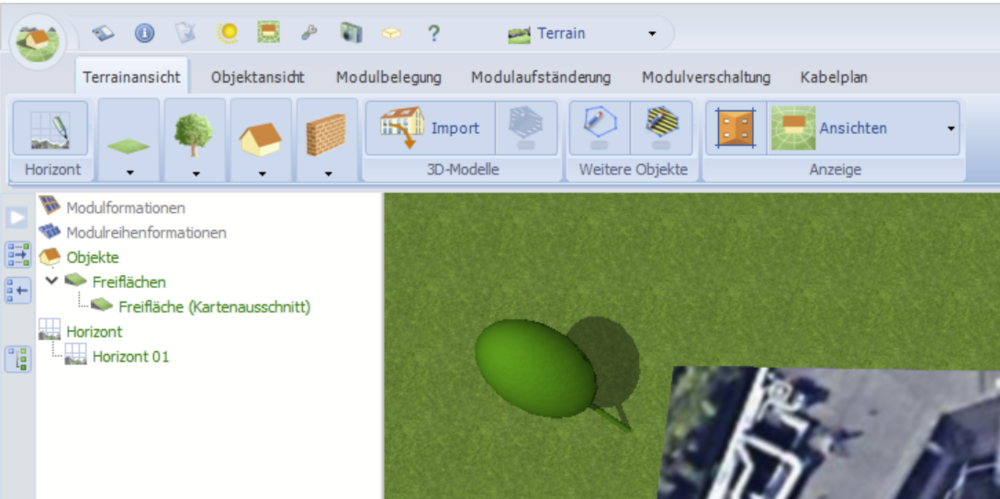
Hallo Vasilis, man kann die Objekte je nach Bearbeitungsmodus nur in bestimmte Bereiche ziehen. Wenn man eine 3D-Planung mit dem Kartenausschnitt startet (wovon ich aufgrund des Begriffes "Landkarte" mal ausgehe), können weitere Objekte nur in der Objektansicht darauf platziert werden. Ist man in der Terrain-Ansicht, können die Objekte nur auf das Terrain platziert werden, usw. Terrainansicht: Objektansicht: Ich hoffe, das hilft weiter. Beste Grüße, Martin


-
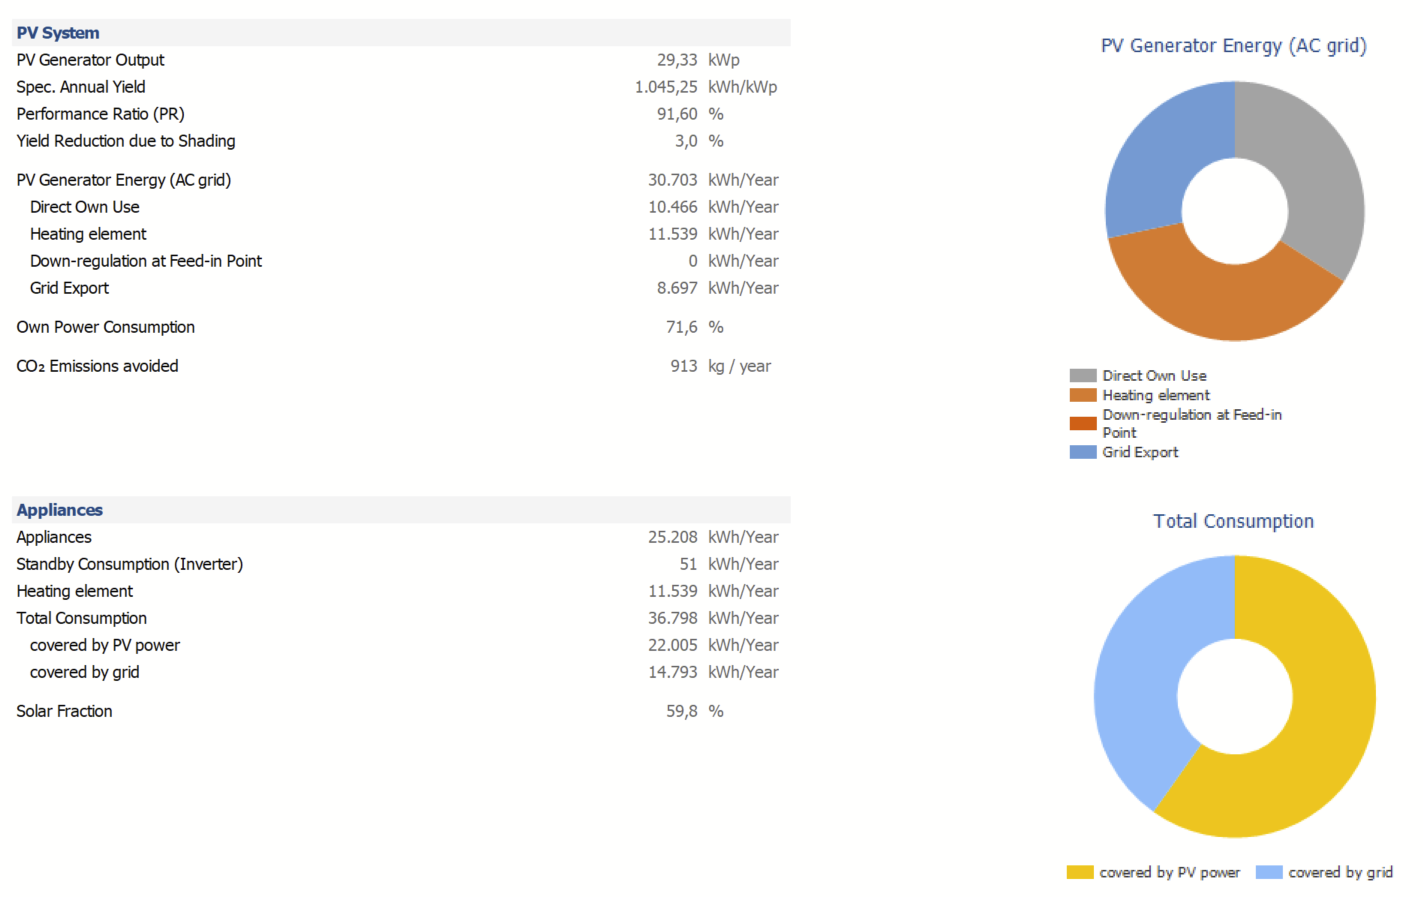
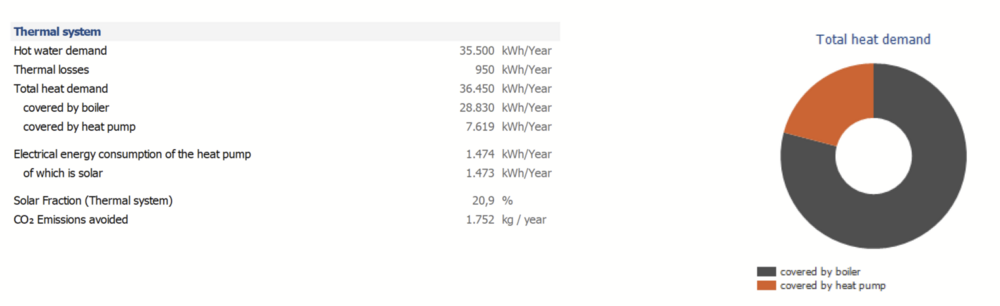
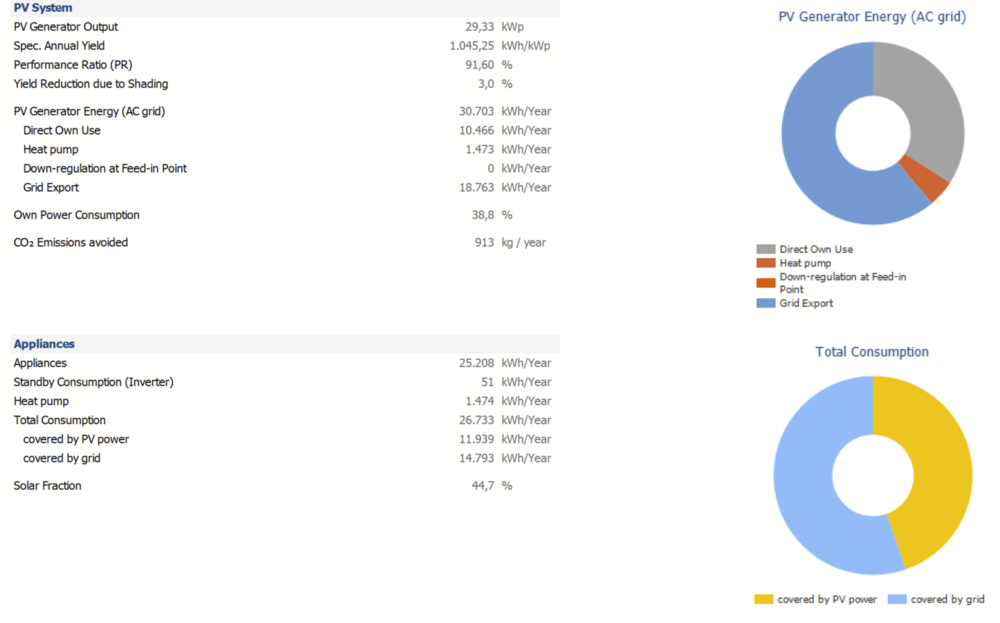
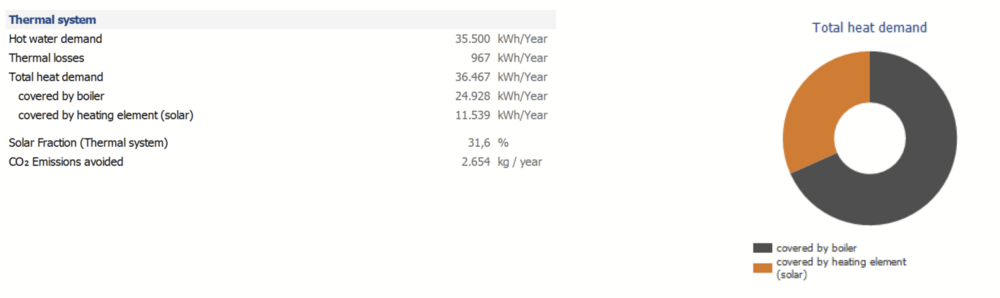
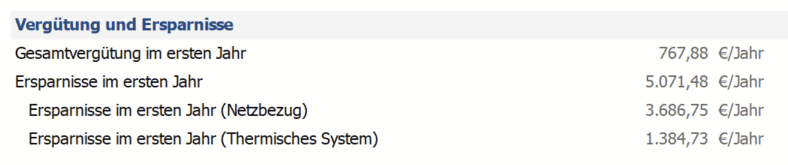
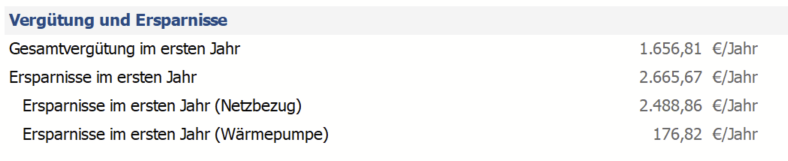
Hallo Petar, also, ich stelle mal die energetischen Ergebnisse direkt gegenüber. V1: V2: Es gibt also sowohl in elektrischer als auch in thermischer Hinsicht große Unterschiede bei beiden Systemen. In V1 kann sehr viel PV-Energie durch den Heizstab in thermische Energie umgesetzt werden (11539 kWh), der Kessel muss noch 24928 kWh beisteuern. In V2 werden nur 1473 kWh el. PV Energie von der Wärmepumpe abgenommen, die zu 7619 kWh thermisch werden. Daher müssen in diesem Fall noch 28830 kWh vom Kessel kommen. Wirtschaftlich sieht das Ganze dann so aus. Die Einspeisevergütung ist bei V1 geringer als bei V2, da weniger eingespeist wird. Dafür ist in V1 die finanzielle Ersparnis höher (jeweils im Vergleich zum gleichen System ohne PV-Anlage). V1: V2: Wahrscheinlich liegt hier der Kern der Fragestellung. Bei den beiden Projekten wird in der Wirtschaftlichkeitsbetrachtung darauf geschaut, wie sich das System im Vergleich zu einem identischen System ohne PV-Anlage verhält. Wenn ich es richtig sehe, geht es bei deinem Vergleich aber eher darum, ob V1 oder V2 im Vergleich zu einem System ohne PV und nur mit Gas-Kessel die bessere, weil finanziell interessantere Variante ist. Das geben die Ergebnisse in der Form nicht her, zumindest nicht ohne weitere manuelle Bearbeitung. Beste Grüße, Martin

-
Export von PV*Sol zu K2 Base aber falsche Adresse und Kundenname
developer_mh replied to Eduard J.'s topic in PV*SOL
Hallo Eduard J., ja, das ist bekannt, zumindest teilweise. K2 Base nutzt die Koordinaten des Klimadaten-Standortes von PV*SOL, um eine Adresse zu ermitteln, die dann z.B. bei der Berechnung der Lasten angezeigt wird. K2 weiß ebenfalls Bescheid, aber es kann sicherlich nicht schaden, wenn sich die User mit ihren Wünschen direkt an K2 wenden. Auf unsere Hilfe-Seiten stehen auch Kontakt-Möglichkeiten für K2 Base: https://help.valentin-software.com/pvsol/2023/de/navigationsseiten/3dplanung/montagesystem-schnittstelle/ Beste Grüße, Martin -
Hi Džiugas, kindly contact our technical support team along with your serial number and the WeTransfer link, thank you. https://valentin-software.com/en/support/technical-support/ Kind regards, Martin
-
Hi Esteban, I loaded the project file into my PV*SOL and it does simulate as it should. Then the report is generated as it should. Also if I change the battery system, everything works well. Could you provide your logfiles, please? You can find them here: C:\ProgramData\Valentin EnergieSoftware\log First, please reproduce the issue on your computer, then close PV*SOL and send us the file pvsolpremium.log from the above mentioned folder. You can send it here as a private message. Best regards, Martin