developer_mh
-
Posts
1,855 -
Joined
-
Last visited
-
Days Won
173
Everything posted by developer_mh
-
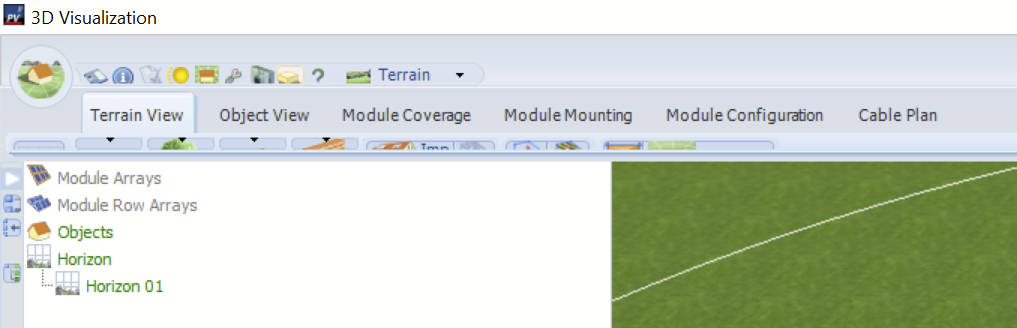
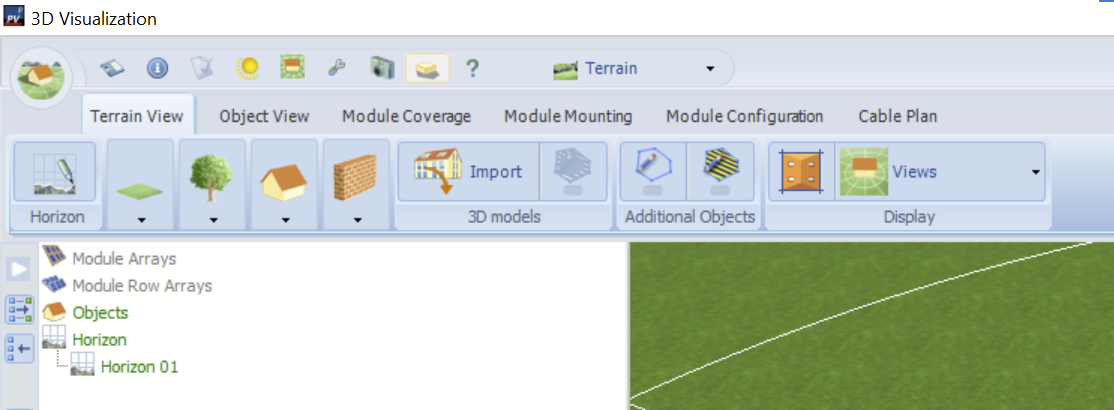
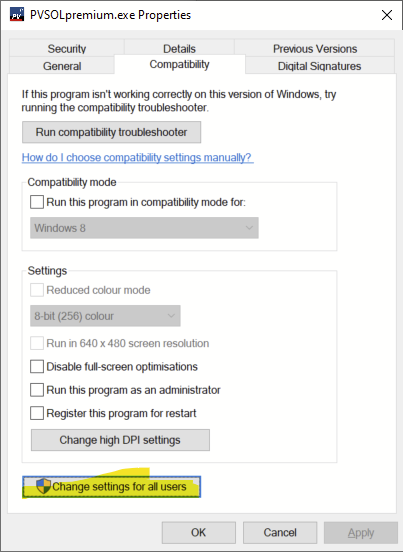
Dear users, during the last couple of years, every now and then, we had users reporting issues with the display of the menu bar in the 3D environment of PV*SOL. In this post we want to give clear instructions on how to mitigate this problem. Problem This is how the menu bar of the 3D visualization of PV*SOL should look like: But sometimes it looks like this (or even worse) Solution Close all instances of PV*SOL premium Locate the PVSOLpremium.exe (usually in C:\Program Files (x86)\Valentin EnergieSoftware\PVSOL premium 2023\) Right click on the exe, choose "Properties" Navigate to the tab "Compatibility" and click the button "Change high DPI settings" Uncheck this checkbox (no override): Click OK, on the previous window, select "Change settings for all users" (if you have that option) Click "Change high DPI settings" and then uncheck again (same dialog like before) Close all dialogs with "OK" Then restart PV*SOL premium and open the 3D visualization - it should look like it should We tested this on several machines, Win10 and Win11. Please be sure to follow the instructions closely in order to get the right behaviour. Addendum Sometimes, when you now open the 3D visualization of PV*SOL, you see a button bar that is too large. This is due to a former workaround that is not necessary anymore. Please follow these instructions to get it back to normal (be sure you have followed the instructions above before that!) Close all instances of PV*SOL premium Locate the PVSOL.ini file (usually here "C:\Users\USERNAME\Documents\Valentin EnergieSoftware\PVSOL premium 2023\PVSOL.ini") Open the file in a text editor, e.g. Notepadd++ Locate the line that says "<MainPagerWider>-1</MainPagerWider>" (near the end of the file) Change the -1 to 0 Save the file Then restart PV*SOL premium and open the 3D visualization - it should look like it should We really hope that this helps for all of you. If it doesn't help, we would be very interested in more details of your system. Just post below if the instructions helped or not. In case it didn't help I'd write a list of what we need to analyse the problem more in detail. Best wishes, kind regards, Martin


-
Hi Finn, if unsure, just select the "Standard low-light behaviour". Kind regards, Martin
-
Hi Kostas, which version of PV*SOL premium are you using? Could you send me your project file, please? Here in the forum as private message. Thanks and best regards, Martin
-
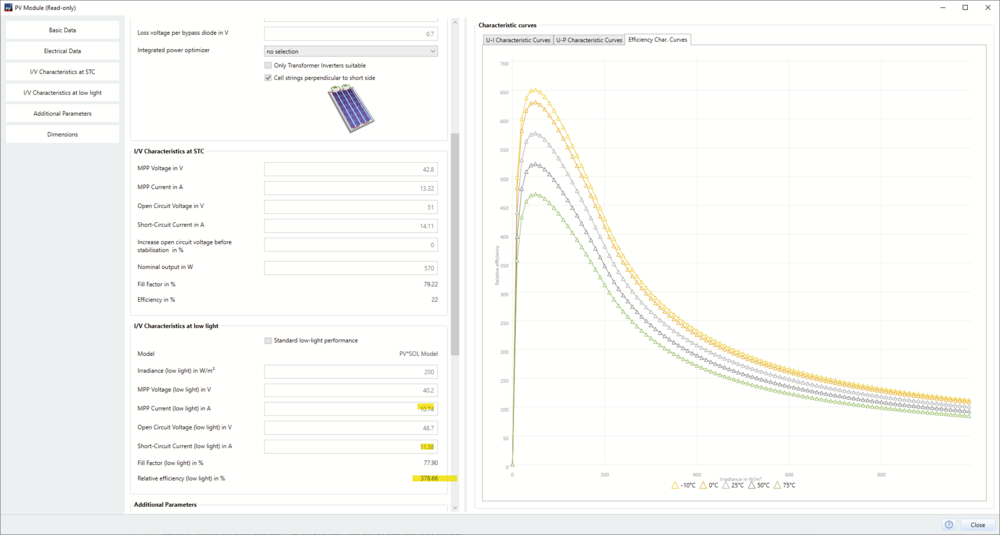
Hi Finn, the problem is the PV module "JW-HD144N-570" which was user created. It has wrong low light values: Please check the values again, then it should be fine. Kind regards, Martin
-
Hi Finn, a performance ratio of over 100% is physically impossible, you are correct Could you provide the project where this occurs? You can send it to me here in the forum as private message. Kind regards, Martin
-
Hi patrik k, thank you for the inuiry. I will forward this to our database team. Kind regards, Martin
-
Hi Codrin Somesan, this is a known bug and will be fixed in PV*SOL premium 2023 R4. In the meanwhile you can use the shortcut Ctrl+F5 as workaround. Hope that helps, kind regards, Martin
-
Hi Solar-engineering, could you give an example where the output is not like you expected? The best would be a project file illustrating the problem. Thank you, kind regards, Martin
-
Hi juhaina, it seems that your 3D model from sketchup has inverted normals on the blue objects. Please check them in Sketchup and try not to invert them. Also you could add a gap in the attica somewhere to help the shading algorithm avoiding errors. Kind regards, Martin

-
Hi Andrii2, the project report is already available in Ukrainian: Hope that helps, kind regards, and all the best for your country Martin

-
Hallo Sunny-RP, ein direkter Export der Datenbanken ist nicht möglich, nein. Man kann jedoch die Ausgabe der Datenblätter der im Projekt verwendeten Produkte (Module, Wechselrichter etc) im Projektbericht aktivieren. Den kann man ja als docx exportieren, und darüber kommt man gut an die Daten ran. Was auch geht, ist die direkte Nutzung unserer Online-Datenbank über die API: https://valentin-software.com/produkte/api/ Bei Interesse einfach an den dort angegebenen Kontakt wenden, danke. Viele Grüße, Martin
-
Hi Ellie, Yes, we plan to implement this functionality this year, but I can't give an exact date yet. As a first approach, the AC connection workaround works quite well, but as you mention, you have to be careful with the parameters. Another option would be to skip the shading calculation of your 3D project. Due to the mechanics of the underlying simulation algorithm, the DC connection problem only occurs when there are shadows in 3D. Kind regards, Martin
-
Hi RachelEnergy, what I meant was that if you export it as an svg, you can edit it with any vector based drawing software. Personally I find inkscape a very good choice, it is free and open source and very powerful. After editing, you can easily save it as pdf for example. Kind regards, Martin
-
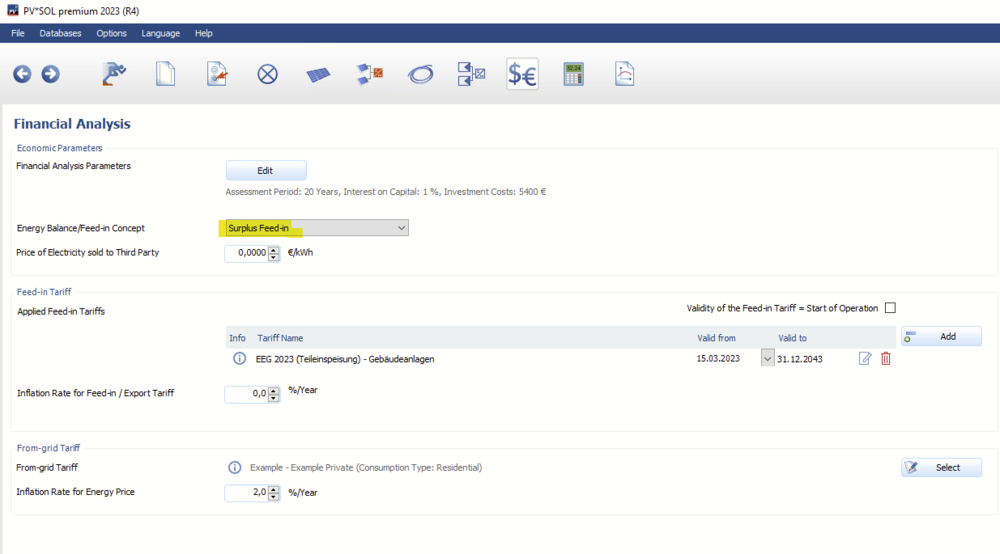
Hi Man, the diagrams that you mention are available if you choose "Surplus Feed-in" on the Economy page: If you choose Net-Metering, these diagrams are not available. Hope that helps, kind regards, Martin
-
Hi CodrinSomesan, for checking that we have the configuration check: There you can see if all voltage and current limits are not exceeded. (you can click on each tick mark and see more detail). Kind regards, Martin

-
Hi Codrin, thank you for clarifying your question. The number of strings in the configuration section is independent from the number of DC inputs of the inverter. When you connect two strings (=parallel strings) to two DC inputs on one tracker, they are combined inside the inverter. If you combine them outside of the inverter using whatever connector you want, you get the same results. If in PV*SOL you read 3 strings x 14 modules in series, it means that you have three parallel strings of 14 modules each. If you have two DC inputs per tracker and you want to connect three strings, you'll have to use at least one connector (like the Y connector shown above) outside of the inverter. But you are right, we could give a notice to the user that the total number of strings is exceeding the number of DC inputs. Thanks for pointing that out. Kind regards, Martin
-
Hi grlnat, the 180 kWp is the so called peak power, measured at Standard Test Conditions (STC). The conditions are 1000 W/m² irradiance, 25 °C module temperature and and air mass of 1.5 (but that is not important here). That means, if your modules receive 1000 W/m² of irradiance and have 25°C module temperature, they will output 180 kWp. Accordingly, if the irradiance is lower or higher, the output of the modules will be less or more that the 180 kWp. The irradiance varies greatly during the year and during day. And of course, clouds can have a very strog influence on the irradiance. Clouds can even reflect parts of the sun rays, leading to so called irradiance enhancements. In those situations, the irradiance values can go far beyond their typical values. So, in a usual continental climate it is common to have irradiance values from 0 to 1300 W/m². That is of course, if you look at the values in one-minute resolution. https://help.valentin-software.com/pvsol/en/calculation/irradiation/ Hope that helps, kind regards, Martin
-

soporte de modulos (drag and drop not working in 3D)
developer_mh replied to Alejo's topic in PV*SOL
Hi Alejo, here is the translation of your question from deepl.com: There are several users with Windows 11 that have reported that issue. It might have something to do with a specific Windows Update, but so far we have no idea what exactly is causing the issue. This is really odd. You have a working piece of software, then Windows Update comes and only one particular part of the the software stops working. We have not had that kind of bug before, but we are continuing to investigate it. In the meantime you can still work with the "Fill Area" tool in order to get the modules on the roof: Hope that helps, kind regards, Martin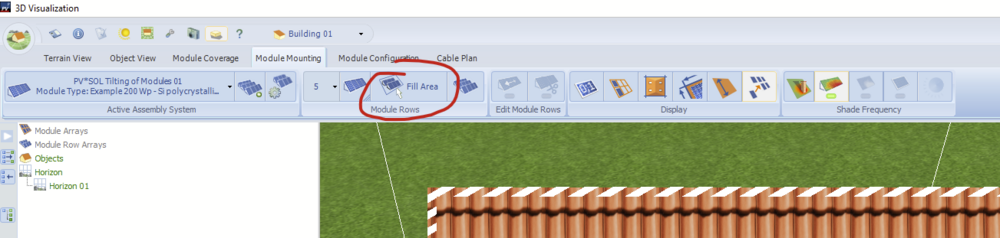
-
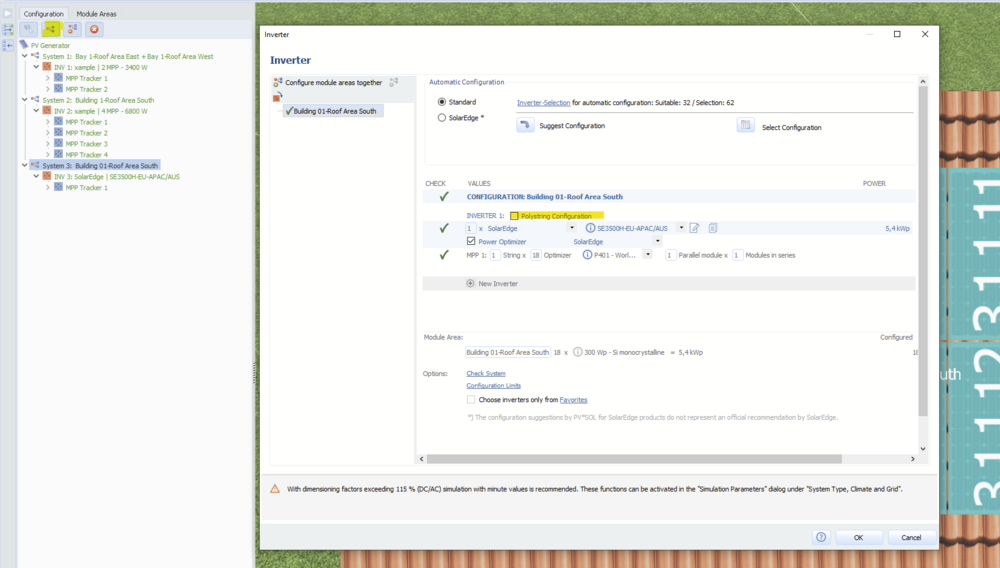
Hi Kitty, this is correct, the cable plan is currently disabled for polystring (multiple module areas on one MPP tracker). For SolarEdge configurations, the polystring option is enabled by default. If you only have one module area you can uncheck that option. Then you can use the cable plan feature: Hope that helps, kind regards, Martin
-
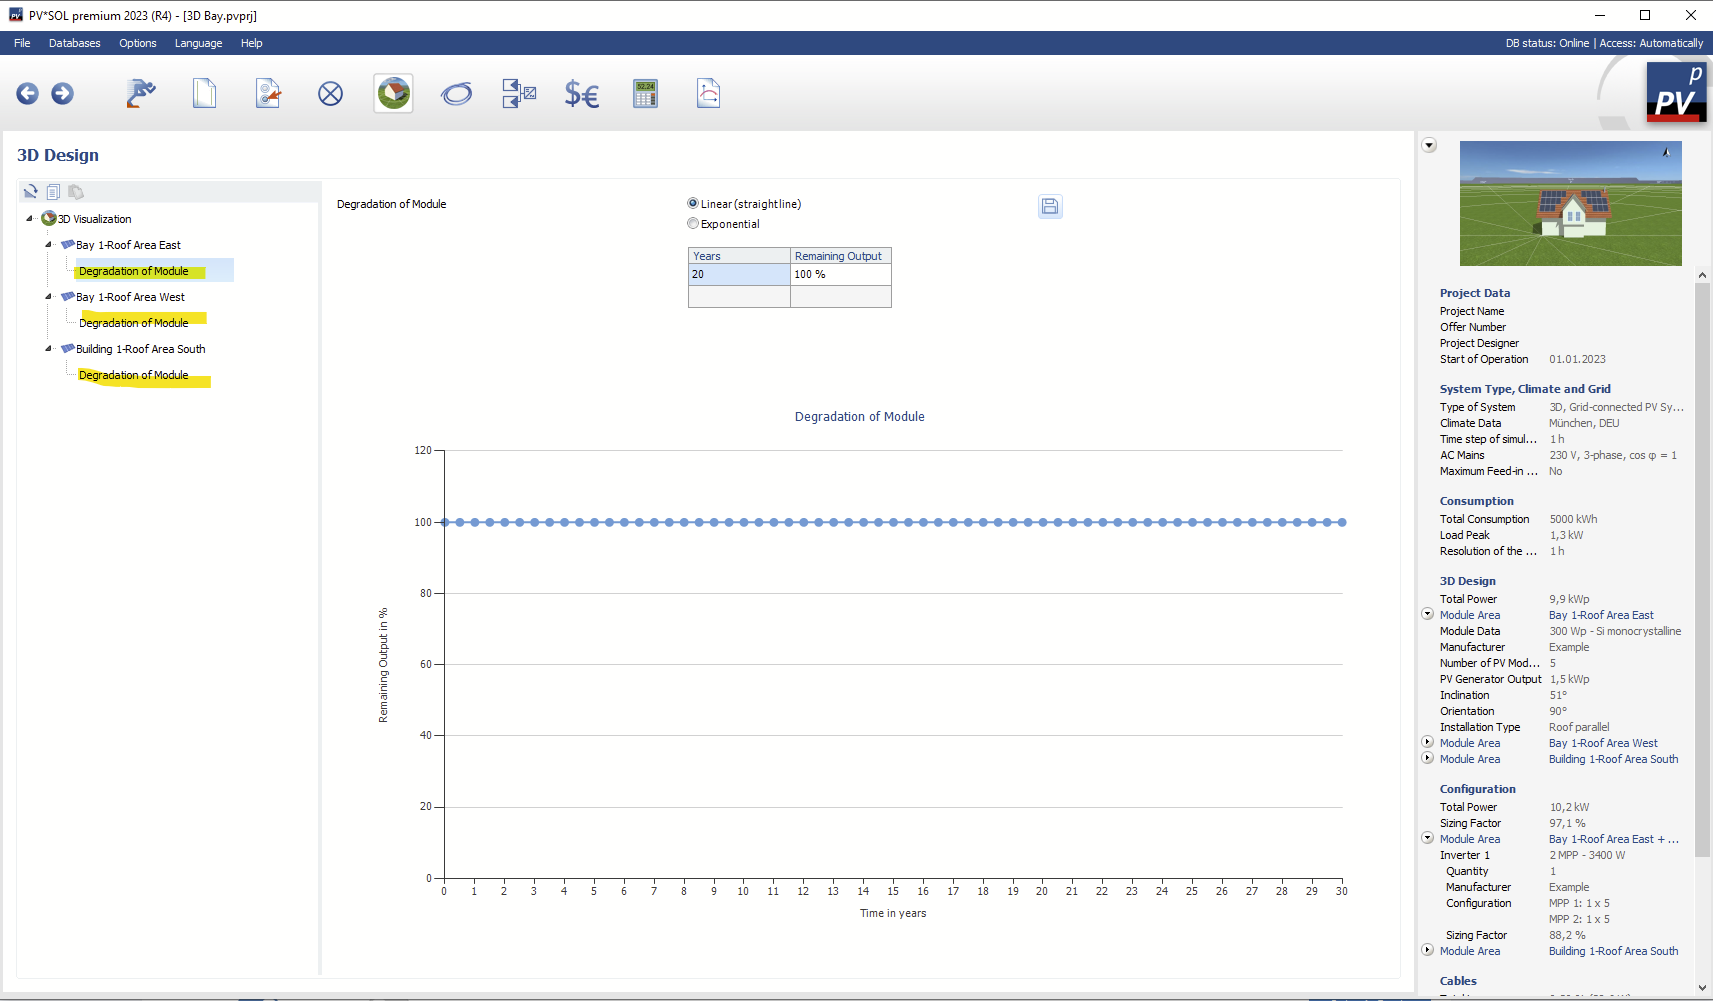
Hi Alain, if you have a 3d project, the module degradation is accessible here: Kind regards, Martin

-
Wechselrichter Fronius Symo Prüfung Eingangsstrom
developer_mh replied to bene-solar's topic in PV*SOL
Hallo bene-solar, das ist richtig, die Daten für den Symo 17.5 scheinen nicht aktuell zu sein. Ich werde das unserem Datenbank-Team weiterleiten, vielen Dank fürs Melden. Nein, das läuft etwas anders. Mehr dazu hier: https://help.valentin-software.com/pvsol/de/navigationsseiten/wechselrichter/anlagenpruefung/ Beste Grüße, Martin -
Hi Alain, yes, the module degradation can be edited by the user: https://help.valentin-software.com/pvsol/en/pages/pv-modules/module-degradation/ Kind regards, Martin
-
Hallo Jons, könntest du mir das Projekt mal schicken, bitte? Gerne hier im Forum als private Nachricht, danke. Beste Grüße, Martin
-
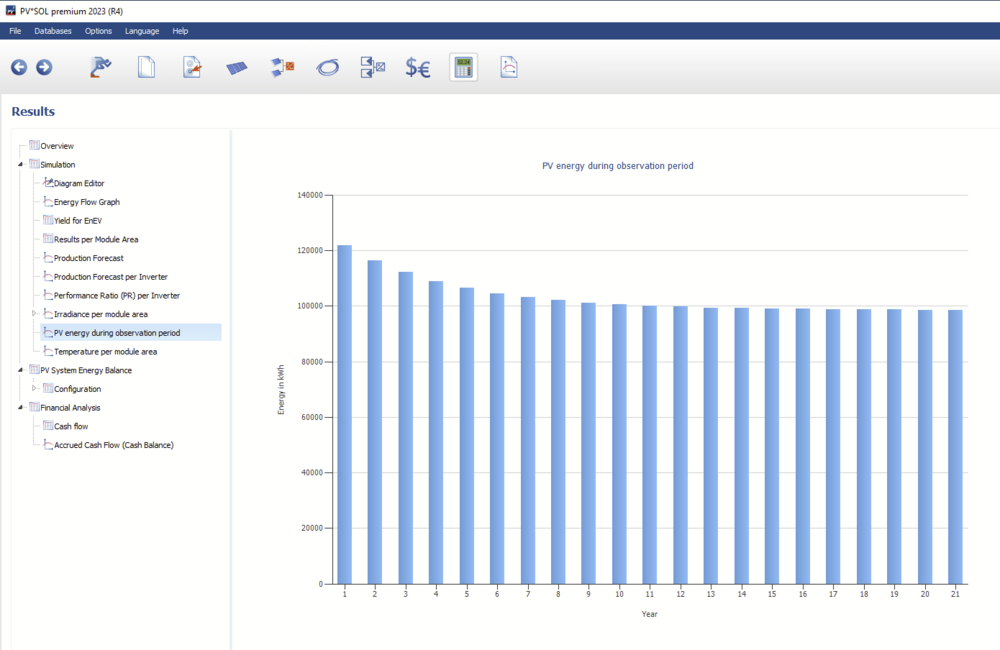
Hi brownb, you can see a chart of the total generation per year here: You can also export the numbers by right clicking on the chart. Hope that helps, kind regards, Martin
-
Hi Alain, the module ageing losses (=degradation) are taken into account in the economic calculation only. The energy yield simulation is conducted for the first year only, without module ageing losses. You can refer to the energy balance after the simulation in order to see which losses are accounted for: https://help.valentin-software.com/pvsol/en/pages/results/energy-balance/ Hope that helps, kind regards, Martin