-
Posts
1,316 -
Joined
-
Last visited
-
Days Won
83
Everything posted by developer_fw
-
Hello RaW, welcome to the forum! I cannot evaluate the data regarding its quality but having one source of truth for the whole UK containing all postcode districts seems very nice! On the page System Type, Climate and Grid there is a section Climate Date where you can find MeteoSyn: Within the window Create climate data for a new location it is pretty straightforward to transfer the values from the .xls file: After putting the values for Lat;Lon and pressing Start, the map updates. Zoom to your location and set a new marker by clicking. In the section Data you choose Measurement Data and put your values per month for Radiation and Temperature. Or did you ask for a way to import all climate data locations at once? Kind regards, Frederik
-
Hello anees, thank you for your request. Could you send a project file via private message here in the forum so we can have a look into it? Kind regards, Frederik
-
Hi Anthony_Rossier, your screenshot only gives a short insight into the project report. Could you send me the project file via private message here in the forum so I can have a look into it? It is hard to tell what the problem is. Kind regards, Frederik
-
Hello Kapil, the hotline told me you already did have contact with them? Kind regards, Frederik
- 2 replies
-
- internal rate of return
- kapital
-
(and 2 more)
Tagged with:
-
Hi Tony, this is not possible with net-metering. But maybe it is an option for you to export the simulation results and use the columns Grid Feed-in and Energy from Grid to calculate this balance by yourself? Kind regards, Frederik
-

Still the same problem for large PV installations
developer_fw replied to David Heneš's topic in PV*SOL
Dear David Heneš, dear customers, first of all thank you for your valuable input, which is of utmost importance for us. Might you be so kind to send me the project file via private message here in the forum so we can have a look into it and probably forward it to our technical support for help? Rest assured that your messages are not unheard. We are a small team and we do try to further improve the user experience of PV*SOL, one step at a time. As far as the 3D editor is concerned: Unfortunately, our hands are tied in many aspects, which is why we are working intensely on a new 3D environment. I will forward your messages to our 3D team leader. Yesterday I already talked to him regarding our known problems trying to to identify measures that can be implemented quickly. We are currently recruiting more developers to cope with the situation. We all do hope this progress takes off as expected. I don't want to be that guy but at the moment, all I can do is ask for patience. Kind regards, Frederik -
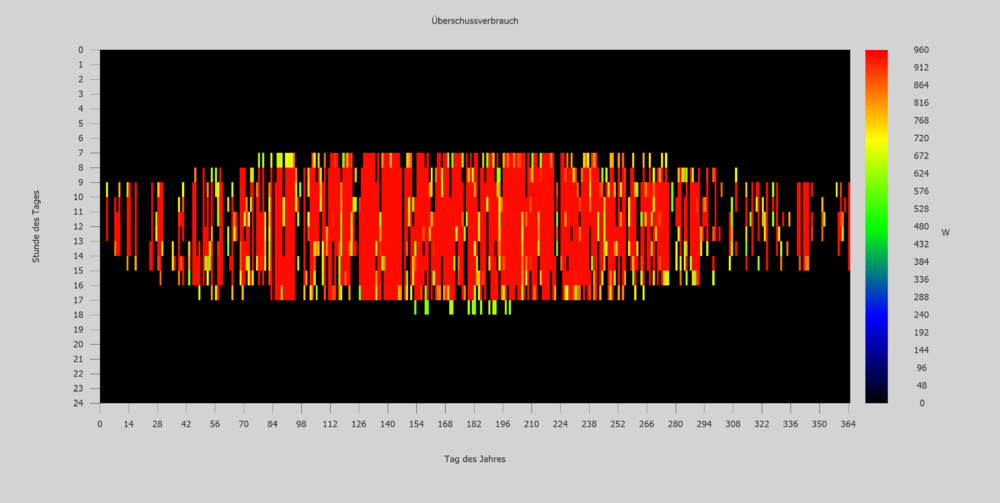
Hallo Ilona Dickschas, könntest Du noch weitere Infos dazu geben? Wenn ich einen Überschussverbrauch dynamisch zwischen 600...950W einstelle, kann die Funktionsweise mit dem Carpetplot nachvollzogen werden: Welches Verhalten soll stattdessen statt finden? Beste Grüße, Frederik
-
Hallo Ilona Dickschas, leider kann ich dazu noch keinen genauen Terminplan nennen. Beste Grüße, Frederik
-

Keine "Kabelknoten" im Kabelplan wenn Option "Polystring" aktiv
developer_fw replied to SMARTechSolar's topic in PV*SOL
Hallo SMARTechSolar, das ist leider korrekt, dass das nicht geht. Das ist auch richtig, leider ist das historisch so gewachsen. Viele Grüße, Frederik -
Hallo StefanM, Korrekt. Graphisch dargestellt ist die Summe über die Monatswerte. Nein. An dieser Stelle dient die graphische Darstellung als grobe Übersicht. Im Treeview links findet sich der Diagrammeditor. Dort können die Datenreihen höher aufgelöst betrachtet werden. Viele Grüße, Frederik
-

Fronius and Victron AC Coupling with BYD LVS Battery
developer_fw replied to StefanTM's topic in PV*SOL
Hi StefanTM, at the moment it is not possible to configure a battery system with different batteries of several manufacturers. Kind regards, Frederik -
Hallo MrBlonde81, wenn ich das Beispielprojekt Battery System simuliere und anschließend auf der Seite Anlagenart, Klima und Netz den Systemtyp ändere, sodass kein Batteriespeicher mit simuliert wird, ändern sich definitiv die Angaben bei der Wirtschaftlichkeit. Könntest Du die Projekte anhängen, die Du verglichen hast, damit wir das nachvollziehen können? Das kommt immer stark darauf an, was in ein neues Release mit aufgenommen werden kann oder muss. Im Schnitt alle anderthalb bis zwei Monate. Viele Grüße, Frederik
-
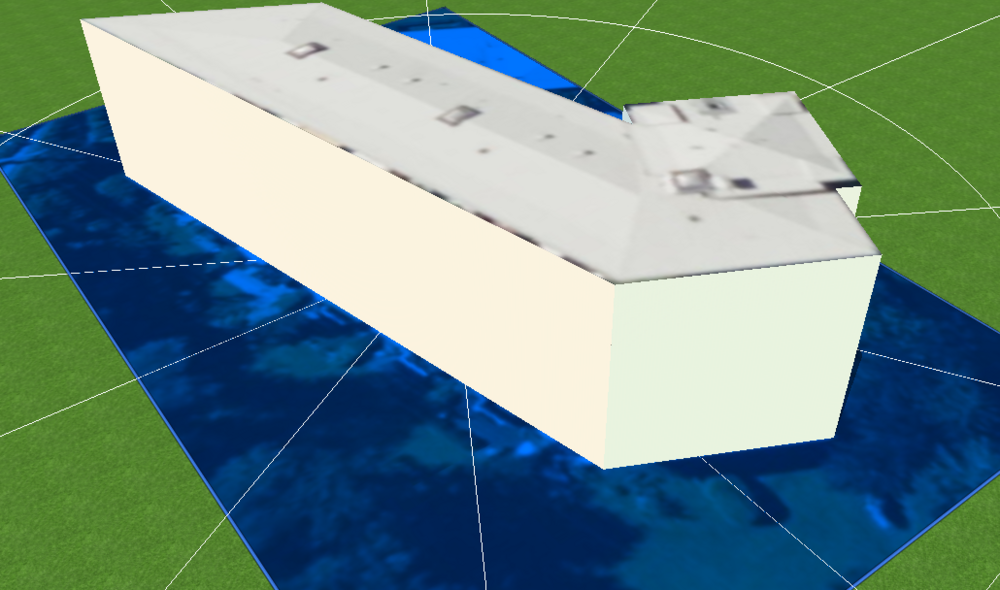
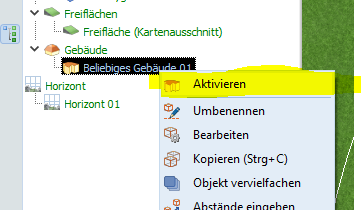
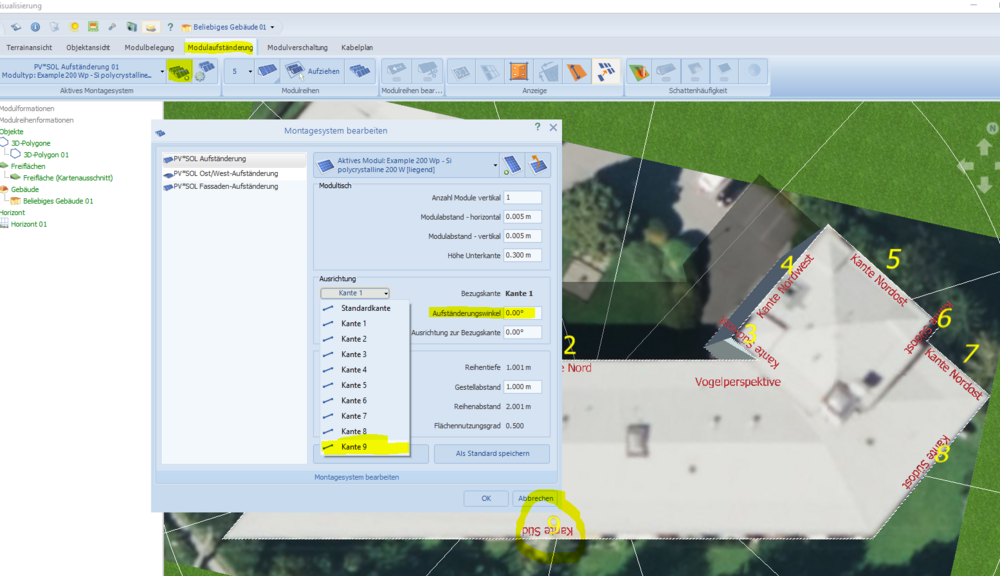
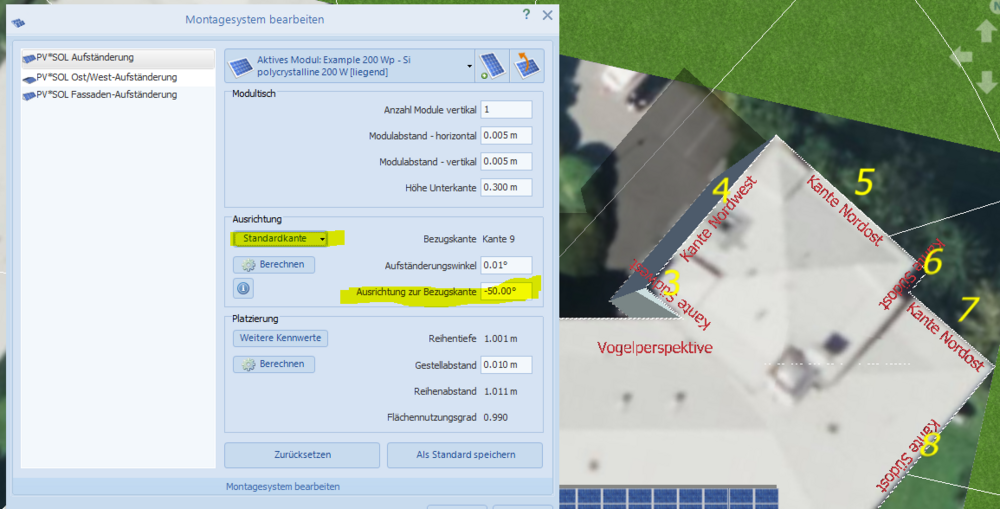
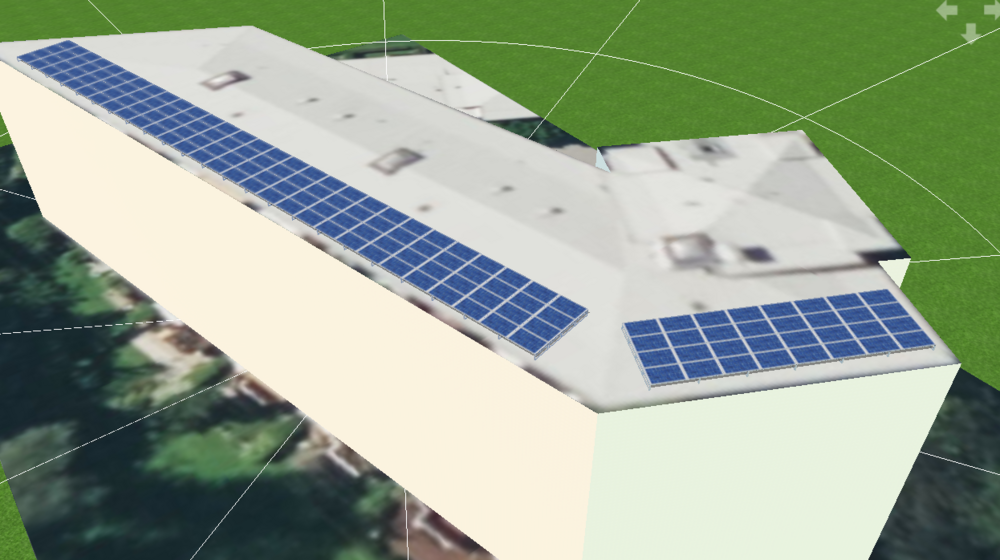
Hallo Dr.Who, willkommen im Forum! Nach dem Extrudieren eines Gebäudes anhand eines Polygons kann das Gebäude links im Treeview über einen Rechtsklick aktiviert werden: Anschließend können unter Modulaufständerung verschiedene Montagesysteme mit mehreren Bezugskanten angelegt werden, in folgendem Screenshot für die Kante 9 an der Südseite des Gebäudes: Das zweite Montagesystem richten wir nun im Winkel zur Standardkante aus und können es dann entsprechend an der anderen Kante aufziehen: Ich hoffe, das hilft weiter! Beste Grüße, Frederik
-

setting up PV*Sol for distibution through Microsoft Intune.
developer_fw replied to Admincs's topic in PV*SOL
Hello Big Parker, sorry for coming back to you this late. Is there any output when using the installer in non passive mode? We do not have such an installer, but I can contact the company who programmed PhotoPlan for further information. Kind regards, Frederik- 11 replies
-
- unattended installation
- software distribution
- (and 2 more)
-
Hello Esteban, in your case for an offgrid system: We cannot simulate a DC system in a stand-alone system type. This always must be an AC system in PV*SOL, it is historically conditioned. However, you can also simulate a grid-connected system with your required components, set the maximum feed-in power clipping to 0% and then take the coverage by the grid as the part which has to be provided by a possible generator. I know this might not be a satisfying answer, but at least you can use the components you do want to use for your system. If you have further questions, feel free to ask! Kind regards, Frederik
- 1 reply
-
- 1
-

-
Hi Go green BG, I guess you are looking for the Polystring Configuration. Have a look into our online help: https://help.valentin-software.com/pvsol/2022/en/pages/inverters/polystring-connection/ If you have further questions, feel free to ask. Kind regards, Frederik
-
Hi Venkatesh, generally you are right of course. The north side is more shaded due to its geometrical arrangement. The shade frequency in 3D only shows the reduction of direct irradiation for the whole year. Since the module area on the north side is receiving almost no direct share, there is nothing to display. I concur that this can be misleading. Kind regards, Frederik
- 3 replies
-
- 1
-

-
- shading frequency
- direct irradiation
-
(and 1 more)
Tagged with:
-

Change Default Font - Export Presentation in Word
developer_fw replied to RachelEnergy's topic in PV*SOL
Hello RachelEnergy, No. When we introduced the new project report a few years ago, we thought of offering individual document templates. I will bring this topic into our discussions but cannot promise its implementation. Kind regards, Frederik -
Hello spencerskinner, at the moment this system type is not available. We plan to offer this in the future. Kind regards, Frederik
-
Hello Venkatesh, shading below 0.1% is not displayed. I assume you want to display 0.0% values on all modules to show the absence of direct shading? Unfortunately this is not possible. The absence of displayed values means 0.0%. Kind regards, Frederik
- 3 replies
-
- shading frequency
- direct irradiation
-
(and 1 more)
Tagged with:
-

Importing 3d model from PIX4D- Without color
developer_fw replied to Jaka-JB Energy's topic in PV*SOL
Hello Please Help, I must admit that I do not have a link to such a tutorial by PIX4D. Regarding the import of 3D models it is best to get help from our support: https://valentin-software.com/en/support/technical-support/ Kind regards, Frederik -
Hello Mark Culpin, welcome to the forum. Yes, this is possible with PV*SOL in 2D and 3D. Do you have a specific use case or was this a general question? Kind regards, Frederik
-
Hello anees, in our online help there is a section describing the import of measured data. Look out for Import load profile: https://help.valentin-software.com/pvsol/2022/en/pages/consumption/#load-profiles--individual-appliances Kind regards, Frederik
-

Add norgeskart.no to the list of map providers
developer_fw replied to Mircea Balatescu's topic in PV*SOL
Hello Mircea Balatescu, thank you for your input. I forwarded your request to our responsible developer. Kind regards, Frederik


