Jordn
-
Posts
42 -
Joined
-
Last visited
-
Days Won
9
Everything posted by Jordn
-
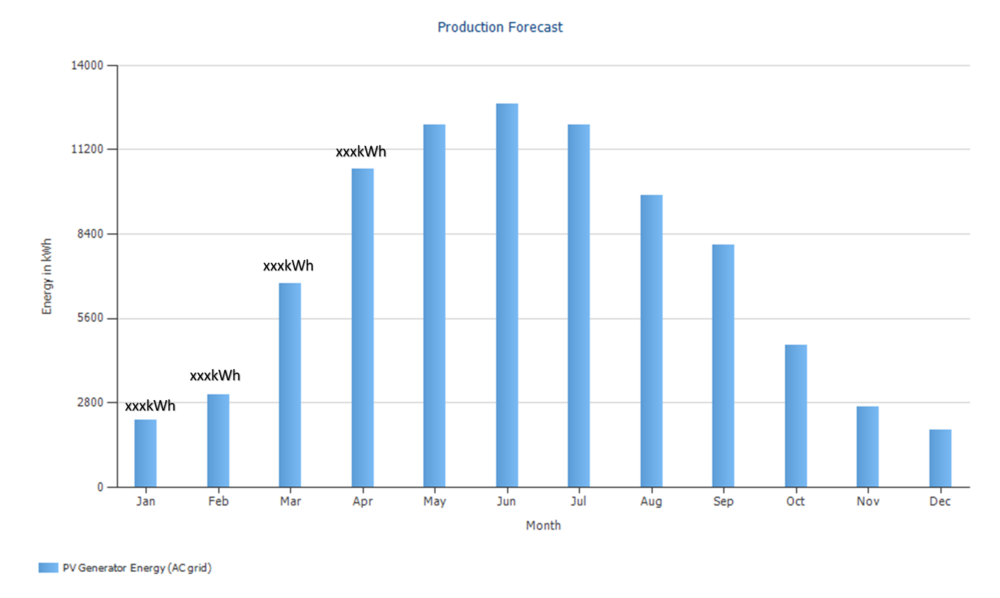
Is there a way in PVSol to detail the monthly production forecast values? For example, in January there will be xxxkWh production, in Febraury there will be xxxkWh production. Something like the image below, or a auto-made table with the values allready populated? Thank you in advance!
-
Would be great for the Production Forecast graph to show specific kWh values each month. For example:

-
If I had this problem, I'd copy and edit the inverter characteristics in the inverter settings, to the desired string makeup known as compatible, check the system configures to all green ticks, then confirm the configuration with the Fronius designer https://creator.fronius.com/
- 1 reply
-
- 1
-

-
I've experienced this too, though more often than not, switching to the other options available; Bing map, Bing hybrid map or Google Hybrid map is magic, and works well
-
Thank you @developer_fwany updates on this please? @developer_mh Is there a proven method to find the golidlocks system size using HHD data?
-
Thank you for your reply!! I'll try it out - I'll export the results to a spreadsheet, and see what happens between using 00:00 or 00:30 as the first data in the imported dataset. Thanks again!!
-
When importing a load profile from measured values, with a time interval of 30 mins, at which time should the first data be imported? For example: should the first data value be relevant to 00:00 or 00:30 ? Thank you in advance! Yours, Jordan
-
Hi Jimmy, Yep no problem, sent a message to you!
-
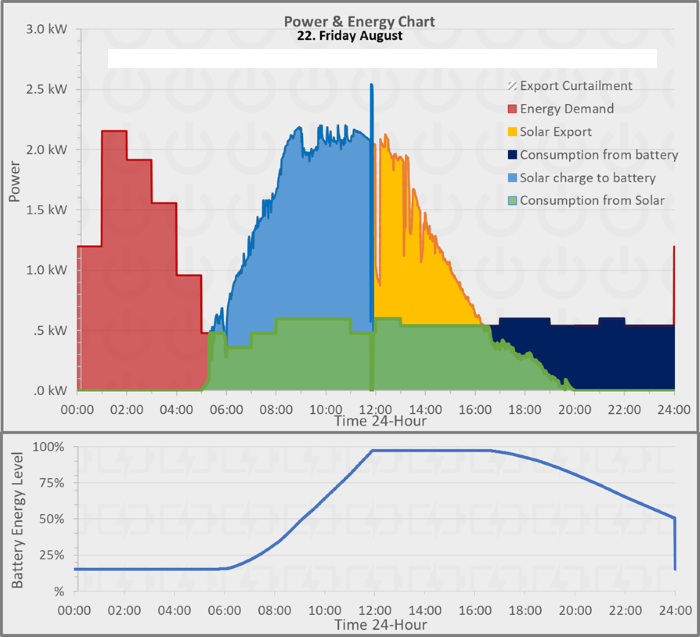
Hello PVSol community & solar PV designers, You're welcome to request a spreadsheet that visualises the forecast data exported from PVSol, example results below, from me via Linkedin - just fire me a message. I have personally created it, so happy to share. It's a long time coming, I created this because I feel the PVSol diagram editor doesn't meet what I look for in a forecast illustration. Most of all, I think PVSol is missing something that explains the forecast day-to-day life of the solar PV system (without the vertical axes changing with the day too). This spreadsheet creates graphs that illustrate forecasted: energy consumption, solar generation, solar export, battery charge, battery discharge, energy curtailment. Per day, and you can click a scrollbar to scroll through the days of the year. The spreadsheet only works with PVSol exported data, either hourly and minute data. Without amending the spreadsheet (which otherwise is easy), it would work up to 3 inverters, so up to 450kWp? Minute interval datasets can reach 500MB so you'll need a good computer. Comments/Criticism to the spreadsheet welcome! No doubt something like this will be integrated into future versions of PVSol. Yours, Jordan
-
Classic program restart fixed the issue actually
-
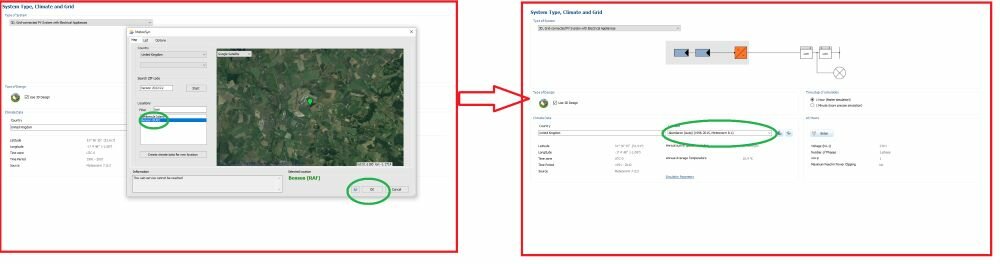
Hi there! I've noticed there's an unusual bug in Version 2022 R2 when selecting a Climate Data location. When selecting a location in the UK, for example, BENSON (RAF), and the location pinpointer is green (the location has been selected etc etc). After pressing OK, the Location is set as Aberdaron. This also happens when selecting a location from the Location drop down menu. Not a massive fan of using Aberdaron climate data. Any chance this can be clarified/amended please? Yours, Jordan
-
Hi Jimmy, nice work! I can imagine these illustrations are most needed in investor/board meetings and for public relations too. Capturing drone images, processing them into 3d models and using them in PVSol forecasts, that is world class!! I can imagine as the 3D models are already made, they can be imported into software like Lumion to make high resolution images/motions, in an effort to visualise the project at a less virtual level. For example, I've noticed someone's portfolio to visualise solar parks, as close as you can get to a real picture using software like Lumion etc. Best of luck! Yours, Jordan
-
I work with PVSol most days, so for me it's entertaining to see PVSol hitting the headlines, or atleast, a PVSol screenshot sneaking into the news : https://www.bbc.co.uk/news/uk-england-beds-bucks-herts-58550656

- 1 reply
-
- 1
-

-
thank you!
-
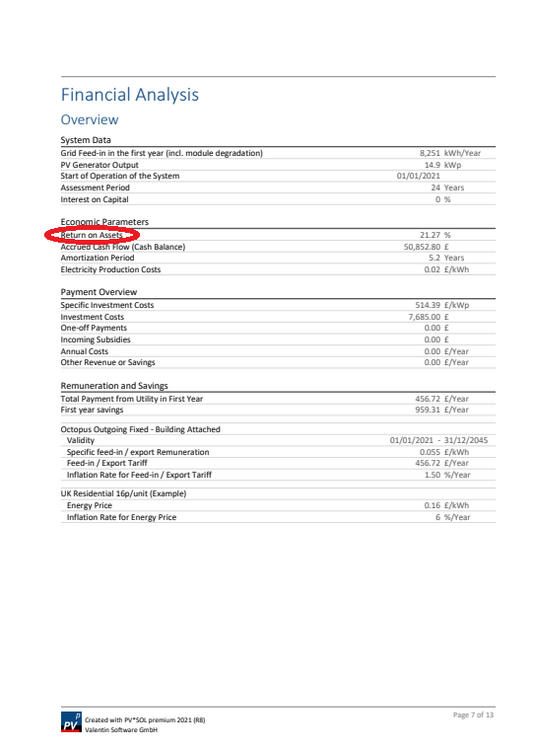
Hi Martin @developer_mh Just a clarification please, in the Presentation Report: Financial Analysis, Overview, Economic Parameters....... I'm not a Jedi on the naming of financial terms, forgive me if I'm wrong, but the naming of "Return on Assets" in the report, because this parameter is calculated similar to the IRR method in excel - shouldn't it be referred to as "IRR - Internal Rate of Return"? Yours, Jordan
-
I'm looking at a design similar to this, in an ongrid case where Victron MPPT chargers feed into Victron Quattro battery chargers. I've taken a look at the information available online for the Victron MPPT chargers and Victron Quattro battery chargers, though their specifications are missing plenty of information that's required by PVSol to complete a configuration. Is it possible to simulate Victron products in PVSol at all?
-
Hi Martin, thank you for the response! Yep that solution works, thanks again! Cheers! Jordan
-
Hi there, I've run into an issue with creating a load profile from measured values. The measured values are half hourly data, kWh, every day, year round, starting from 1st Jan until 31st Dec 2020. The year is a leap year. The HHD data is 17,568 values, PVSol expects the file to import 17,568 values, though after import is successful only 17,520 values are realised. As such, the total annual energy requirement value in PVSol is less than expected. How can this issue be solved please? Thank you in advance! Yours, Jordan HDD.csv
-
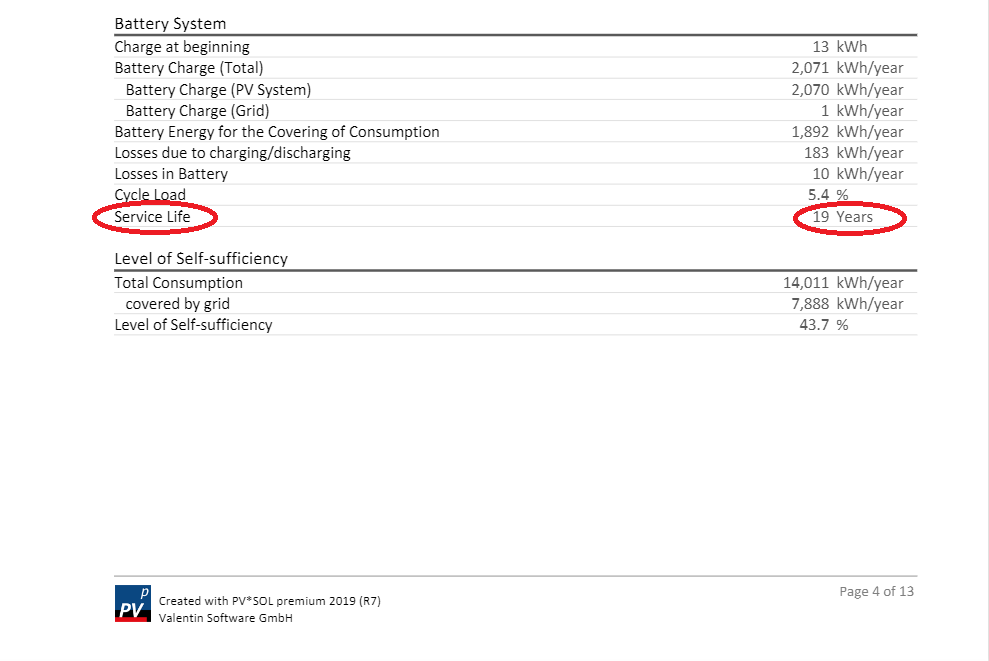
Hi there, quick clarification questions please, there is a figure in the PV Sol report for Battery System - Service Life. It's expressed in years. At what point is the batteries service considered to be over? For example in the attachment, what influences this batteries service life to be 19 years? Thank you!
-
Hello everyone, I'd like to talk about optimising solar pv system sizes for commercial scale projects. When there is 30min interval consumption data, and information on constraints such as; available area and export limits - planning the right balance between system size and financial payback/ROI can be a slow and iterative process. The way I see optimising solar pv system sizes for commercial scale projects is by making simulation, after simulation, after simulation of different system sizes in an effort to arrive at the golden system size. I was wondering if there are any methods via PVSol, or external to PVSol, that can speed up the process of arriving at the golden system size? I guess this begs to ask what makes a golden system size? In this case, the projects are commercial financially-single-minded projects, I would suggest optimal payback/ROI would be the measure...
-
Have both projects been through the simulation? For example, has the system with the missing info been paired with an inverter yet, and then simulated? I think you have to configure the system, and then simulate it, to make this comparison.
-
Hi everyone, quick question please, is it possible for a solar panel to have an IAM of 100% ? For context, the SunPower E20 327W commercial panel is listed within the PVSol database as IAM 100%. I understand this is specified by the manufacturer, though I'd like to double check this value, using information available on the web? For example, is there a specific place on the web to search for this IAM value, for double checking reasons? Thank you in advance, Jordan
-
Hi there ? it seems like PV Sol 2020 cannot open PV Sol 2021 files. Yours, Jordan
-
Hi Oliver, you can record screens with Powerpoint, otherwise I use FlashBack screen recorder.