


Jordn
-
Posts
42 -
Joined
-
Last visited
-
Days Won
9
Everything posted by Jordn
-
Hi ? I'm trying to figure out how; in the cashflow table, the Feed-in / Export Tariff value & Electricity Savings values are calculated please? I checked the help site but I don't think the page covers this; https://help.valentin-software.com/pvsol/2020/calculation/financial-analysis/ As a back-story; I'm trying to replicate the PV Sol values just out of interest and because we hand this information to customers so best to understand it completely, although I'm not the best at maths. I'm about £1.00-£15.00 out on the first year. I've attached a link to the file I'm using to try and replicate the PV Sol values below. I've highlighted the cells I want to match in Purple, they are in the 'Year' tab and 'PV Cashflow data' tab. It's possible my formulas are using the wrong data column in the .csv file - there are so many similar columns. Or there is something else I don't exactly know, but there is only so much digging before I ask for advice. Thank you! https://cornwallsuperhomes-my.sharepoint.com/:x:/g/personal/jordan_nakedsolar_co_uk/EVT48ZF4P_xHskgosU4KJIgBBAtYPF7JbLUJYEbeuRZpeA?e=exQ7aI
-
One for the wishlist - an ability to model immersion diverters within the simulations please.
-
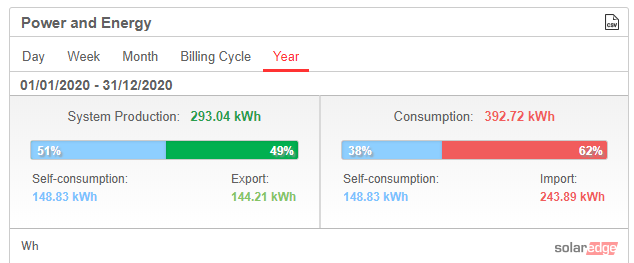
Hello there This is just something we notice everytime we export the PV Sol presentation. It's a nice to have however not necessary. We issue the PV Sol report to all our customers and there are a few items that don't need on the report. For example; we like the Project Overview, yet we don't need the schematic diagram. We like the financial analysis, yet don't need the Electricity Cost Trend diagram. Neither the Schematic diagram or the Electricity Cost Trend figure are items that can be unticked in the Presentation Options. It would be nice to opt out of these diagrams please. Also another one please, the PV Sol report can allready explain relationships of self-consumption, import and export. However I think there is a missing nice illustration to tell the story in a more digestible way. For example, I like the way the SolarEdge monitoring portal illustrates annual values in this way. It would be great to provide customers an illustration of annual values in the same way as shown below, in a PV Sol report.
-
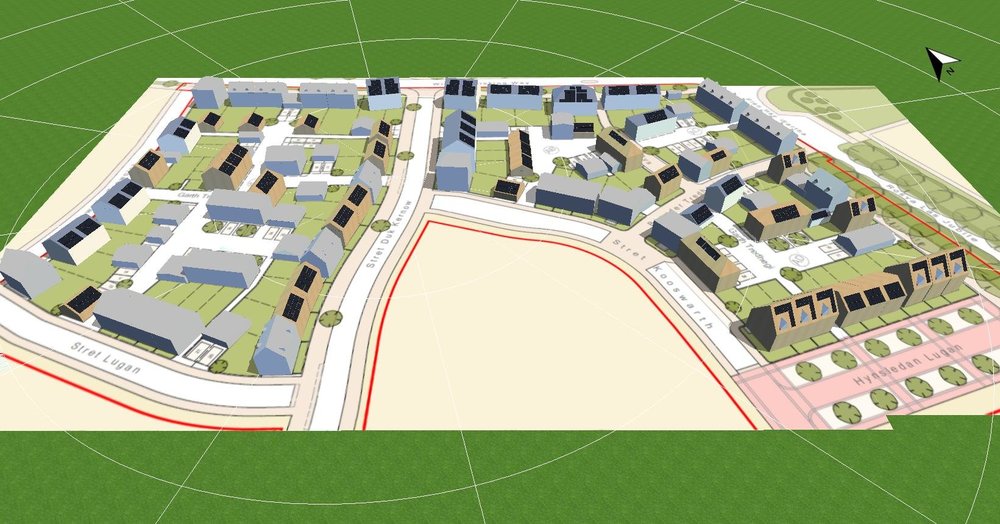
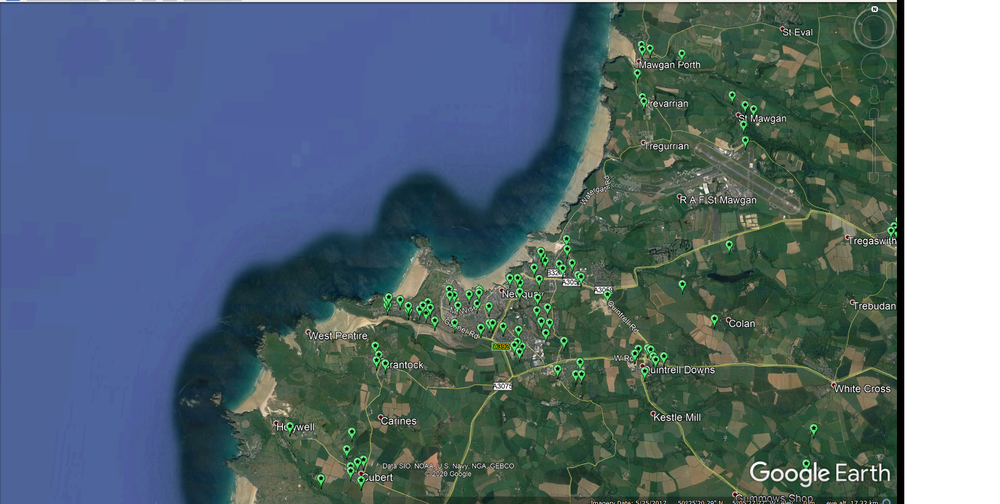
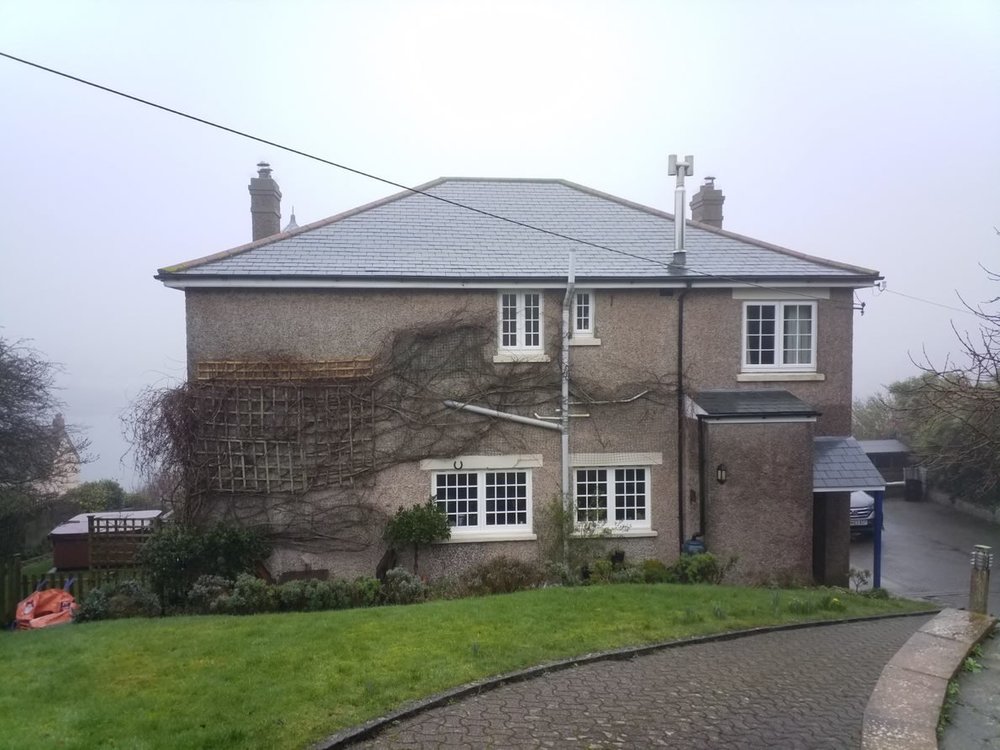
This is a screenshot recording of the above residential development in Cornwall, UK. •90 x Candidate Properties •750 x SunPower Maxeon3 370W All Black panels in-roof •1,320m² total solar PV roof coverage •Annual Energy yield of 270,000kWh •Annual 〖CO〗_2 emissions avoided 163,000 kg •25 year Solar Panel warranty •12 year Inverter warranty •10 year Workmanship warranty Development 5.mp4
-
Is it possible to change the blue sky texture to a different texture? The existing texture is great, yet just for visual reasons, might be nice to set a sunset/sunrise/cloudy/other skyboxes textures. Thanks, Jordan
-
Hello, just putting this question out there; how are Sun position graphs made, and can they be made from PV Sol? Is there a way of illustrating the sun path in PV Sol? The graph below is copied from the PV Sol software help page; https://help.valentin-software.com/pvsol/2020/calculation/irradiation/sun-position/ *and this one is from https://thumbs.dreamstime.com/b/sun-path-illustration-18273849.jpg
-
Hello everyone, please share your best image/design created with PV Sol. Why? - To show and explain the best ways to create visually attractive solar systems. This is mine created with amazing PV Sol; A new-build housing development in the UK - instead of roofing with attractive expensive Cornish slate, the contractor wants to reduce their material costs by installing in-roof panels and experiment with how 'green' they could get. We were able show the contractor thier project in PV Sol by;Importing the site plan, altering the orientation and referencing elevation plans to recreate the neibourhood. Orange buildings highlight PV systems within public view, lighter buildings highlight PV systems with limited public view, grey buildings highlight properties outside consideration. The image went down so well it was reported the contractor specially printed this at poster size to show and tell to Prince Charles of Wales.
-
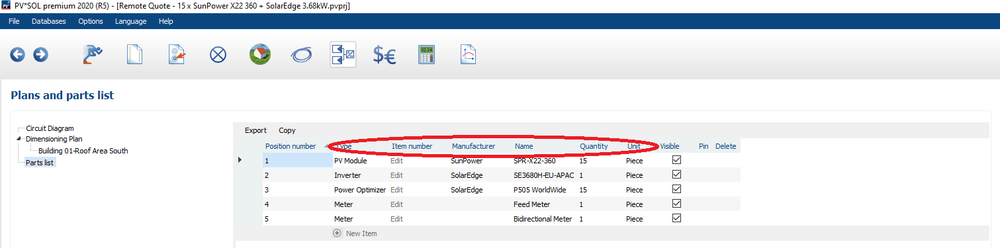
Would be nice to be able to Edit the name of the column headers on the parts list table
-
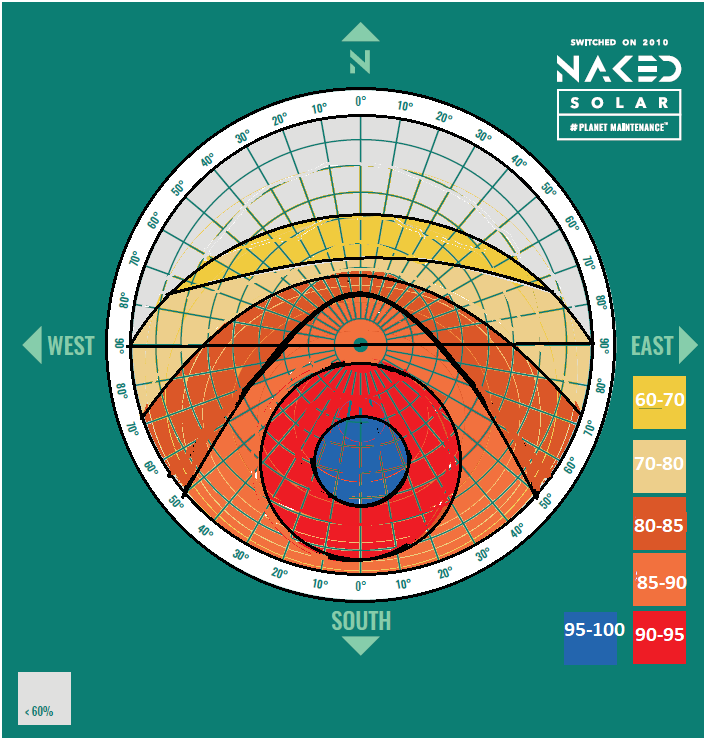
I checked out the Severn England SAP 2012 dataset and these are the results; 14 x SunPower Maxeon2 350 + Solis 3.68kW (no external shading) Orientation from South (Clockwise) 90 105 120 135 150 165 180 195 210 225 240 255 270 Pitch 60 3861 3489 3105 2742 2423 2175 2070 2116 2317 2599 2919 3260 3599 60 Pitch 50 4090 3732 3357 2999 2691 2497 2417 2443 2593 2862 3176 3508 3836 50 40 4286 3961 3622 3301 3053 2902 2833 2849 2955 3165 3488 3748 4047 40 30 4445 4176 3903 3648 3455 3334 3278 3287 3363 3516 3737 3984 4236 30 20 4568 4376 4186 4013 3870 3777 3734 3739 3794 3899 4047 4219 4401 20 10 4640 4541 4446 4359 4288 4237 4210 4211 4239 4290 4361 4448 4544 10 0 4640 4640 4640 4640 4640 4640 4640 4640 4640 4640 4640 4640 4640 0 10 4640 4735 4819 4887 4935 4959 4957 4932 4884 4817 4734 4641 4544 10 20 4568 4747 4906 5034 5123 5167 5166 5120 5033 4909 4756 4584 4401 20 30 4445 4694 4913 5091 5213 5272 5272 5211 5093 4924 4718 4483 4236 30 40 4286 4585 4847 5060 5207 5279 5277 5206 5067 4865 4618 4341 4047 40 50 4090 4420 4712 4946 5106 5191 5186 5101 4954 4733 4458 4156 3836 50 60 3861 4208 4505 4751 4921 4999 4996 4916 4754 4526 4245 3926 3599 60 90 75 60 45 30 15 0 345 330 315 300 285 270 Orientation from South (Clockwise) And then turned them into %'s using the largest value as 100%. Orientation from South Clockwise 90 105 120 135 150 165 180 195 210 225 240 255 270 Pitch 60 73 66 59 52 46 41 39 40 44 49 55 62 68 60 Pitch 50 77 71 64 57 51 47 46 46 49 54 60 66 73 50 40 81 75 69 63 58 55 54 54 56 60 66 71 77 40 30 84 79 74 69 65 63 62 62 64 67 71 75 80 30 20 87 83 79 76 73 72 71 71 72 74 77 80 83 20 10 88 86 84 83 81 80 80 80 80 81 83 84 86 10 0 88 88 88 88 88 88 88 88 88 88 88 88 88 0 10 88 90 91 93 93 94 94 93 93 91 90 88 86 10 20 87 90 93 95 97 98 98 97 95 93 90 87 83 20 30 84 89 93 96 99 100 100 99 96 93 89 85 80 30 40 81 87 92 96 99 100 100 99 96 92 87 82 77 40 50 77 84 89 94 97 98 98 97 94 90 84 79 73 50 60 73 80 85 90 93 95 95 93 90 86 80 74 68 60 90 75 60 45 30 15 0 345 330 315 300 285 270 Orientation from South Clockwise And then rounding each value into a range; Orientation from South Clockwise 90 105 120 135 150 165 180 195 210 225 240 255 270 Pitch 60 75 70 60 55 50 40 40 40 40 50 60 65 70 60 Pitch 50 80 75 65 60 55 50 50 50 50 55 65 70 75 50 40 85 80 70 65 60 60 55 55 60 65 70 75 80 40 30 85 80 75 70 70 65 65 65 65 70 75 80 85 30 20 90 85 80 80 75 75 75 75 75 75 80 85 85 20 10 90 90 85 85 85 85 85 85 85 85 85 85 90 10 0 90 90 90 90 90 90 90 90 90 90 90 90 90 0 10 90 95 95 95 95 95 95 95 95 95 95 90 90 10 20 90 95 95 95 95 100 100 95 95 95 95 90 85 20 30 85 90 95 95 100 100 100 100 95 95 90 90 85 30 40 85 90 95 95 100 100 100 100 95 95 90 85 80 40 50 80 85 90 95 95 100 100 95 95 95 85 80 75 50 60 75 85 90 95 95 95 95 95 95 90 85 75 70 60 90 75 60 45 30 15 0 345 330 315 300 285 270 Orientation from South Clockwise And then quickly transferring (inc. handling the results to make symmetrical for illustration purposes) the results to the previous chart (using Microsoft paint); Yes so it looks much better using the Severn dataset, thank you. (Unlike my inception of that chart ahha). Quick question if anyone is up for it please; speaking to my colleagues we suggest Eastern orientations should generate more kWh than West generation because the panels experience less heat losses as they're cooler in the morning. What else would suggest a difference in generation between the East and West orientations? I'm guessing this is a solar designer elementary question. Thank you!
-
Hi Martin, Perfect thank you so much for that description!! Yours, Jordan Solar before and after.mp4
-
Hi Martin, Thank you for your response!! Aye I've attached the file I've been using. Using version 2020.5.130. I'll take a look at the Severn England climate data. Thanks again! Yours, Jordan PV Sol Orientation and Pitch.pvprj
-
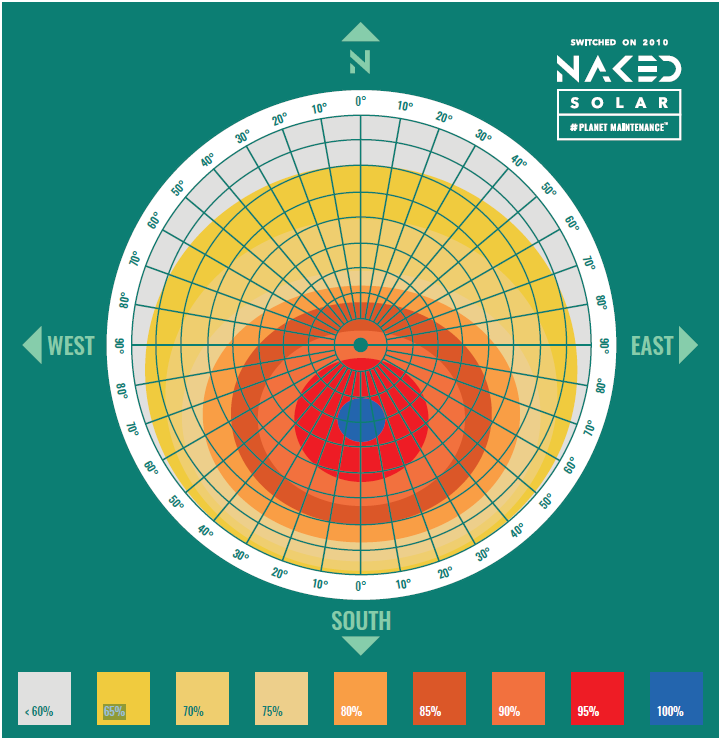
Hi everyone & Valentin, we're creating an orientation and pitch chart to show others clearly the kind of performances to expect. Like a compass - difference in Orientation axis follows around the chart, and difference in pitch runs from the centre to the circumference in smaller to larger circles (0 degrees to 80 degrees pitch). So the first circle from the centre represents 10 degrees pitch, the second circle from the centre represents 20 degrees pitch and so on. It's quite smart and will hopefully give clarity to others than Northern facing systems still produce an acceptable level of generation. This is what we've made so far as an example; ...All we've done above is estimated what we think the chart would look like. We'd like to make a PV Sol experiment on what the chart would actually look like. So to do this I'm noting down the PV Sol PV Generator Energy (AC Grid) value for every different combination of orientation and pitch. I've made one for Newquay UK using 14 SunPower Maxeon2 350 panels and a solis 3.68kw inverter (no shading). Just as an illustration; Just using my simple head I would have initially thought East and West orientations would mirror eachother down the South line, as in East and West would give equal or similar energy - lets say 20° due West would provide the same amount of energy as 20° due East. But then this is Newquay, there's the ocean to the West which would skew the results to favour the West though a big water body Albedo. So then I tried other locations; Baldhu UK, Norfolk UK, Riyadh SA and PV Sol shows West orientations generate more PV Generator Energy (AC Grid) than East orientations. Couple of questions please; is there a location in the world where East and West orientations match PV Generator Energy (AC Grid)? am I missing something here... generally speaking is it normal for West orientations to generate more than East? Thank you everyone!! Yours, Jordan

-
Cheers this helped me also thanks !!
-
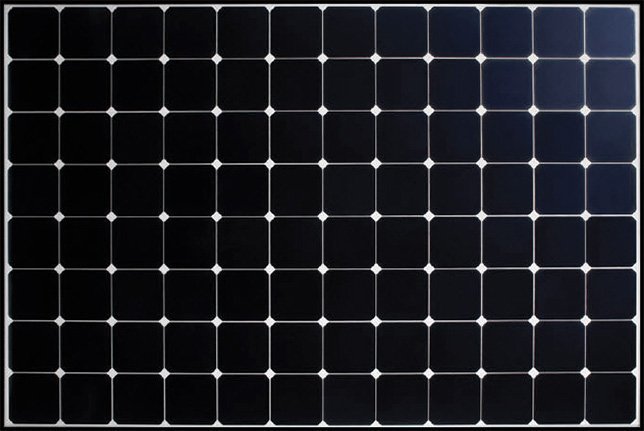
Hi everyone, Regarding PV Sol 3D Design module textures I'd like to ask if there are greater variety of solar panel textures available for PV Sol. In particular something that looks similar to SunPower panels please. Anyone? Cheers!
-
-
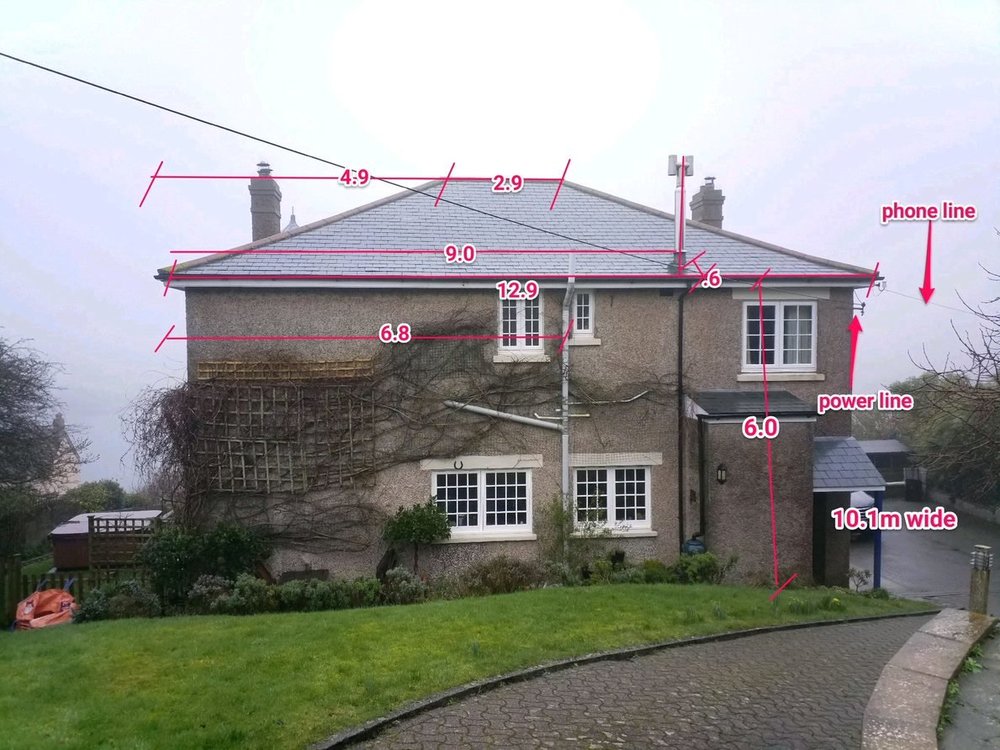
Hi there, just wondering what are the limits to PV Sol photo plan? Have been trying to arrange panels on a hipped trapezoid roof aspect and haven't got very far.


