


developer_bh
-
Posts
60 -
Joined
-
Last visited
-
Days Won
8
Everything posted by developer_bh
-
Hello Ryan, the difference is caused by the minimum SOC and maximum SOC values of the battery system (90%, 20% = 30% "loss" overall, means 70% usable energy). If you calculate the overall energy (460.8 * 53) and multiply it by the value (0.7) you will get the amount displayed in the bottom left corner. Best regards, Ben
-
Hello @Nanta Ragavander, peak shaving is already covered via time controlled charging. Specific limits can be set for the charging period. What is not currently implemented is a limit on the overall power that can be drawn from the grid. Such a function would be technically more challenging to implement, as it could potentially lead to shortages that would have to be taken into account. Best regards, Ben
-
Hey CarlSEL, there are two ways to read your question: Do you mean what is the accuracy of the hourly GHI values from Meteonorm in comparison to the minute values? Or do you mean what is the accurarcy of Meteonorm 8.2 overall? The second question is hard to answer, because the evaluation is not simple. Meteonorm offers TMY's, which means they don't represent a specific year (which you could evaluate if you have the exact weather data + output data of that location), but a represantative year of at least 10 years. On top of that, Meteonorm uses a special synthesis method of satellite data which is part of their business secret. But we evaluated the meteonorm 8.2 files internally in regards to plausibility, similiar to NREL studies [1]. MeteoNorm 3x3(COV).bmp You can see that the meteonorm data for germany has a really low COV, which is a very good result and means that it's very plausible. Best regards, Ben [1] https://www.nrel.gov/grid/solar-resource/assets/data/ases_47760_final.pdf
-
Dear Miro, Thank you very much for your enquiry and the good pictures. I will forward them to the right address. I am pretty sure that we will have more skylight objects in the new 3D environment and that you can set a height above 0.5m. We cannot give a date yet, but in case of your requirements I'm quite optimistic that it will be part of the new 3D. Best regards, Ben
-

PV-Sol-Datei lässt sich nach dem verschicken nicht mehr öffnen
developer_bh replied to Markus H's topic in PV*SOL
Hallo Markus, das ist wirklich ungewöhnlich, denn das Dateiformat (pvprj) sollte normalerweise von PVSOL erkannt werden. Es ist auch normal, wie Tripe-S schon sagt, dass man die Datei auch als Archiv öffnen kann und dann die einzelkomponenten sieht, wie du eingangs gezeigt hast. Hat die Datei vielleicht noch eine andere Endung? Wenn du rechtsklick darauf ausführst, dann auf "Eigenschaften" klickst und dann auf "Details", was wird dort als Name und Typ angegeben? Wenn du magst kannst du mir die Datei gerne einmal per PN senden. Viele Grüße, Ben -
Hello, I translated your message with DeepL. I hope I got it right. Please consider asking in english next time. Could specify which shortcuts you would expect for which action and name some references where this is applied? You can find tutorials in english on our youtube channel https://www.youtube.com/@valentinsoftware/videos We also offer free webinars (in german and english) on our website. https://valentin-software.com/en/training/webinars/ We are trying to improve our performance. If you encounter a bug sending a bugreport helps us identify the weak spots and bugs. We are currently working on a completely new 3D environment which will also perform better. ------------------ Hej, du, Jeg har oversat din besked med DeepL. Jeg håber, jeg gjorde det rigtigt. Overvej venligst at spørge på engelsk næste gang. Kan du specificere, hvilke genveje du forventer til hvilken handling, og nævne nogle referencer, hvor dette anvendes? Du kan finde vejledninger på engelsk på vores youtube-kanal https://www.youtube.com/@valentinsoftware/videos Vi tilbyder også gratis webinarer (på tysk og engelsk) på vores hjemmeside. https://valentin-software.com/en/training/webinars/ Vi forsøger at forbedre vores performance. Hvis du støder på en fejl, kan du sende en fejlrapport, som hjælper os med at identificere de svage punkter og fejlene. Vi arbejder i øjeblikket på et helt nyt 3D-miljø, som også vil fungere bedre. Translated with www.DeepL.com/Translator (free version)
-
Please start a version for Mac. This would be such an improvement
developer_bh replied to Njigba's topic in PV*SOL
Hey Njigba, Unfortunately I cannot give you any specific feedback on this wish other than that this topic is not on our schedule at the moment. This does neither mean that it will never be realized, nor the opposite. Some users figured out how to use PVSOL via wine on mac/linux. While there is no official support, this might be interesting for you. I cannot guarantee that this works of course. You could also try emulating windows on your mac with parallels f.e.. Best regards, Ben -
Probleme mit Darstellung von Sperrflächen im Übersichtsplan
developer_bh replied to Steven's topic in PV*SOL
Hallo Steven, in der neuen 3D Umgebung an der wir momentan mit Hochdruck arbeiten wird es die Möglichkeit geben Sperrflächen für jeden Plan anzuzeigen oder optional auszublenden. Viele Grüße, Ben -
Please see my answer in your other thread
-
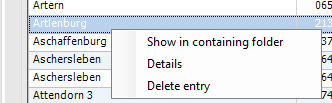
Hello! The (altitude) data is retrieved from external sources. In the program there is no official way to edit the altitude at the moment. However, I will provide you with a script that allows you to change the altitude of a given weatherfile (.wbv). Please follow these steps Download the ps1 script (powershell script, windows) from the attachment of this answer Copy the WBV (f.e. "Berlin.wbv") you want to change in the folder of the script (f.e. Desktop/WbvBackups) twice ("Berlin.wbv" - file to change the altitude, "Berlin_backup.wbv" file as a backup of the old state) Delete the WBV in MeteoSyn via Listview context menu (Headsup - this will delete the file, so make sure you have the backup from step 2) Open a shell in the folder (f.e. Desktop/WbvBackups). You can do this in the explorer by navigating to the destination folder and typing "cmd" in the path, then press Enter. Activate the script by the following command : powershell -File "PATH_TO_THE_SCRIPT" -filePath "PATH_TO_WBV" -newValue ALT_VALUE powershell says it will open the powershell (you usually need administrator rights for that) the string after -File directs to the script path the string after -filePath directs to the WBV path the number after -newValue is the new altitude Import the changed file in meteoSyn Check if the new altitude is correct. Do a simulation with the new file to make sure it works as intended. If everything succeeds you may delete the backup from step 2. I hope this is a good work around for now!? I will forward the feature request to the team to make this process easier from within the program, but cannot give you a specific date for the implementation. Best, Ben change_wbv_altitude_value.ps1


-
Usinge measurement data of diffuse and direct irradiation
developer_bh replied to demanding_client's topic in PV*SOL
Hello, you can change the used model to get a better accuracy depending on the situation in the simulation options. You can also adjust other parameters in that dialog. You will find detailed explanations here : https://help.valentin-software.com/pvsol/2019/calculation/irradiation/diffuse-irradiation/ https://help.valentin-software.com/pvsol/2019/calculation/irradiation/irradiation-onto-inclined-plane/ Here is a quick overview of some models. Erbs model: This model uses empirical correlations to derive the diffuse radiation from the total radiation. It is often used for hourly or daily data and is well suited for mid and low latitudes. Liu-Jordan model: A simple and widely used model based on the assumption that the diffuse radiation is evenly distributed from the sky to the solar modules. It takes into account the solar constant and the zenith angle of the sun to separate the components. Hay-Davies model: The Hay-Davies model takes into account both the direct radiation and the diffuse radiation components caused by scattering in the atmosphere. This model differentiates the diffuse radiation into isotropic and anisotropic components, with the latter being preferentially scattered in the direction of the sun. Perez model: The Perez model is an advanced model that divides diffuse radiation into several components, including isotropic sky diffusion, anisotropic scattering by clouds and reflected radiation. It is particularly suitable for accurate simulations under different atmospheric conditions and is often used in complex PV simulation software. The Hofmann model is usually a good choice. You find more details about it f.e. here https://www.mdpi.com/1996-1073/10/2/248 At the moment you can only use models based on GHI data. Best regards, Ben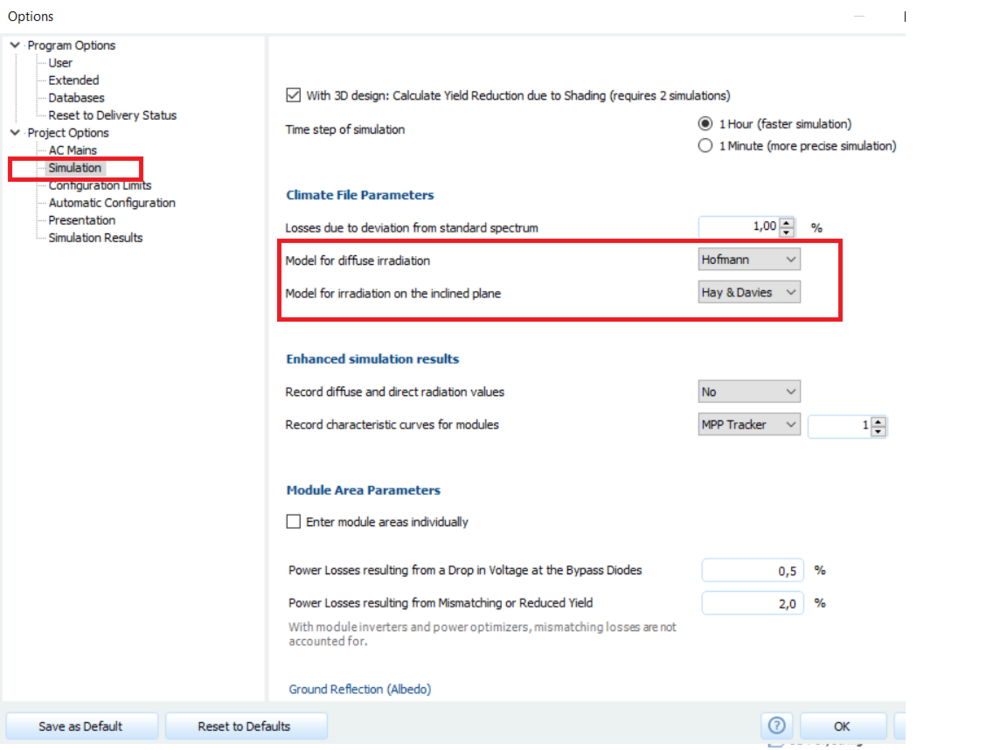
-
Hello Luis, We are working on the new 3D environment, which includes functions such as Undo-Redo. Unfortunately, I can't give you a specific release date yet. Best regards, Ben
-
Hallo Dirk, wir arbeiten hart um unsere Software zu verbessern. Kürzlich gab es eine große Verbesserung mit der Einführung der Google-Solar API. Parallel dazu entwickeln wir, wie Sie wissen, eine neue 3D Umgebung. Zusätzlich gibt es weitere Verbesserungen, so können Sie beispielsweise bald eine neue Klimadatenquelle erwarten. Als Lizenzeigentümer haben Sie vollen Zugang zu allen Verbesserungen. Mir ist aus der Historie bewusst, dass Sie gewisse Punkte schon seit längerer Zeit erwarten. Wir nehmen das ernst und sind bestrebt dies umzusetzen. Ich habe Ihre Wünsche nochmals an das Team weitergeleitet. Aufgrund der Vielzahl an Kundenwünschen und der großen Anzahl bereits gebundener Ressourcen kann ich allerdings keine festen Zusagen machen. Viele Grüße, Ben
-
3D model: load own map section - orientation is broken
developer_bh replied to Ola Andersson's topic in PV*SOL
Hello Ola, thanks for your input. I've forwarded it to the developer. The option will be included again in the upcoming R8 release. Kind regards, Ben -
Übliche Abweichung zwischen detaillierter Planung mit PV-Sol und EO Solar
developer_bh replied to Holger's topic in PV*SOL
Hallo Holger, ein interessantes Thema! Projekte wie EO Solar sind nützlich für eine erstmalige grobe Schätzung des Solarpotenzials auf großen Gebieten. Sie bieten weniger Detailgenauigkeit bei der feinen Abstimmung von Variablen. Mir ist nicht bekannt, wie genau EO Solar das Potenzial einer Fläche berechnet. Eine Vermutung: - Auf der Grundlage der Daten zur Sonneneinstrahlung wird vermutlich die jährliche Leistung der PV-Anlage auf dem Dach des Gebäudes geschätzt. Die zugrundeliegenden Einstrahlungsdaten können sich massiv auf den projizierten Ertrag auswirken. - Die Umwandlung von Sonnenenergie in Elektrizität erfolgt zunächst durch die direkte Aufnahme der Sonnenenergie durch die PV-Module. Unter idealen Bedingungen geht man vermutlich davon aus, dass das gesamte verfügbare Dach mit PV-Paneelen bedeckt werden kann, so dass die von den PV-Paneelen erhaltene Sonneneinstrahlung das Produkt aus Sonneneinstrahlung und effektiver Dachfläche ist. Hier stellt sich die Frage, ob diese idealen Annahmen in der Realität jemals erreicht werden können. Neigungswinkel, Ausrichtungen, Aufbauten usw. werden hier ebenfalls nicht berücksichtigt. - Der Umwandlungswirkungsgrad der PV-Module, d. h. der Wirkungsgrad der Umwandlung von Sonnenenergie durch die PV-Panele in Elektrizität, ist von der Art der PV-Paneele abhängig, z. B. monokristallines Silizium und multikristallines Silizium. Hier stellt sich die Frage, welche Module man zugrundelegt. - Zusätzlich ist der Betriebswirkungsgrad relevant, d. h. die Tatsache, dass das PV-System während des Betriebs einen Teil seiner Energie verliert. - Und schließlich werden auch keinerlei Verschattungen berücksichtigt Es gibt also bereits in dieser kurzen Betrachtung viele Faktoren die zu einem recht großen Unterschied zwischen EO Solar Schätzungen und fein granularen Simulationen führen können. Viele Grüße, Ben -
Hello Ola, I forwarded it to our 3D team. Thanks for Your contribution! Kind regards, Ben
-
Hello Boris and Nils, these models look amazing! Regarding your question: We are not removing any features. To implement the new Google Solar API feature, we had to touch a lot of code to make this work for you. Unfortunately, this bugfix didn't make it into the new version, but as my colleague said, it will be included in the next version. We are also looking into the other points you mentioned. Thank you for your feedback and sorry for the temporary inconvenience! Kind regards, Ben
-
Hello Thura, We accept them as a service for our users who use these files. The OND file can contain all the data PV*SOL needs to add a valid inverter to our database. But as my colleague said, there are no real specifications, the file can have different structures and input data. Some may only contain a fraction of the data we need. That's why there is a check before the import, where you can add the missing data manually. Kind regards, Ben

-
Hello, as my colleague already pointed out you can export the meteo data in the results. We only use TMY's, so if you look for specific data from single years we cannot do that. PVGIS offers that for free (no DWD data). On the TMY API page Mikio named you have the possibility to download CSV's to easily extract the data you need. If you need single years from DWD you can download them from their website (f.e. opendata.dwd.de), but you will need some special programs to read them (.nc format). Best regards, Ben
-
Hello Chloe, PVSOL uses different sources for climate data. These are generated externally by different organizations. The most used is Meteonorm - you can expect an update to Meteonorm 9 soon. We will also add another source (NREL) soon. There are no exact cycles for these updates. Best regards, Ben
- 1 reply
-
- 1
-

-
Importing climate data PVSOL - unrealistic oriëntation
developer_bh replied to Jan K's topic in PV*SOL
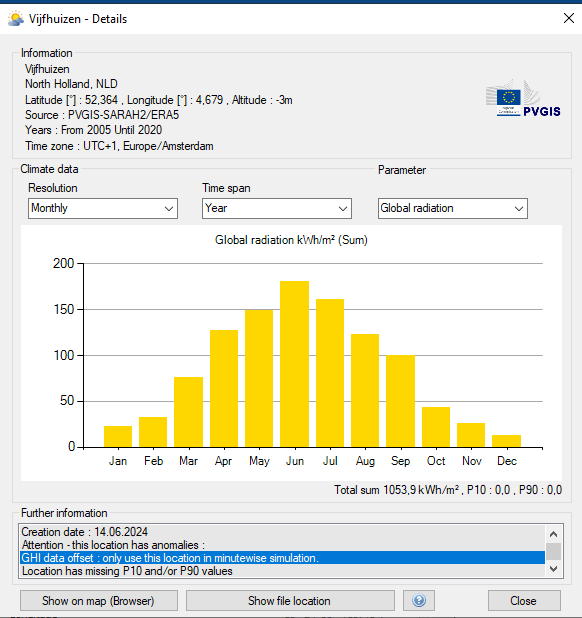
Hello @Jan K, thanks for reaching out. Both climate datasets you submitted have problems. You can see this in the climate details dialog. For the PVGIS file there are problems with the minute synthesis, most probably due to an offset in the timestamps. I'd recommend to use another file and/or source. Do not use this file in hourly-simulations. The second file you sent has some major problems with the data too, maybe because of the timestamps. I didn't do a deep dive yet, but thats most probably the cause. Offset means in that context that the global-radiation values over the daily course are not correlated with the sun-course, so f.e. if the GHI data starts one hour too early you will have unnatural peaks in the morning and too low data in the evening. PVSOL has an auto-correction for this in the minute simulation, but this fails when the offset is not regular or data is missing. That's what the error message means in the second climate file. In the first climate file the PVSOL auto-correction will kick-in in minutewise simulation, so if you want to keep this climate file, better use it in minute-simulations. Do not use the second until you repaired it, it will give you wrong results. Hope this will help you fix the problem. Best, Ben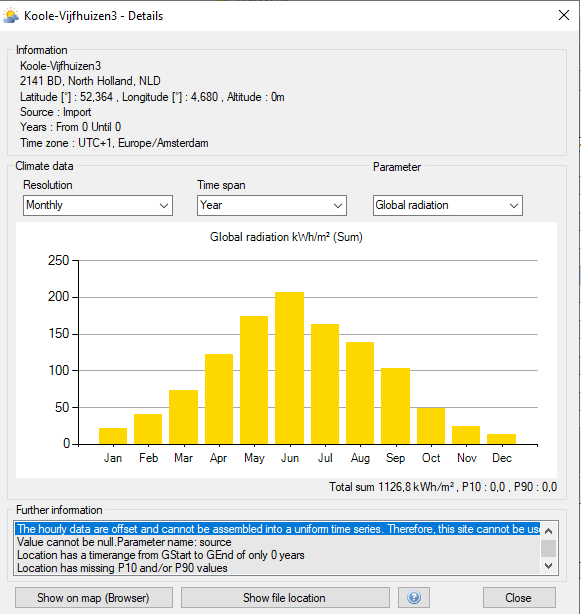
-
Sehr geehrte Frau Schumann, Meteonorm verwendet ein eigens entwickeltes Verfahren bei der verschiedene Parameter einfließen und es z.T. vorkommen kann, dass die herangezogenen Zeiträume der Parameter sich unterscheiden. In Meteonorm 8.2 gibt es diverse Regionen, insbesondere die DACH Region, welche die Globalstrahlungsdaten aus der Periode 2001-2020 heranziehen. Auf ihrer Webseite heisst es im Changelog für die Version 8.2 Auf der Landing-Page von Meteonorm 8 sind noch die mittlerweile veralteten Angaben von 1996-2015 angegeben, die für Meteonorm 8.0-8.1 zutrafen und von uns auch dementsprechend ausgewiesen wurden (1996-2015). Viele Grüße, Ben
-
How to put new brand inverter spec into your online database?
developer_bh replied to Garry's topic in PV*SOL
Hello Garry, thanks for reaching out to us. Please feel free to contact our database team via database@valentin-software.com . After you've received a login you may visit https://pvsol-database.valentin-software.com/ for further processing. Best, Ben -
Hello Indy, the manufacturers can add products themself to our database. We kindly ask them to update / add products so I will forward your request to our team. However, the fastest solution is to add it yourself. You may copy the HPS-6000 and edit the values differing for the HHS-6000 (look at https://de.enfsolar.com/pv/inverter-datasheet/12961 f.e.). Best regards, Ben
-
Help to understand weather data from PVGIS
developer_bh replied to Asger Kappel Skau's topic in PV*SOL
If you want to keep the PVGIS file, I highly recommend doing minutewise simulation. There is an auto-correction of most values and you will most likely see south-oriented have higher values than southwest-oriented panels again.


