-
Posts
107 -
Joined
-
Last visited
-
Days Won
3
hotline_tm last won the day on September 23 2023
hotline_tm had the most liked content!
About hotline_tm

Profile Information
-
Gender
Not Telling
hotline_tm's Achievements
-
Andy started following hotline_tm
-

Smartfox. My-PV, SEMS and other energy management systems
hotline_tm replied to ClenSolarCH's topic in PV*SOL
Hi CleanSolarCH, This is currently only possible by the definition/selection of a load/load profile. The own consumption then appears as saving in the economic calculation because you save some money by paying less to the power company. Kind regards Your Technical Support Team -
Hi Diego, Thank you for sending us your project file. We were able to modify the project file, that you can reopen it in PV*SOL. There was a problem with the number of MPP trackers. The number of trackers of the inverters used in the project file differs from the number of trackers in the current database of PV*SOL. This is probably caused by intermittent changes in the database by the manufacturer. We will send you the modified project by e-mail. Kind regards Your Technical Support Team
-
Hi Diego, Please can you send us the project file, which leads to the error message. Then we can check if the file is damaged and try to reproduce the problem. hotline@valentin-software.com Is there any antivirus or firewall program which can probably block the access of PV*SOL to the database file “pvsol.sdf”? There is an incompatibility with the program Byte Fence. It can also be that there is a problem with the database file or the initialization file. Please try the following: Close the program Delete the initialization file “pvsol.ini”. It can be found in the following folder: C:\Users\<username>\Documents\Valentin EnergieSoftware\PVSOL premium 2017 Delete the database file “pvsol.sdf”. It can be found in the following folder: C:\ProgramData\Valentin EnergieSoftware\PVdatabase\Version4.0 Please note: Program data normally is a hidden folder, So, if it is not shown please enable the option "Show hidden files and folders" in the folder settings. Kind regards Your Technical Support Team
-
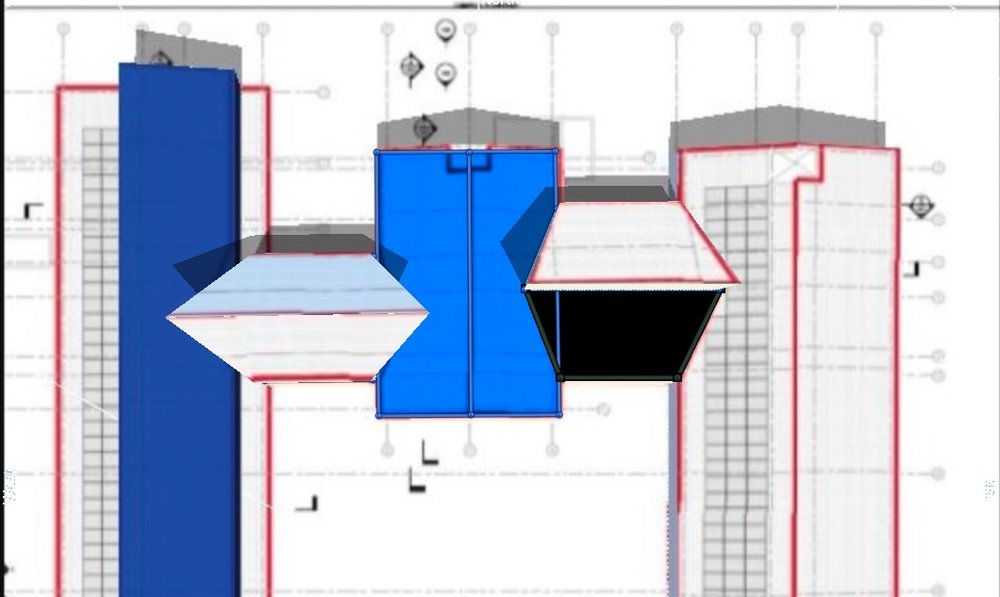
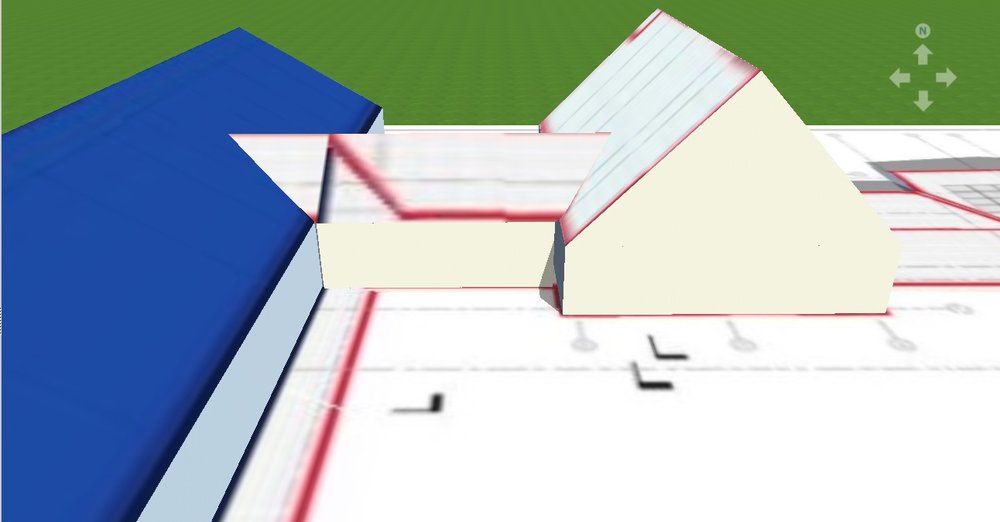
Hi James, You have several options. You can simply draw the polygon overlapping and finally extrude the two buildings. If you use standard buildings with rectangular base area and saddle or hipped roof: you can enlarge the width of the attic, draw the polygon overlapping and extrude, or disable the collision and push the buildings into each other. Kind regards Your Technical Support Team
-
Daer Ahmad, Your problem is indeed based on the module dataset used. The REC data set you used is available in a newer version in the database. If you select the new one, then the specific annual yield as well as the PR are as expected. Kind regards Your Technical Support 2017-09-17_REC twin panels simulation_v5.0_VAL.pvprj
-
Hi Kevin, the limitation to 5000 modules within the 3D visualization is due to due to performance reasons. Unfortunately, there is no way to increase the number of modules. In order to plan a pv plant with more than 5,000 modules, you have to switch to 2D planning, where you are able to define an arbitrary number of module areas with 100,000 modules each. Another option would be to divide your plant into supplants and to simulate separately. The next database update, including the battery systems, will take place in early November. Which battery system you miss in the database? Kind regards Your Technical Support
-
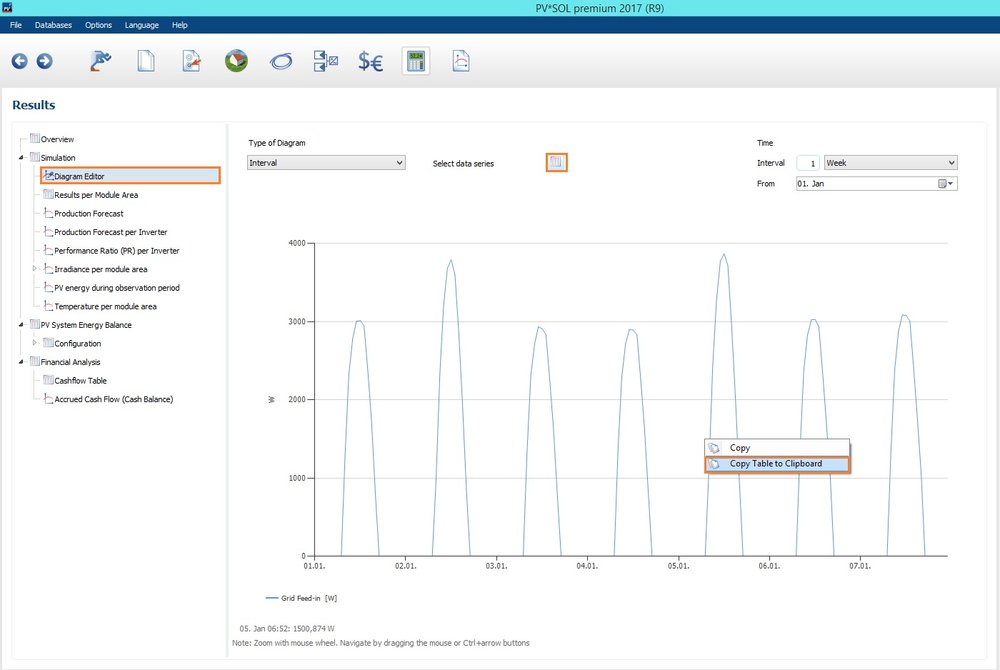
Dear Sebastian, Yes, there would be a possibility in the diagram editor on the results page. You can access the diagram editor by clicking on "Diagram Editor" in the directory tree at the upper left edge of the window. Various simulation results are plotted over time and you can choose which data series you want to display. The display interval as well as the start and end times can be set under "Time". And by right-clicking with the mouse on the graph, you can copy the hourly values into the clipboard and paste it in Excel for example. Regards Your Technical Support
-
Dear Will, this is unfortunately not possible. You cannot enter a limit from which all modules that exceed this limit will be removed automaically. Please note: The percentages on the modules represent the direct radiation reduction over the year and are not equal to the yield reduction due to shading. This depends on the time when the reduction takes place. Reductions during the sunrise and sunset or at the winter time have less impact than at midday in the summer. Regards Your Technical Support
- 1 reply
-
- shading simulation
- shaded panels
- (and 2 more)
-
Daer Ahmad, If we do a simulation, according to your specifications, we get a specific annual yield of ~1800 kWh / kWp and a PR of 88%. We do not believe that this is due to the REC modules, rather to the climatic data used. Have you checked the annual sum of global irradiation. Please send us your project file then we can take a look at it: hotline@valentin-software.com Regards Your Technical Support
-
Hallo Herr Wacker, welche Planungsart verwenden Sie? Der Einfluss des Reihenabstands kann nur in der 3D-Planung im PV*SOL premium berücksichtigt werden. In der 2D-Planung bleiben die gegenseitige Verschattung der Modulreihen und verschattende Objekte, die sich innerhalb der Modulfläche (Schornstein etc.) befinden, unberücksichtigt. Hier können über die Horizontlinie nur mittelnahe bzw. entfernte Objekte erfasst werden. MfG Ihr Support-Team
-
Hallo Goofy, die Darstellung der Bilder im Querformat wurde von vielen Kunden gewünscht, um die Lesbarkeit zu verbessern, die Bilder größer darstellen zu können. In einem der nächsten Updates wird es die Möglichkeit einer optionalen Auswahl „Hoch oder Querformat“ geben. MfG Ihr Technischer Support
- 1 reply
-
- Präsentation
- Querformat
-
(and 1 more)
Tagged with:
-
Hallo Kohli, Die Option "Neuen Standort erzeugen" setzt eine Internetverbindung voraus. Falls Sie keine Internetverbindung haben, wird die Karte ausgeblendet und die Schaltfläche "Internetverbindung testen" eingeblendet. Bitte überprüfen Sie, ob unter Umständen Ihre Firewall MetoSyn den Zugang zum Internet verweigert. Für die Kartendarstellung in MeteoSyn werden generell die Interneteinstellungen genutzt, die auch in der Windows-Systemsteuerung eingetragen wurden. Wenn Sie zum Beispiel einen Proxy verwenden, dann sollte dieser auch dort eingetragen werden. MfG Ihr Technischer Support
-
Hallo dag, zu 1. Nein, das in den Programmoptionen eingestellte Nutzerverzeichnis hat nichts mit dem Ordner Autosave gemein. Das Autosave-Verzeichnis befindet sich immer im Verzeichnis PVSOL 2016 oder PV*SOL 2016 des von Windows vorgesehenen Benutzerordners. zu 2. Der Ordner "Projects" ist der standardmäßig vom Programm vorausgesehene Ordner zum Speichern von Projekten. zu 3. Wenn Sie Ihre Projekte in einem anderen Ordner speichern möchten, müssen Sie genau das gewünschte Nutzerverzeichnis in den Programmoptionen auswählen. MfG Ihr Technischer Support.
-
Hallo dag, da sich die beiden Versionen PV*SOL premium 2016 und PV*SOL 2016 nur durch den 3D-Teil unterscheiden (2D-Teil ist identisch), haben wir darauf verzichtet zwei unterschiedliche Hilfedateien bereitzustellen. MfG Ihr Technischer Support
-
Hallo Energieumdenker, die Möglichkeit, in PV*SOL unterschiedliche Bezugstarife für Haushaltsstrom und Wärmepumpe zu berücksichtigen, ist zurzeit nicht gegeben. Das ist einer der Features, die für die Version im nächsten Jahr angedacht sind. Der Grundpreis hat keinen Einfluss auf die Einsparungen Strombezug. Diese berechnen sich wie folgt: Einsparungen Strombezug = Eigenverbrauch abzgl. Standby-Verbrauch des Wechselrichters multipliziert mit dem Arbeitspreis des Bezugstarifs. Auch die Auswahl der Verbrauchsart (Gewerbe, Privat) ist rein informativ und hat keinen Einfluss auf die Berechnung. MfG Technischer Support & Service
- 2 replies
-
- Strombezug
- Eigenverbrauch
-
(and 1 more)
Tagged with:


