Jimmy
-
Posts
97 -
Joined
-
Last visited
-
Days Won
29
Everything posted by Jimmy
-
Okay, I see what you're trying to do. I'm afraid that I don't think that's possible. And you've tried everything that I can think of. Since this doesn't really effect the inverter configuration I'm assuming that you want to do this because of user interface reasons when designing? Or is it that it shows multiple module areas in the customer presentation?
-
You can also configure multiple module areas together in the inverter config by ctrl-clicking the module areas and then pressing "configure module areas together" Then you get this: You can do that for as many module areas as you like. Hope that helps.

-
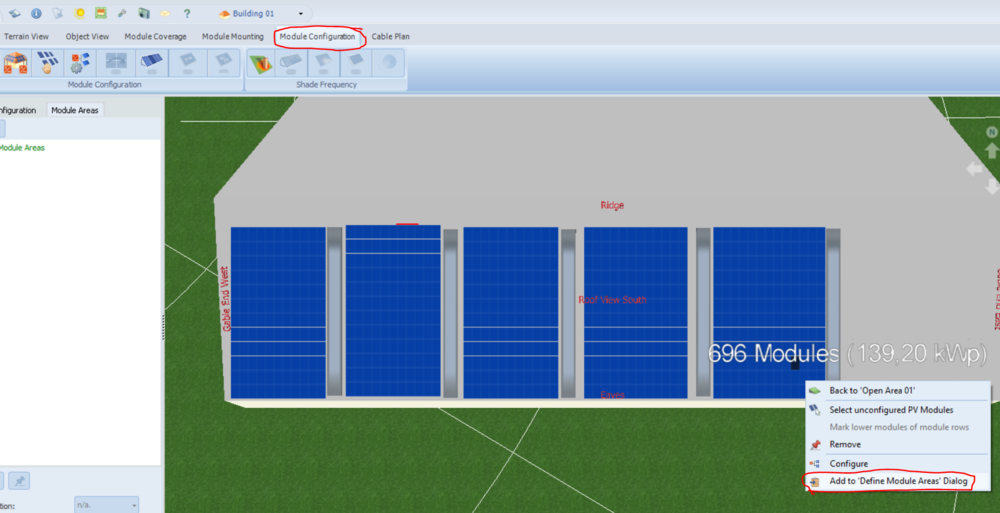
Hi Turtles, I messed up my first comment and have edited it. Here's how you define module areas: Select all panels that you wish to configure together in the "module configuration" tab and the right-click, press "add..."
-
Hi Turtles, I wrote a comment but upon rereading your post I realize that I don't understand what you wish to accomplish. It is possible to combine modules into "module areas", but I'm not sure that that's what you're looking for. It is not possible to edit the grid, it is just panel size+distance. If you can explain a little more why you want to do this and what is wrong I think I might be able to help. Best, Jimmy
-
Just reporting a minor bug here. As the title says. Editing horizon lines again and pressing "ok" instead of cancel re-enables the zoom function.
-
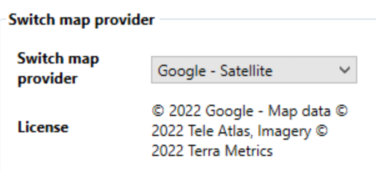
After a bit of digging this isn't a 2022 issue since I get the same results in 2021. Maybe I'm just lucky that I've never encountered this before. If I understand correctly the map data isn't actually Google map data but rather Tele Atlas data. Is that correct?
-
As the title says I've run into an issue. This is the first time that I have this problem and I think that it might be related to the 2022 (R4?) release since I just got that yesterday. Anyway here's what PV*SOL shows as map data when selecting Google satellite And here's the same place when I check it in a browser It seems like PV*SOL is getting old data from Google even though it says that the data is from 2022, I can assure you that this data is at least 2 years old. I can work around this so it's not a big deal for this case but I don't think that it's supposed to be like this and I've never seen any discrepancy between PV*SOL's map and the browser map before.


-
Hi Turtles, Unless you need a good graphical presentation for a customer the easiest way would probably be to create a custom system in "module mounting". So basically a ground mount with the desired dimensions being pre calculated to a certain number of panels. Like this:
-
Hi Vladimír, The Google maps location is basically just a screenshot of the map that is used as a texture for the ground. You can take your own screenshot and replace the texture to make it appear as a new location. Getting the scale 100% correct might prove a challenge though. Regarding your second question. If you've made the building in PV*SOL it isn't possible to export the building. If you plan to use the same building in many different projects it might be better to design the building in another 3D modelling software (like SketchUp) and import that building to each project. Best regards Jimmy
-
Hi Rune, This is usually for one of the following reasons: * You have a title in your columns on A1, remove that if that's the case. * You have the wrong "numer format file" selected. Basically if you have a dot (.) or a comma (,) as a separator, change that to the appropriate. If this doesn't fix it I'll be glad to have a quick look and you can send me the CSV file in a personal message. Best regards Jimmy
-
Hey Frido, I just realized that there's a better function for this than exporting all of the data under the simulation tab. I usually don't use it myself as I only do hourly simulations and my files rarely get larger than 5MB (in the rare cases where I even get the data). Anyway, the way to get specific data is hidden (I don't think it's in any tutorial or in the help pages) in the results tab. Under "Simulation" there's the "Diagram editor". You'll want the type to be diagram to be interval and the select the data series that you want. Set the interval to 365 (or just scroll out when hovering over the diagram) and choose "day". When you see all the data for the whole year in the diagram, right click on the diagram and choose "copy table to clipboard". Paste inte Excel. And I just realized that PV*SOL has the current data I-V curve if you change the diagram type to "characteristics" instead. You are however not able to use that data since you can only look at the I-V curve for a single minute (or hour is that is simulated) at a time. Copying that data to clippboard doesn't give any meaningful data.
-
Hi Frido, There is a way but you'll have to do the conversion yourself. For some reason Valentin gives you all the data except this (which shouldn't be hard to add to a future update since all the data is there). If you go to the simulation tab and export the simulation results to excel (bottom left) you'll get all the values that PV*SOL has used for the simulation. Depending on what you've chosen to simulate there will be a different number of columns but the relevant one should be near the end to the right it should be called something like "Inverter 1 xxxx: Feed-in energy". So now you have your hourly or minute values (depending on the simulation) in kWh. Convert that to kW. Use Ohms Law (P=U*I) to get the value of I since you know both P (kW) and U (voltage in the grid). Remember to account for the number of phases that you have. Best Jimmy
-
Hi Johan, I'm getting much worse results than you, but I think that's because I'm still using 2021 version of PVSOL and they've made some improvements to the texture size limit in the 2022 version (previously only 1024x1024, now it seems to accept 4096x4096). So, for me it looks like you're only missing a single, small, texture from your screenshots and there's only really one texture that stands out to me as different from the rest. I'm just guessing but maybe if you tried to rename "Kloostertuin_GeneratedMat50" to "Kloostertuin_material0050" so that it follows the other naming convention and also change the name in the *.mtl file (it's at the bottom) to the same. If the doesn't work you can try to rebake the textures in Blender to a smaller size and see if that does it. I'm afraid that that's as much as I can think of. Best Jimmy
-
Hi Johan, I'm commenting to bump this up for visibility. Also, if you'd like I'd be happy to take a quick look at the files to see if I can spot anything. Send me a private message if you'd like me to take a look. Best Jimmy
-
Hi Freshwater, You can add multiple consumption profiles on top of each other. Once you've imported your profile just click the add consumption button again and create a custom one for the months you want. I'd share some screenshots but I've reached my data limit on the forum.
-
Automatically allocate area according to maximum PV yield
Jimmy replied to Florian Wendler's topic in PV*SOL
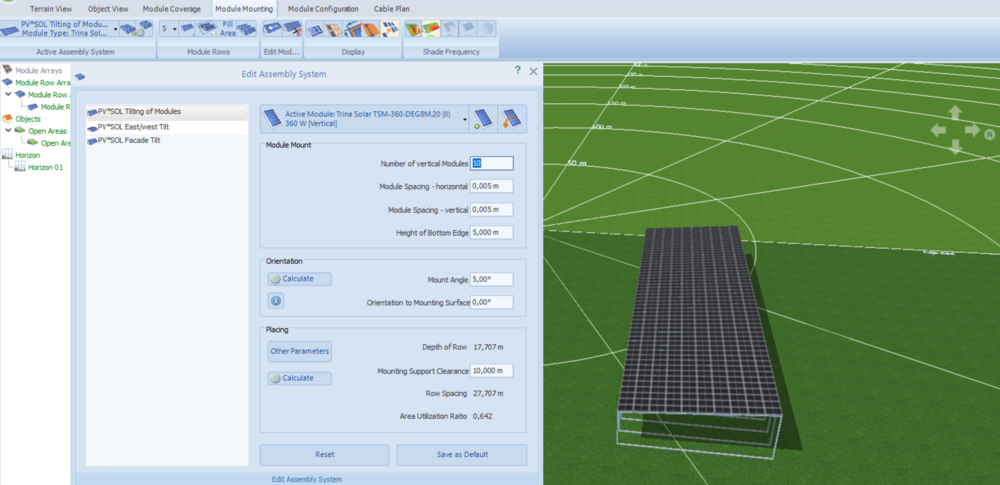
Hi Florian and Martin, I've done this optimization through trial and error (for Sweden though but I expect the broader results to be the same everywhere). The very broad conclusion that I've found is that if you want as much production as possible on a given area you should do a low tilted east/west system rather that a south facing one. Doing a 10° tilted east/west basically allows you to have 0 spacing without significant shading losses. My simulations on this roughly show that an east/west system will give about 40% more production compared with an (almost?) optimal south facing system. And the kWh/kWp is about 10-15% lower on an east/west compared to south facing with "acceptable" row spacing. -
Thanks for the thorough explanation Martin, it helps a lot! Regarding the attachment quota, I suspect that you have that mainly as a spam guard. Could you consider raising mine or perhaps making the quota dependent on contributor rank? I really don't want to delete any of my attachments as that would lower the quality of the posts and comments that I've made that might be useful for others in the future when searching through topics. Kind regards
-
Say that I have a 20 ampere main fuse in the house and I want to use an inverter that can output a little more than that. Do I use the "Maximum Feed-in Power Clipping" under AC Mains, if so how precisely does that work. What's the difference between clipping at the inverter or at the feed in point? And what does it mean when it says that it's clipping "% of PV power"? Can I use the displacement factor instead? How does that work? Or is it perhaps easier to create a new (copy of an) inverter which has the desired AC output? Also, someone broke the upload file size by a factor of 1000 (max size 14.85kB) so I can't upload screenshots.
-
Hi Johan, How many textures are you using? Seems to me like just a few textures are missing and that it may be caused by trying to use too many. I've never used more than 100 textures myself so if you're using slightly more than a round number that might be an indication that there's a limit to how many textures PV*SOL can load. And I have to say, nice models.
-
Hi Jordan, It looks really good, thanks for offering to share with the community! I don't use LinkedIn (or any other social media) anymore, would it be possible for you to send the spreadsheet here via a private message? If so I'd be very happy to try it out and give you some feedback on it. Best regards
-
Hi Radek, The textures in PVSOL are limited to 1024x1024 and PVSOL can only read texture names with a-z and 0-9 characters in the name. So you probably need to change the texture size and possibly rename the file for it to work.
-
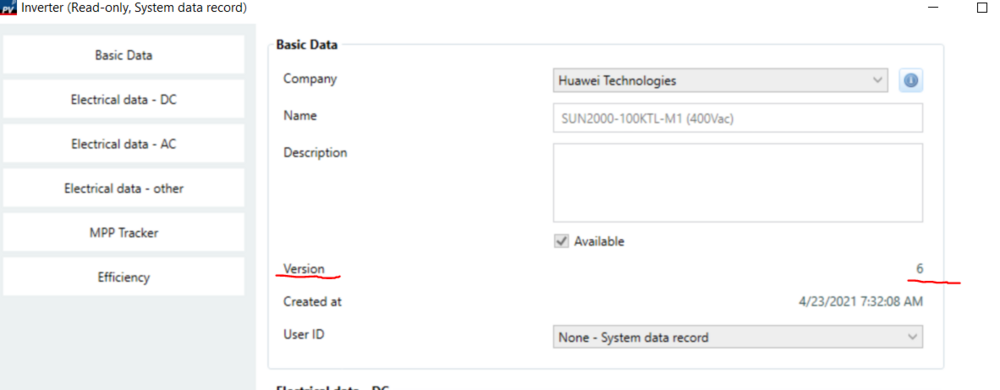
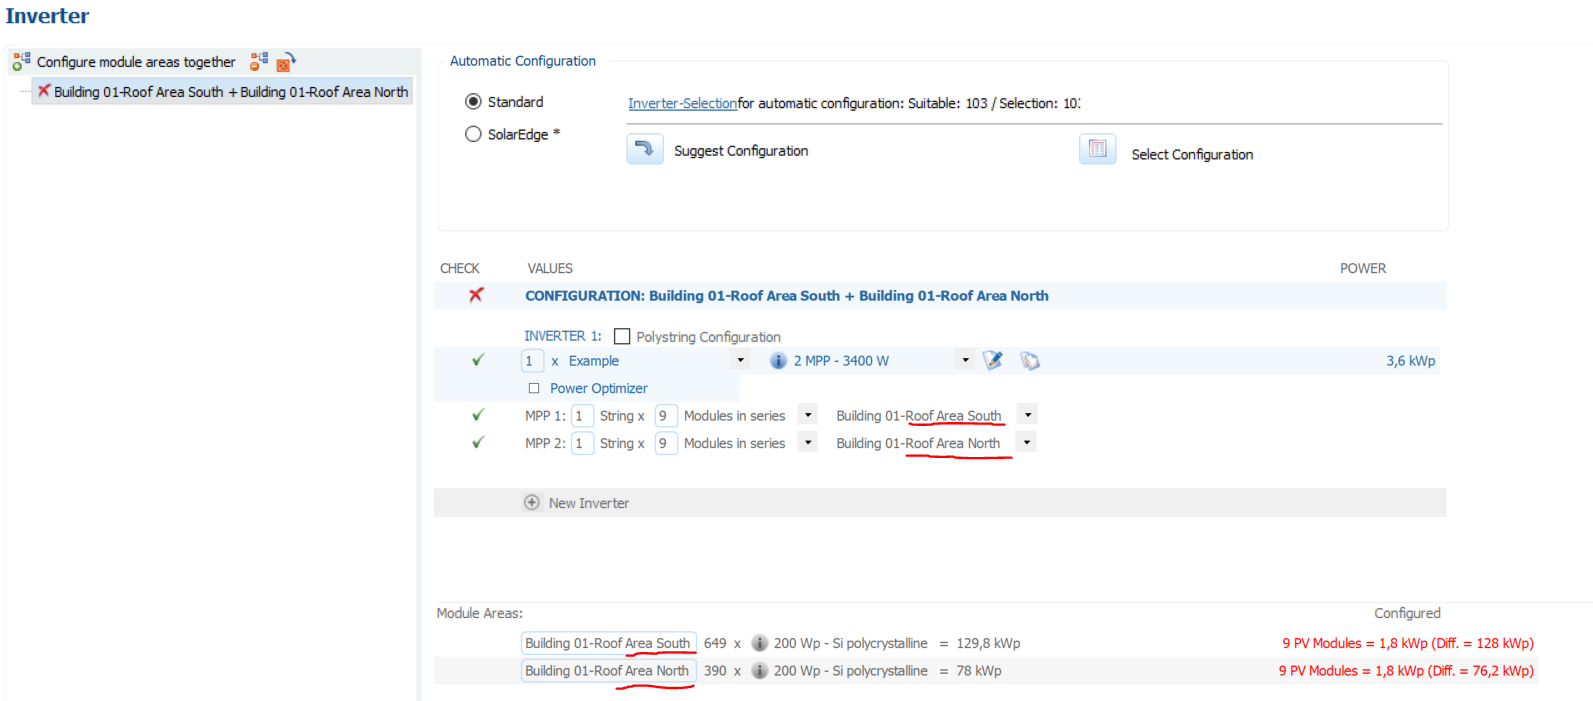
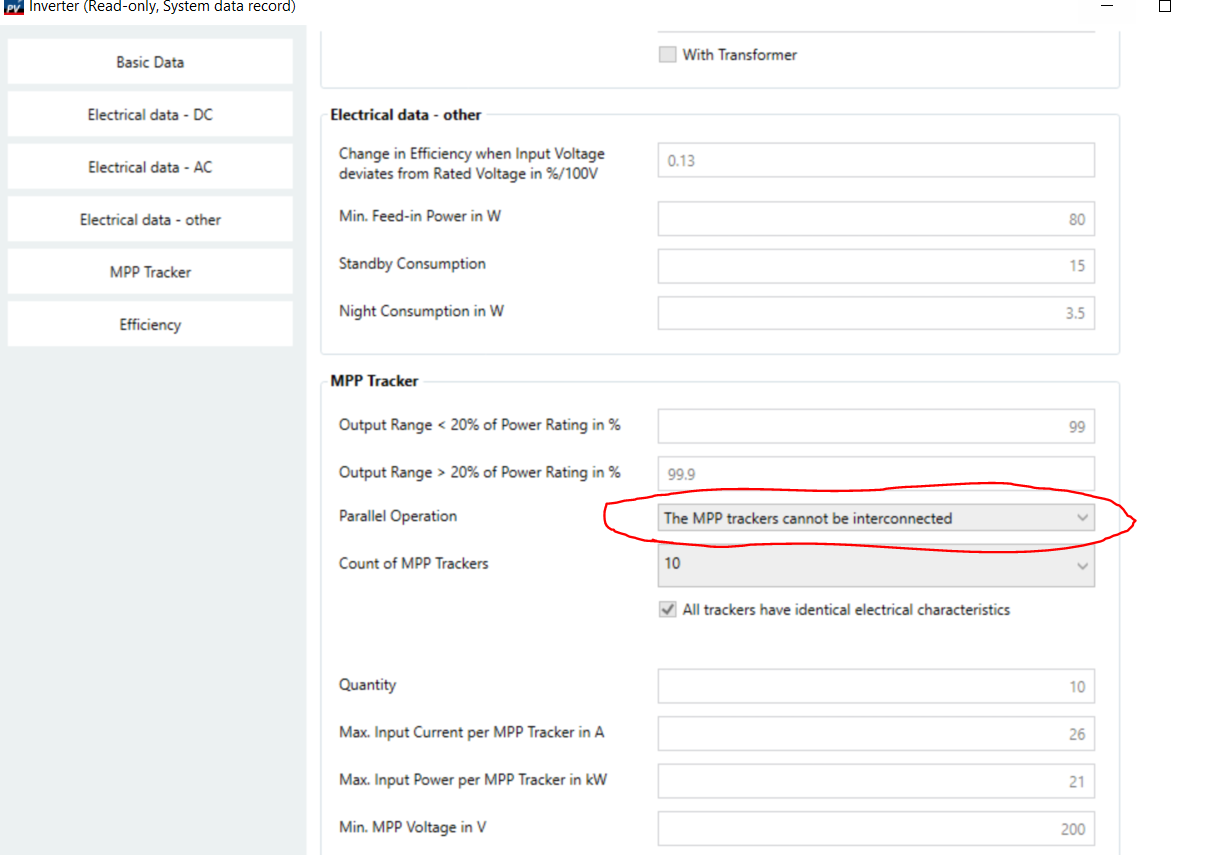
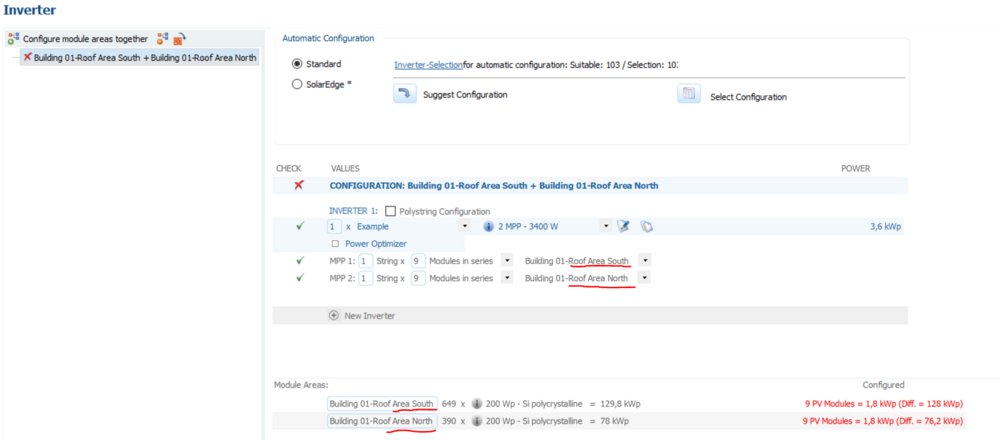
That's really strange because I can't get it to do that config for me either. The inverter specs clearly state that the MPP trackers cannot be interconnected. What version of the inverter information are you using, maybe the data was wrong in a previous version? @developer_mh I think that the voltage is fine. It's outside of the MPPT parameter (1000V) for me but within the "max input voltage" (1100V). It would also depend on the location, azimuth and tilt of the solar panels since PVSOL per default calculates the open circuit voltage at -10°C and 1000W/m2 if I'm not mistaken.